Wool broker reports of solid demand from Asian and European buyers saw every category of fleece gain ground this week and pushed the EMI to 1500¢, even the coarse fibres enjoyed some of the action with rallies between 20-30¢ experienced in some crossbred categories.
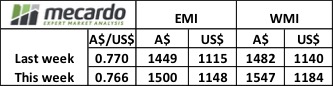 The broad-based demand evident in the higher EMI in both local and US$ terms, gaining 51A¢ and 33US¢, respectively. The EMI not the only indicator to crack $15 this week with the WMI posting a 65A¢ rise, or 44¢ in US$ terms – Figure 1.
Both Wednesday and Thursday saw gains across the board with some of the finer fibres experiencing rallies in excess of 50¢ on a day. Standout performers for the week included 18mpg in Melbourne, up over 100¢ and Sydney 17.5 mpg not far off that with a 94¢ gain.
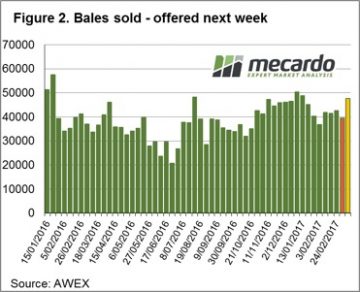 Some exporter reports of just not having access to enough wool to sell at the moment really fuelling the surge. A total of 40,626 bales offered this week with 39,461 sold on the red-hot demand kept the pass in rate contained to 2.9% – Figure 2.
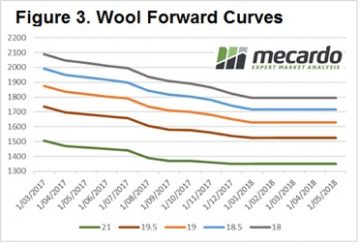
The gains in the physical market spilling over into the Riemann Wool Forward market this week with a flurry of activity as growers get set on some healthy forward levels.
Figure 3 gives an indication as to the current mid-point forward prices for a selection of microns out until May 2018 for those that want to consider levels to get a hedge in place.
The week ahead
Next week we have just under 48,000 bales listed for sale with trading schedule over three days in Melbourne and two days for Sydney/Fremantle.
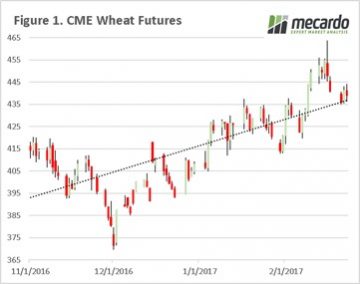 The futures market has improved since the start of harvest, but locally that hasn’t transpired into higher prices. In this week’s comment, we look at the direction of the market since the beginning of November, and where the winners and losers have been.
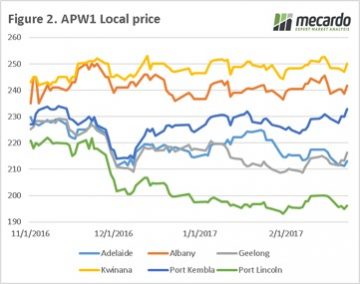 When we look at a local level, at the physical APW1 price (figure 2), the trend across most ports has been for the market to trade in a narrow band and is currently sitting at similar levels to the start of November. The glaring exceptions are Adelaide, Port Lincoln and Geelong which are trading substantially below their start of harvest pricing levels.
 All eyes on the weather. Locally the BOM point towards it being drier than normal for the next three months, which will start to zap away some of that beneficial subsoil moisture that has been retained from the wet winter and spring.
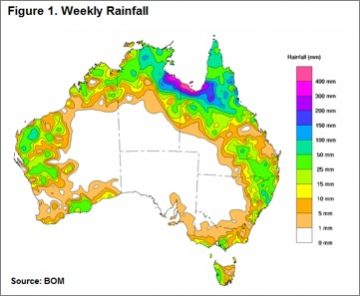 Much of NSW and south-east Queensland has received less than 30mm of rain this week and the drier/hotter than normal spell since the start of the year in the north, combined with the much drier than usual March to May rainfall outlook (recently released from the Bureau), seems to have brought forward some supply with Queensland slaughter levels still tracking higher this week weighing on the broader market.
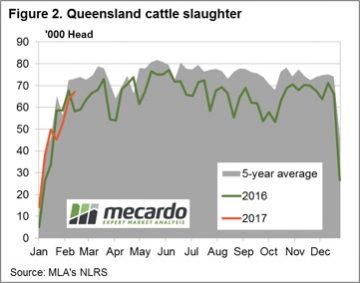 The northern price declines weighing on the Eastern Young Cattle Indicator (EYCI) to see it drift to lows not seen since June 2016 to close the week down 2.4% to 621.75¢/kg cwt – figure 3.
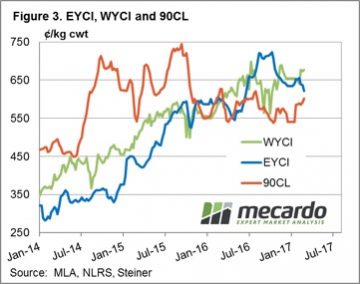
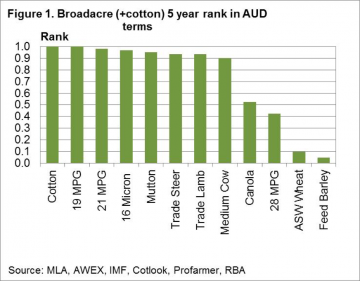 Figure 1 shows the January 2017 five year price rank for a range of broad acre (plus cotton) commodities grown in Australia. The price rank is looked at in Australian dollar terms, as farmers here in Australia see the prices.Basically the news is all good for livestock products (wool and meat) with the exception of crossbred wool (represented here by the 28 MPG). Five year price ranks are all in the top decile, meaning they have traded at lower levels for 90% of more of the past five years. Cotton also is trading in the top decile. At the other end of the scale lie canola, wheat and barley, with canola performing reasonably well by trading at median levels. Wheat and barley are in the bottom decile for the past five years.
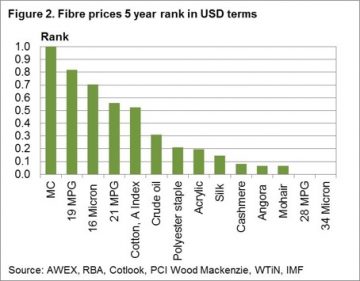 The next step is to look at these commodity prices from outside of Australia. In this case we use US dollar five year percentiles and break the commodities into groups. Figure 2 looks at fibres, including wool from Australia and a range of other apparel fibres. The price ranks range from a high top decile performance by the Merino Cardings indicator through to bottom decile performances by cashmere, angora, mohair and crossbred wool. The merino combing indicators perform well (ranging from the sixth to the ninth decile) well above oil and the synthetic fibres. Cotton comes in close to the 21 MPG in the sixth decile. The longer the disparity continues between the high merino rankings and lower rankings for the major fibres, the more likely some demand will shift out of merino (especially the broader side of 19 micron) to alternative fibres.
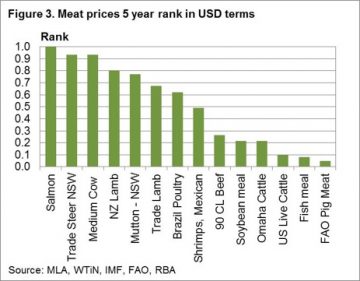 Figure 3 looks at meat and protein prices from around the world. Salmon is the best performer followed by Australian beef and Australasian sheep meat prices. At the other end of the rankings are range of US beef quotes, along with fishmeal and the FAO pig meat index. The big discrepancy between Australian and US beef price ranks indicates some risk to Australian prices if US prices do not lift.