Month: March 2018

May you live in tranquil times.

There is an old Chinese curse, “May you live in interesting times”, used ironically to suggest that uninteresting times are more life enhancing than interesting ones. It seems our friend Donald, would like to consign us to a lifetime of interesting times.

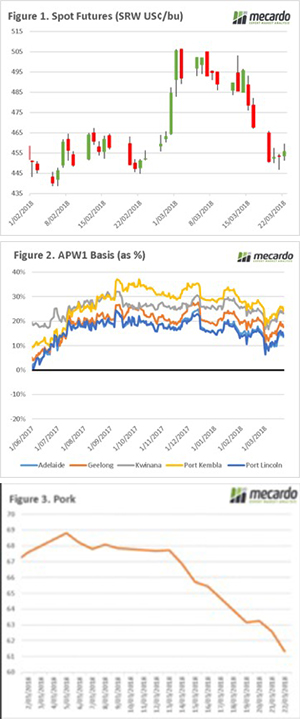
After experiencing strong momentum in March, it seems that gravity has exerted its force on the wheat futures market, with a return to pre-rally levels (figure 1). In recent days much needed rainfall has fallen in US growing regions. It was not unreasonable to expect this fall in the market, especially as the US falls in importance on the international wheat market.

In the Black Sea nations, conditions continue to be promising for the coming season, with winter kill below average. Although the crop will be unlikely to match last year, it will still dominate the export market. Interestingly a Russian government official commented that fertilizer and seed purchases had increased 30% this season.

In figure 2, the basis levels around Australia as a percentage of the overall price has been displayed. During this harvest, basis increased dramatically, becoming a third of the pricing complex in some states. Although since weakened, basis levels remain strong, and protect us from falls in the futures market.

In recent weeks, Trump has been rattling the tariff saber with China. During the Trump election campaign, he ran on a platform of reforms to trade. In his defence, Trump has certainly gone all in, however only time will tell whether this will be to the betterment or detriment to the voters.

In figure 3,4, & 5 (animated), we can see the futures prices of a number of commodities (pork, soya, soya meal), which all have strong links with China. As we can see these markets have experienced strong falls in recent weeks, as discussions become more heated.

On a regular basis China turns around vessels of soya and corn from the US; perhaps we will see an upsurge of cargo rejections in retaliation.

What is assured, is that we are unlikely to be living in tranquil times for the foreseeable future, and black swans are likely to be a regular occurrence.

What does it mean/next week?:

The ‘tariff war’ is going to place Australia in a difficult diplomatic position, between an important customer and a traditional ally.

However, if handled well by our government could provide a favourable result for Australian industries.

Prices succumb to higher throughput.

A jump in throughput across the Eastern seaboard, particularly in NSW and Queensland, puts the heat on cattle prices this week with the Eastern Young Cattle Indicator (EYCI) shedding 3% to finish trading yesterday at 544¢/kg cwt.  

Losses were noted across the board for most cattle specifications, with only East coast trade steers managing to hold their 
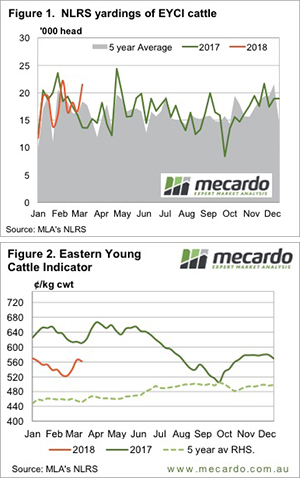
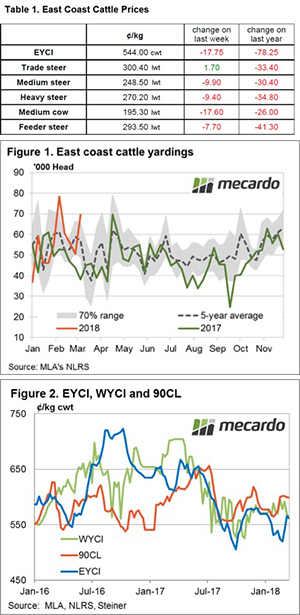
ground, trekking sideways to remain above 300¢/kg lwt. Medium cows taking the biggest hit with an 8% drop to close at 195.3¢/kg lwt – Table 1.

Figure 1 gives a clue to the pressure behind the price weakness – a 37 % lift in cattle throughput along the East coast to see 69,515 head yarded. This reflects a level 22% higher than the seasonal average pattern for this time of the year and extends above the usual range that could be expected given the historic variation in the series, as shown by the yardings pattern breaking outside the top of the grey 70% band. The primary catalysts for the lift in East coast throughput were increases on the week in NSW and Queensland yarding levels of 38% and 87%, respectively.

In the West cattle yardings trended sideways, although this week’s yarding of just over 3,000 head sits 16.5% lower than the average weekly yarding seen in WA since the start of the season. Throughout of young cattle in WA also remained subdued, easing 10% to 1,245 head and the lighter numbers here managed to help the Western Young Cattle Indicator (WYCI) hold its ground at 568.25¢/kg cwt. Offshore markets for 90CL grinding beef continue to maintain a stable footing with the sixth straight week remaining firm near the 600¢ level – Figure 2

What does it mean/next week?:

Its hard to see East coast throughput sitting this elevated for too long and the prospect of the looming Easter break along with the northern rains due, courtesy of Cyclone Nora, will see supply tighten temporarily in any event – which should give some support to prices.

Although, some meat works may take the opportunity to close for maintenance or reduce capacity during the holiday lull so processor buyers may not be as active, impacting demand in the short term. On balance we’re probably looking at some sideways price consolidation as we head to the Easter break.

Wool market bouncing along.

One week down, the next week up. This has been a familiar pattern in recent times although this week the lift in the market was all due to currency movements.

It was a tale of two markets, the opening day was where all the gains were made, with Thursday delivering a modest retracement. The Eastern Market Indicator (EMI) had picked up 27 cents to 1778 cents, ironically retrieving the same amount that was lost last week. In US$ terms the EMI actually lost 2 cents (Figure 1).

The AU$ lost favour during the week, easing by 1.3 cents to $0.775, which accounted for all the increase in the general market indicators. The West also had a good result, the Western Market Indicator (WMI) gained more than last week’s loss seeing a 35-cent improvement to 1869 cents.

The two-market story continued into the relative prices within micron categories; again, AWEX reported that better style wools, while in short supply, were keenly sought, conversely high mid-break wools were increasingly neglected and discounted.

Crossbred types also recovered all last week’s losses, rising between 10 and 20 cents. Merino skirtings followed the fleece types higher for the week and generally held the gains to the close.

Merino Cardings also had a good week, posting around a 30-cent improvement.

As has been the case in recent months, growers responded strategically to the better prices and only passed in 4.0%, down from last week’s 9%, resulting in a clearance to the trade of 36,707 bales.

The week ahead

Next week there is almost an additional 10,000 rostered, with 47,091 bales forecast on offer across the three selling centres.

Due to the Easter break, the two days of sale will be on Tuesday & Wednesday, with a one week break after Easter.

On resumption, another 47,000 bales are offered, which will test the resilience of the market. AWEX report that volumes are predicted to decline after this sale.

Ovine prices trying to build momentum.

Sheep and lamb prices continued a muted upward trend this week, with increases in values across all trade lamb indicators. Mutton values were also higher everywhere except WA, and restockers came back to the market for light lambs.

Figure 1 shows that the Eastern States Trade Lamb Indicator (ESTLI) and the National Mutton Indicator (NMI) are very close to last year’s levels. Additionally, both lamb and mutton prices appear to be following a similar trend in recent weeks, rising from pre-labour day lows to post a few weeks of gains.

There has been reports of stronger demand for light lambs for Greek Easter demand, and this should continue for a week or so yet. Greek Easter is on the 8th of April this year.

Mutton supplies have been on the wane, and prices are finding strength, up above 10% over the last month.  Victoria and NSW both have mutton values over 440¢, but in the west prices lost 41¢ this week to hit 379¢/kg cwt.

Restocker lambs were the biggest mover. The Eastern States Restocker Indicator gained 36¢ on Thursday, and 44¢ for the week. This could have something to do with stronger light lamb demand, but restockers might have read our article from earlier in the week. In NSW 16kg restocker lambs moved back above $100/head (figure 2).

An interesting stat is restocker lambs are still around 10% cheaper than this time last year, despite finished lamb prices being similar. The more expensive grain, and lack of green feed, is no doubt dampening demand for restocker lambs in the current market.

The week ahead

With Easter coming up, and the associated disruptions in lamb kills, it’s going to be a risky week for selling stock in the saleyards. Prices could spike, like they did at Wagga today, if processors don’t have enough stock booked up, but the closer we get to next Friday the smaller the amount of kill space available.

There’s not any real rain on the forecast, and if it stays dry there is a risk of more growers destocking as feed supplies dwindle.

Alpaca – leading the way?

Alpaca numbers in Australia are estimated to be between 170,000 and 450,000, with the higher estimate considerable in view that the sheep flock only numbers around 70 million. Wool ranging from 24 through to 26.8 micron is blended with alpaca. The combination of alpaca numbers and some relationship of the alpaca fibre to wool are behind this brief look at this ancient luxury fibre.

In volume terms Alpaca is middling amongst the animal fibres, on par with mohair and angora volumes. Table 1 shows the estimated world production for 2015 of all fibres (96 million tonnes) and then by animal fibre which ranges from wool (the largest animal fibre) down to guanaco fibre which has an annual production around 2 tonnes.

Some 80% of world alpaca production comes from Peru and Bolivia with three quarters of this production now going to China for processing. In these trade flows alpaca reflects what goes on in the wool market.

Sources from the wool supply chain indicate that 24 to 26.8 micron wool (26.8 being the old Chinese crossbred blend Type 423 which has an average fibre diameter of 26.8 micron) is blended with alpaca. The 24 to 27 micron categories make up 8-10% of wool supply as a rough estimate, which means there is plenty of 24-27 micron wool to blend with alpaca.

Figure 1 compares the 24 MPG and adult alpaca fibre price from the mid-1980s onwards in US dollar terms. Like wool there are a range of alpaca fibre grades related to fibre diameter and the ability to dye (whiter the better for this). In this article the lowest value, adult fibre, has been used in price comparisons. Figure 1 shows the alpaca and 24 micron price series to spend some time positively correlated and other times negatively correlated. The 2002 rally in the 24 MPG was part of the post stockpile liquidation cycle, specific to wool. This cycle upsets wool price relationships generally. If we chop out the 2002 to mid-2004 period, on the assumption we have no stockpile liquidation to worry about since then or in the foreseeable future, the correlation between these two series rises to a respectable 0.69, meaning wool prices can explain nearly 70% of the change in alpaca prices.

In recent years the adult alpaca and 24 MPG have followed a very similar path. Now, note the sharp rise in the alpaca price since the second half of 2017. The price is up by around 60%, and the price gap between alpaca and wool has widened considerably. The temptation to increase the blending of wool into alpaca will be rising.

Figure 2 compares adult alpaca and an acrylic fibre price series from the mid-1980s onwards, in US dollar terms. While the basis between the two series varies, the general trends match up. Rolling 5 year price percentiles for each fibre follow each other quite closely, so the relative expensiveness/cheapness of acrylic fibres is matched by alpaca.

Key points:

  • Adult alpaca fibre price have a good correlation with the 24 MPG.
  • Since mid-2017 the adult alpaca price has risen by a round 60%, with the gap between alpaca and wool prices widening markedly.
  • The general trends in acrylic fibre prices are matched by trends in alpaca prices.

What does this mean?

Recent marked rises in alpaca prices (the adult price is quoted up by some 60% since mid-2017) are of interest for the 24-27 micron wool categories. As alpaca and 24 micron prices have generally had a strong positive correlation, the lift in alpaca price should be supportive for 24-27 micron prices. Acrylic prices have not changed greatly so there is not supporting move in manmade fibres, which might be a limiting factor.

Table 1: 2015 estimated animal fibre world production
Fibre Annual volume tonnes
All fibres 96,354,000
Clean Wool 1,160,000
Silk 170,000
Cashmere 28,760
Mohair 6,260
Alpaca 6,000
Angora 5,630
Yakhair 4,170
Camelhair 2,775
Llama 2,500
Vicuna 7
Guanaco 2
Source: IWTO

I see red I see red I see red.

Another week with red splashed across the board for the wool market. The price retractions were not as severe as last week, yet the further correction meant buyers were more selective with their purchases resulting in significant discounts or rewards for quality.

Even on opening, the market began its slide further into negative territory for most categories.  By the close on Thursday, the Eastern Market Indicator (EMI) had fallen 27 cents to 1751 cents, while in US$ terms the drop was just 13 cents (Figure 1). The AU$ found additional strength during the week, edging up to $0.788, which was evident in the market indicators. The story was similar in the West. The Western Market Indicator (WMI) seeing a 25 cent reduction to 1834 cents.

A reduction in prices meant buyers were able to be more picky with their purchases. AWEX reported that small impurities, which were being overlooked in the rising market, didn’t make it past buyers eyes unnoticed this week and received significant discounts. In particular, wools with high mid breaks of greater than 75 struggled to make the cut. But this also meant that lots possessing mid breaks of less than 40 were rewarded with attractive premiums.

Fine fibres of 19 micron and less were generally subject to reductions of 60 to 70 cents In Northern and Western selling centres. Losses for broader microns averaged 30 to 45 cents. The Southern region was much more forgiving however. Wools of 18.5 to 22 micron seeing drops hovering around 10 cents.

Crossbred types reflected similar outcomes to the Merino market with prices generally discounted between 10 and 20 cents from last week. Merino skirtings saw some mixed results. Those with high VM were heavily discounted while some favoured lots with VM below 5% retained their ground.

As would be expected, the further fall in the market left growers unappeased, leading to a pass in rate of 9% for the 42,645 offered to the trade.

The week ahead

Next week there is 38,849 bales forecast on offer for the three selling centres. A 9% drop on this week’s offering.  Two days of sale on Wednesday and Thursday are set for each Sydney, Melbourne and Fremantle.

Sideways for the week except canola.

It was steady as she goes for wheat and barley markets, while canola has been on the slide this week.  In fact, canola basis weakened further and now sits at levels more expected during a bumper harvest, not a year of tighter supply

Since the heavy fall in December, local canola prices have had trouble recovering, especially in the south.  Figure 1 shows ICE Canolafutures, and the Geelong track price, and basis has widened recently.  The strong rally in ICE Canola futures thanks to deteriorating soybean conditions in South America, wasn’t matched by local values.

Figure 2 shows basis at negative $24/t is the lowest level since the middle of June 2015.  To take advantage of this growers still holding last year’s canola can sell swaps and hold physical.  The would pay off either through ICE Canola falling, or physical prices rising.

As outlined last week local wheat basis has weakened, also due to rising international futures not being matched by local markets.  Having said this, APW in southern markets is $30 stronger than it was at harvest, so it has been a good year for holding.

Whether wheat can find more strength is questionable, we are still hearing it is overpriced in international markets.  Basis could improve, but this would come from CBOT falling.  Again, it’s a case of selling futures or swaps and holding physical.

What does it mean/next week?:

It’s a rare year when over 10% profit is made from holding wheat from harvest through to March.  As such, it might be worth making some sales to take advantage of this, in case current prices disappear as we move towards the northern hemisphere harvest.

Many growers are holding wheat as a drought hedge, which is fine, but it might be worth taking some cover on futures or options to protect against falling international values.  In the case of a delayed autumn break it will be basis that improves, not international prices.

Like lambs to the slaughter.

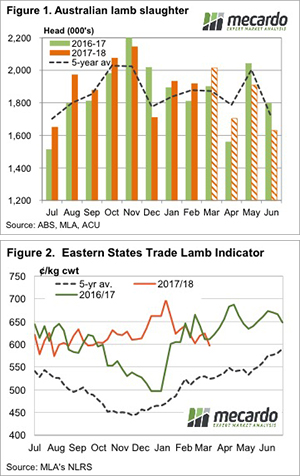
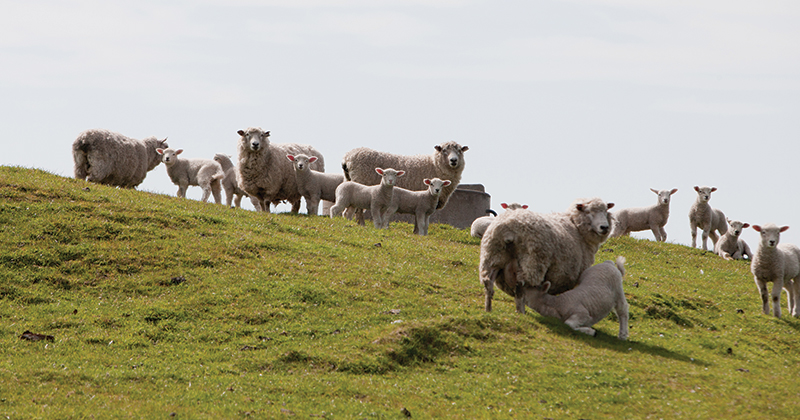
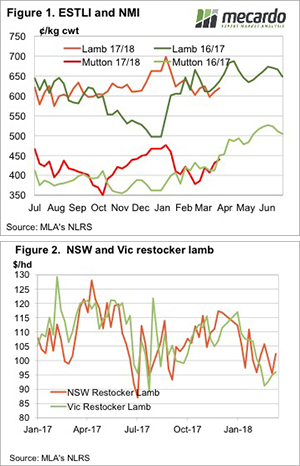
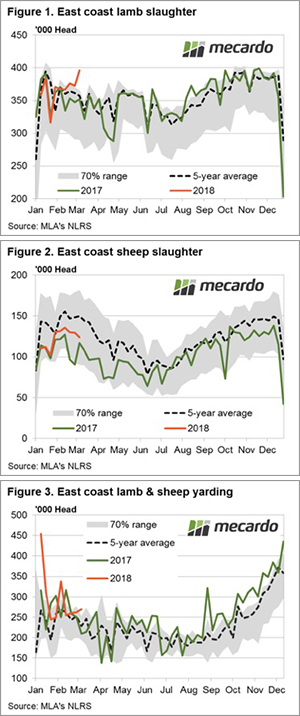
The broad trend in East coast lamb and sheep slaughter numbers continue to be dominated by NSW and Victorian flows at the moment with a spike in lamb slaughter in the previous week, to levels well above normal, unable to dampen prices too vigorously. Similarly, elevated throughput along the East coast for both lamb and sheep was powerless to inhibit demand, particularly for mutton and Merino lamb.

The Eastern States Trade Lamb Indicator (ESTLI) closing slightly firmer, up 1.6% for the week at 607¢/kg cwt while the National Mutton Indicator surged higher, posting a gain of 6.4% to reach 431¢. A similar story for lamb and mutton in the West with the WATLI broadly trekking sideways to finish at 620¢ and WA Mutton up 1% to 420¢. East coast Merino Lamb the best performer this week of the lamb categories up 4.3% to close at 598¢/kg cwt.

Figure 1 highlights the jump in lamb slaughter for the week ending 9th March to see levels on par with the Spring flush with over 396,000 head sent to processors. This reflects a 6.2% lift on the slaughter figures for the previous week and more than a 10% gain on what was sent to the meat works this time last season, or indeed what has been the seasonal average level for the last five years.

East coast sheep slaughter numbers continue to decrease week on week, trending below the five-year average pattern, but higher than this time last season – Figure 2.  Indeed, the mutton slaughter levels reported for the week ending 9th March now sitting 8.7% under the February seasonal peak after successive declines for the past four weeks.

The combined East coast throughput levels for sheep and lamb creeping above the upper boundary of the normal seasonal band this week to break above the 70% range for the third time this year with 269,870 head reportedly changing hands at the sale yard, 18% higher than the average pattern for this time in the season – Figure 3.

What does it mean/next week?:

The relatively high historic prices being received by producers this season at the sale yard continues to attract supply, as identified by the high levels of sheep and lamb throughput shown in figure 3. Additionally, the high slaughter levels (particularly for lamb) we are seeing at the moment means that there’s a good chance there will be less available later into the season.

The fact that the high supply now isn’t having a huge impact upon prices is a good sign for producers, and the prospect of tighter availability later in the season will continue to keep prices robust. Although, into the shorter term the Easter break is just a fortnight away and this may see demand and prices soften a little as meat works look to reduce capacity or close for maintenance over the break.

The rally crashes into a wall of young cattle supply

It would seem those that were hanging out for stronger prices for young cattle have found them, and are taking full advantage.  The only up to date supply data we have is Eastern Young Cattle Indicator (EYCI) yardings, and they made a run this week.

Figure 1 shows a sharp jump in EYCI yardings this week, despite a public holiday in Victoria, with the week to Thursday seeing 29% more young cattle yarded for the week.  The yarding was the second highest level for the year, and the third highest since May 2017.

Demand seems to have largely matched the rally in supply.  The EYCI fell just 3.75¢ for the week to sit at 561¢/kg cwt, which remains 52¢ below the same time last year.

There was some strength in slaughter cattle markets in NSW and Queensland.  Heavy steer indicators gained 8¢ and 12¢ in Queensland and NSW respectively, while Cow Indicators were up 20 and 15¢.

Queensland Cows, at 460¢, are actually 24¢ above the same time last year.  In fact, most Queensland indicators are better than the same time last year, while in the south they are worse.

In export markets the Frozen Cow 90CL indicator has spent yet another week at around 600¢.  It’s now five weeks straight the 90CL has remained steady, and it’s also close to last year’s level.

In the west young cattle prices are maintaining their premium, just.  The WYCI fell 10¢ this week to 563¢/kg cwt. This, and the fact growers seem to be happy with these values, suggest we might be close to ‘fair value’ young cattle at the moment.

What does it mean/next week?:

At this time of year it’s hard to see supply staying strong for long.  If demand can be maintained, especially from restockers, this suggests there might be a bit more in the EYCI rally.  It has a bit of a way to go to reach the 90CL indicator, but rising grain prices might inhibit some of the upside.

Rising lamb slaughter pulling supply forward.

It has been two months since we’ve had a look at short term slaughter forecasts.  Recent heavy lamb and sheep slaughter rates brings us back to look at the theory that killing more stock now means fewer for later.  But how many fewer, and what will it do to price?

Regular readers will know that forecasting supply is a difficult task, but forecasting lambs supply is a bit easier than sheep. While the total years lamb supply is relatively finite, it can be increased by dry seasons as more ewe lambs, and merino wethers are slaughtered.

Sheep are a different story, with slaughter rates highly dependent on weather.  In the last five years we’ve seen swings lower to 18% in 2016, followed by an 8% rise in 2017.

Recent dry weather in key lamb producing areas has seen slaughter rates running stronger at the start of 2018. Figure 1 shows January slaughter was up 2% on last year’s levels, and February up 6% based on estimates from MLA’s weekly slaughter data. For the week and a half of March so far, slaughter is up 10%.  We made an assumption that this will continue.

The strong early 2018 slaughter somewhat made up for the very low levels seen in December, and financial year to February sitting 235,000 head, or 1.6% above the same time last year.  In the scheme of things, lamb slaughter is running pretty close.

The first two weeks of March have seen the higher slaughter levels continue, and the deficit in future supply increase. Assuming MLA’s slaughter slightly higher forecast of 22.5 million head is correct, we have forecast lambs supply for the last three months of the financial year.

April slaughter comes in 8% above last year, May 8% lower and June 11% lower. The total lamb slaughter for the April to June period will be 4% lower if slaughter is to meet the 22.5 million head mark.

Obviously the timing of the autumn break in the south will have a lot of bearing on lamb supply over the coming three months. A late break would be likely to see slaughter around last year levels, maybe higher, while a break towards the end of March could see significantly tighter supply in from April to June.


What does it mean/next week?:

With the heavy slaughter rates of recent weeks it’s easy to see why the Eastern States Trade Lamb Indicator (ESTLI) is tracking under last year’s levels. In fact, it’s a bit surprising it’s as strong as it is.  Demand obviously remains strong, as processors wouldn’t be killing this many if there wasn’t money in it.

Going forward, concern should be mounting about late autumn and winter supply.  There were fewer lambs killed in November and December, but the extras are now all gone, and any move towards flock rebuild, with a reasonable autumn break, could see us back above last year’s levels (figure 2) and heading towards 700¢.

Key Points

  • East coast lambs slaughter has been higher than last year so far in 2018.
  • Stronger slaughter has more than made up for lower kills in November and December.
  • With more lambs exiting the system, supplies could be short after the autumn break.