Month: June 2020

Mutton EOFY sale

With not all processors operating fully and sheep supply tight, sheep slaughter dropped to the lowest level of the season last week. It’s been a while since we last had sheep slaughter this low, In fact, the last time was back in 2011. Luckily prices are more robust now, but the reduced buying interest saw modest falls for mutton.

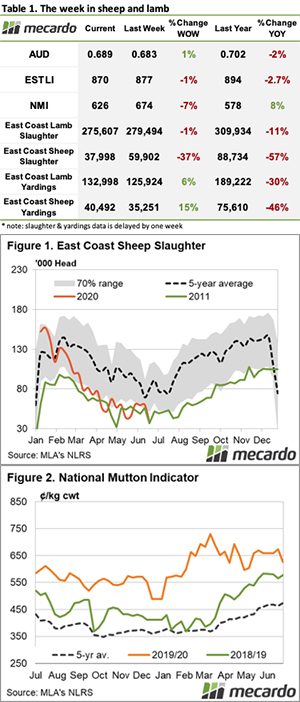
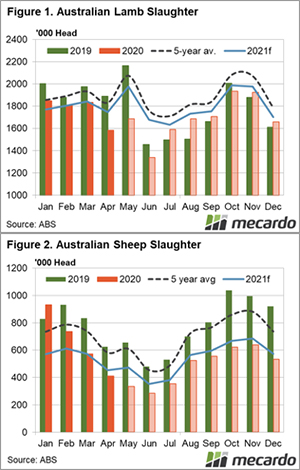
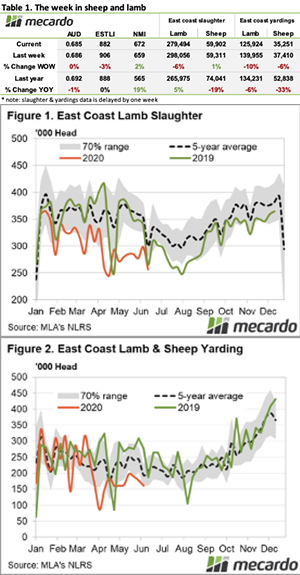
Just 37,998 sheep were processed in the week ending the 19th of June (Figure 1). While it was 53% under the five year average for this time of year, we know it’s far from an average season.  What does make the better comparison is the 2011 season, where the same week saw just a 3% difference in sheep slaughter levels.

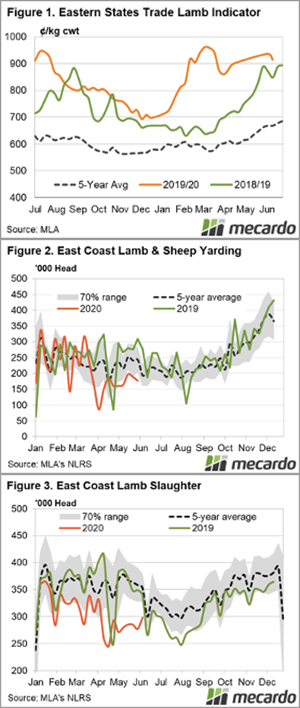
There was enough room for lambs to be processed though. Lamb slaughter held steady at recent levels with most yards reporting a slight lift in lamb supply, particularly heavier lambs.

Victoria, Tasmania and parts of Western Australia all received a good drenching in the week passed, and all saw mutton values dive. The result was a fall of nearly 50¢ for the National Mutton Indicator to 626¢/kg cwt (Figure 2).

There were mixed reports for lamb categories between yards this week, but most moved slightly lower. The Eastern States Trade Lamb Indicator (ESLTI) lost 7¢ on the last week of the 2019/20 sale season to finish at 870¢/kg cwt, just 3% below last years level.

Heavy lambs had a noteable fall of 12¢ to 827¢/kg cwt on the east coast, tested by another week of uncertainty around retail and export demand. A 31¢ decline was recorded for Restocker lambs. Merino lambs were the only category to see a gain on the week, up 14 cents to 804¢/kg cwt.

Next week:

Earlier in the week we looked at how lamb and sheep supply is likely to play as we move closer to spring, and how prices might react (view here). Lamb supplies tend to stay relatively steady at this time of year but rebuilding efforts will keep sheep in paddocks and provide some support to both mutton and lamb prices.

Higher yardings see a slip from record values

A return to more normal yardings last week had the typical effect on prices. The record young cattle prices from last week didn’t hold, with the correction pulling the Eastern Young Cattle Indicator back to levels of the week earlier.

East coast saleyard throughput levels rebounded from the previous weeks low with all states contributing to the lift. A 34% rise saw 46,548 cattle yarded for the week ending the 19th of June.

The number of cattle slaughtered in east coast yards last week was marginally (2%) down on the week prior. Queensland was the only state driving down the figures with 6% fewer cattle slaughtered compared to the week prior. A total of 123,125 cattle were processed which was 20% under the same week last year.

The Eastern Young Cattle Indicator (EYCI) lost 2% on the week, returning back to 754¢/kg. The National Heavy Steer also lost some of last weeks gain, falling 15¢ to 367¢/kg lwt. There was a show of support for cows with the National Medium Cow price receiving a small lift of 5¢ to 279¢/kg lwt. Processor steers ended with week higher again, up 5¢. While Feeder yearling steers lost some ground, moving back under the 400¢ mark to 397¢/kg lwt.

The 90 CL Frozen cow price crept lower last week, falling 1% to 747¢/kg in AUD. The Meat & Livestock Australia Steiner report indicated the “imported beef trade has become especially sluggish”. Slowing beef demand in the US and higher production as processing capacity is back to normal is putting pressure on US cattle values.

Next week:

Recent rain in southern parts of the country will no doubt be reflected in next weeks yarding figure release. Looking at the BOM forecast for the next week, there’s a good chance of another soaking in Tassie and the WA coast, however, the rest of the country is expected to remain fairly dry which won’t do much for demand.

Lamb supplies on road to recovery

  • The latest sheep and lamb industry projections show a slight tightening in annual sheep and lamb supplies.
  • Second half lamb slaughter could be marginally higher than 2019.
  • Forecasts suggest we are in for two years of tight sheep supplies.

As we move through the depths of winter and tight ovine supply, attention is turning to the spring and summer. With winter lambs hitting the ground now, and many of the new season supply coming in the next two months, we take a look at what we might see in terms of lamb and sheep supply for the rest of the year.

Meat & Livestock Australia’s (MLA) industry projections put some figures around total sheep and lamb supply for 2020, and it obviously takes into account what has been slaughtered already.  As such we deduct slaughter to date to give us a rough idea of what MLA think is to come for the rest of the year.

April lamb slaughter came in well below last year’s levels. Coming in at 1.58 million head, April lamb slaughter was 16% below last year, but it has been lower recently, in 2017.

Based on MLA’s weekly slaughter statistics, it looks like May lamb slaughter will be higher than April, but much lower than last year. Lamb slaughter in the first 2 weeks of June has also been lower, and it looks like we might be headed for the tightest slaughter month since at least 2005.

If we take what has been processed to date, and deduct from the latest forecast of 20.6 million head, the supply in the second half of the year looks like figure 1.  If it comes to fruition, lamb supply from July to December will actually be 3% stronger than in 2019.

Figure 1 also shows how the 2021 forecast will pan out with average seasonality.  With a return to more normal seasons, we should see similar slaughter to this year in the first quarter, and stronger levels for the remainder of the year.

There is no such increase on the horizon for sheep supplies.  The second half of 2020 is expected to see slaughter rates 35% lower than in 2019.  Sheep supply is expected to increase in the spring, but it will still be well off the strong levels seen last year.

The forecast for 2021 sheep slaughter is the same as in 2020, at 6.5 million head. Figure 2 shows that normal seasonality will see 2021 slaughter track at similar levels to this year.

What does this mean?

We have noted before that we are currently seeing the low for lamb supply, with year on year increases expected from here. It will be up to demand to drive lamb prices in the spring. Supply will be historically low, but it is hard to see demand matching the levels of last year, and therefore it’s hard to see prices matching either.

Tight sheep supply might save lamb prices. The sheep supply dearth will leave some more space for lamb, if export demand is there to soak them up.

Low yields weighing on the market

The market was again cheaper this week, with the large supply of “low yielding” wool continuing to attract discounts negatively impacting on the EMI as buyers struggled to fit these types into orders. While the drought impact has caused yields to be lower, this week in Mecardo Andrew Woods reported that yield was 3 – 4% lower compared to previous droughts.

The Eastern Market Indicator (EMI) eased again by 32¢ this week to close at 1,139¢, while the Australian dollar also softened to US$0.69. The EMI in USD terms also fell 31¢ to 782¢. Fremantle again had a recess with the Western Market Indicator unchanged at 1,247¢.

Turnover was back below $20 mill to $18.50 million this week, however, the average bale value of $1,307 was $150 per bale up on last week, taking the season to date value to $1,941 million.

After growers withdrew 7.2% of the offering, just 15,800 bales came forward this week, and with a pass-in rate of 10.8%, 14,146 bales were sold.

It was noted this week that area planted to crops has increased year on year, with NSW up 95% on last year to 3.7 million hectares. (Read about this here on Mecardo).

This is confirmation of our concerns that the continued shift to grain production will continue now that the drought has broken, with the challenge for Merino sheep to regain lost acres going to be difficult. Any increase in wool supply in the medium term is likely to be modest at best.

The Crossbred sector ended a positive run with across the board falls of 20 cents.

Cardings proved more resilient despite Sydney reporting a 16-cent fall, Melbourne was dearer by 7 cents.

The week ahead

Next week Fremantle resumes and all centres sell on Tuesday & Wednesday with 30,240 bales on offer.

Supply and price edging lower for lambs

Lower supply wasn’t enough to put a halt to the softening lamb prices this week, with what appears to be wavering demand. Small sheep numbers on the east coast however, did help to lift mutton prices.

So far in June, east coast lamb slaughter has trended 12% below the five year average, and 4% below the tight supply year of 2011. The “tight supply getting tighter” situation continued last week with lamb slaughter down 6% on the week prior (Figure 1).

East coast sheep slaughter was steady for the week ending the 12th of June.  59,902 head were processed which was within the lower end of the 70% range for this time of the season.

Both lamb and sheep yardings were lower again, for a combined throughput of 161,175 head at east coast saleyards (Figure 2). This was 17% below the five year average level for this time in the season. The big drop came from NSW which saw 30% fewer lamb yardings last week compared to week earlier numbers.

Weaker lamb yardings was met with weaker prices. The Eastern States Trade Lamb Indicator lost 24¢ to come back under the magic 900¢ threshold, ending at 882¢/kg cwt. Trade lambs fared better in Western Australia, up 13 cents to 817¢/kg cwt.

Sheep continued to receive support, resulting in a 2% rise in the National Mutton Indicator on the week to close at 672¢/kg cwt.

Next week:

Declining supplies and softening prices is not a good sign for demand. We won’t sound the alarm yet, but the test will come in July when lamb supply starts to ramp up.

Fact or fiction?

Sometimes the hardest thing to do when looking at markets is to decipher the real message from the published message. There is a lot of rhetoric around the China imports and US exports of grain and beans, with polarized stories representing positive and negative positions. It seems that “fake” news is a distinct possibility.

Usually this misinformation revolves around supply, but its intention is to influence market prices. The best approach in understanding the real picture is to refer to the data.

The University of Illinois in their Farm Policy News (FPN), reported that last week was the largest sale of soybeans so far this marketing year was enacted. While 39% of this was to China, a further 39% was to “unknown”, with FPN speculating that this “very likely a lot/most to China” also

When combining other “facts”, the answer becomes even more obvious. Under the agreed trade deal between China & the US, China agreed to take $36.5 billion in American agricultural goods in 2020. In the first 4 months with the disruption as a result of COVID-19, only $4.65 billion was exported.

Both sides have said they have a commitment to honoring the phase 1 deal, so expect a ramping up of activity in the next couple of quarters.

In related news, FPN reported “The American Farm Bureau Federation on Wednesday sent a detailed list of recommendations to Congress to help farmers, stating that even though lawmakers had provided earlier aid, more is needed because of economic losses facing the industry.”

This aid is running into the billions, and with corn prices falling 50 cents per pound to around US$3.20, the National Corn Growers Association calculates a loss of $49 per acre, they are asking for more.

Subsidies are in the news at the moment, (see China barley tariff report) but the consequence of this US government support will be to incentivize US growers to plant, causing the supply demand message to be muted and the continuous high level of world stocks to remain.

The ASX Jan 2021 contract slowly eased this week to end 10 dollars lower at $288, while the US CME Dec 2020 contract pulled back further, ending the week just under $497.

Domestic delivered prices tended to firm this week as buyers sought supply while growers were cautious in accepting old crop pricing, with it still a month or two away before producers have the confidence to sell “new crop”.

Next week?

Weather is all important in influencing grain prices, especially at this time of the year the weather in the Northern hemisphere. This week the news from the US is that after a period of dry the forecast is for rainfall over the next 7 days is predicted, this had the expected result of causing the market to soften.

Domestic focus drives an EYCI record

Young cattle prices continued to climb this week to hit a new high, taking no notice of lower export market values. The local supply situation and decent rainfall forecasts has saleyard prices trading back at global market values.

The Eastern Young Cattle Indicator (EYCI) lifted to find it’s new record on Wednesday at 772¢/kg cwt. This solid rise pushed the EYCI just a few cents above the previous high set in March.

Tight supply helped lend support to most categories of cattle. The heavy steer saw the best result with a weekly gain of 9% to close at 382¢/kg. Medium cows rose 3% to 271¢/kg lwt. It was only the Restocker Steer category that softened, albeit only marginally, down just 5 cents to 271¢/kg lwt. Both Processor and Feeder Steers found some support.

East coast cattle yardings saw a significant drop on the week as shown in Figure 2. Just 34,744 cattle were yarded in the week ending the 12th of May, which was a 29% drop on the week prior. Much of the fall was driven by Queensland with nearly 10,000 fewer head presented, but all states contributed to the tighter supply.

Slaughter levels rebounded slightly after last weeks low, rising 5% to see 126,034 head processed on the east coast. This was 12% under the same week in 2019.

Next week:

There isn’t much rain on the short term forecast for anywhere outside of Victoria, Tassie and the coastal fringe of WA, and even that looks set to be light. However, if slaughter and yardings stay this tight we will continue to see support for prices at the saleyard. How long tight supply can prop up saleyard cattle prices despite weaker export markets is the unknown we’re waiting to play out.

Breaking down the flock

Key Points

  • The ABS Commodities survey data for 2018-19 was released late in May, confirming a new low for the flock.
  • NSW had the biggest decline in sheep numbers, while on a National scale it was lambs on hand which were down the most.
  • Breeding ewe numbers did not hit a new low, meaning the lamb crop could recover quickly.

Many readers will remember filling out the Australian Bureau of Statistics (ABS) Agricultural Commodities survey last July and might be wondering what happened to the data. Well, it was released at the end of May, and we’ve seen the headline flock number, but breaking it down makes for some interesting reading.

There is more data revealed in the ABS Agricultural Commodities Report than we can discuss in one article, so we’ll start with the big numbers.

We know the Australian sheep flock is at an over 100 year low, but in NSW June 2019 marked the lowest sheep flock for the state on record. Figure 1 shows the NSW flock fell 11% from June 2018, but it remains the biggest sheep state, accounting for 34% of the National flock. In 20 years the NSW flock has almost halved.

South Australia also had a heavy fall, losing 10% of their flock, with Victoria down 5%. WA managed to largely maintain their flock, down just 1%, but it has still halved since 1995.

With NSW bearing the brunt of the drought and SA also being heavily impacted, it should be no surprise that those two states saw the biggest downturn.

Despite the total flock being at its lowest level since 1905, the breeding ewe flock at the 30 June 19 was still marginally above 2016 (Figure 2). The flock fell 7%, breeding ewes were down 4.7%, and lambs under 1 year were down 11.6%. Strong wool prices helped save some wethers, with the rams and wether portion of the flock down just 2%.

The lamb portion of the flock was down due to a smaller lamb crop in 2018-19.  In fact, the lamb crop was at its lowest level since our records start in 2009 (Figure 3). The green line shows lambs marked as a proportion of breeding ewes on hand as at June 30 the previous year. Low lamb marking in 2018-19 shows the worst reproductive performance in six years.

We can see that from 2016 the flock bounced back, with the lamb crop coming in at 88% of the ewe flock. While the ewe flock is likely to be lower this year, the lamb crop and flock numbers can recover from lows with a good season.

What does this mean?

The ABS data clearly shows how the season can impact lamb supply and flock change. From this, we can extrapolate that 2019-20 likely had a small lamb crop and that the ewe flock will have eased further. We also know that with the better season currently being experienced, we could see the lamb crop bounce back to 30 million head in 2020-21 or possibly even higher.

Demand & supply heading for a mismatch

Key Points

With harvest underway in parts of the US, the World Agricultural Supply & Demand Estimates (WASDE) report was released last night our time and was met with a neutral response from commentators.

Markets confirmed no surprises with a stable response, with the USDA lifting wheat production by around 1% on the back of stronger South American production. They noted this was slightly more bearish for wheat price outlook.

The expected record US corn crop is combining with other feed grains to look likely to produce a record feed grain crop. The USDA predicting a 5% increase on last year. While the US corn crop is driving 80% of this increase, Mexico, Brazil & Ukraine will also contribute.

This comes at a time when global feed demand has taken a hit with the African Swine Fever wiping out around 70 mill tonne of demand. Adding to this, CV-19 restrictions are impacting gasoline demand, particularly in the US where corn-based ethanol is mandated into the mix.

The upshot is that low prices are expected to continue into next year, with countries who have had their currency devalue against the USD less impacted. This will likely maintain high levels of plantings in these countries despite the lower prices.

Domestically ABARES has lifted the outlook for wheat by 25% from last month, aiming now at a wheat crop of 26.7 mill tonnes, while barley is expected to be up 17% year on year to 10.6 mill tonnes.

All this positive news for production is weighing on prices, with the ASX Jan 2021 contract easing below the $300 mark to $297, while the US CME Dec 2020 contract after testing the 535-cent mark also pulled back 20 cents per bushel to 515 cents.

Domestic delivered prices continued to ease as we move closer to “new crop” pricing and buyers’ seemingly content anticipating a significant export surplus for the coming harvest. Despite the BOM changing their prediction of median rainfall for the winter, many grain regions are comfortable for now with soil moisture levels, and with forecast showers in the week ahead, are daring to feel optimistic about production.

Next week?

The widespread frosts across eastern Australia continued making the prospect of some (any?) rain slightly more urgent.

I am regularly reminded by experienced grain producers that “it’s not in the bin until it’s in the bin”, however, the prospect for a large crop is in place, with a couple of key rain events needed in late winter and spring to create a year to remember.

Resistance found for sheep and lambs

Prices for most sheep and lamb categories took a turn south this week as resistance was found at recent levels. That was despite lower yardings; marking the entry into the tight winter for sheep and lamb supply. 

Saleyard prices for most categories declined week on week. The Eastern States Trade Lamb Indicator (ESTLI) fell 2.4% to 914¢/kg cwt (Figure 1), but what was lost in the East was made up in the West. Trade lambs in Western Australia gained 2.3% to 804¢/kg cwt.

East coast restocker lambs didn’t get the support they’ve enjoyed of late, falling slightly to 961¢/kg cwt. It was light lambs that took the hardest hit though, losing 32 cents or 3.5%.

Mutton prices lost ground as well. The National Mutton indicator shed 2.7% or 18 cents to 659¢/kg cwt.

Last week saw fewer lambs and sheep running through eastern saleyards again. Lamb yardings were down 4%, and sheep yardings down 2% to see a combined 177,365 head yarded (Figure 2). Victoria drove much of the decline in lamb throughput, with nearly 10,000 fewer head yarded.

East coast lamb slaughter has been tracking well below the five year average since February. However, an 8% lift last week saw lamb slaughter was just shy of the five year average seasonal low (Figure 3). On the other hand, sheep slaughter is currently tracking 31% under the five year average.

Next week:

We’ve entered the official winter lull period for lamb and sheep supply and while there have already been weeks of very low slaughter, tight can get tighter. The Winter rainfall forecast has been changeable to say the least, switching again from average to above-average rainfall for most sheep regions. Let’s hope the current forecast sticks.