Category: Financial

A great start to your 2020 grain marketing

The price received in Australia is composed of futures & basis*. It is possible to lock in the futures component through using derivatives (swap/futures etc).

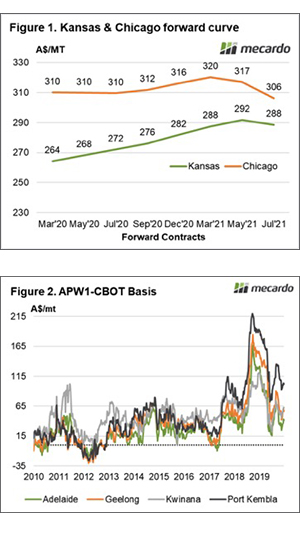
In figure 1 the forward curve is displayed in A$/mt. The forward curve shows the futures price for forward contract months.

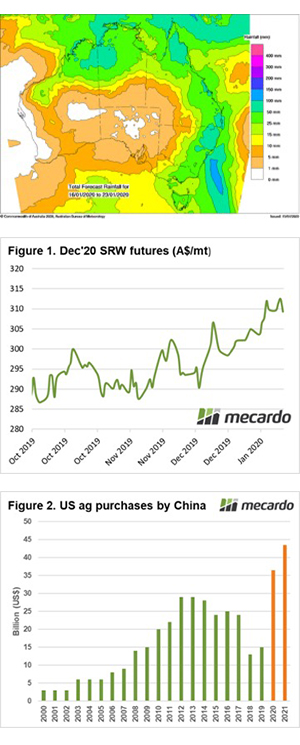
The December 2020 contract which aligns with the Australian harvest is currently trading at A$316/mt. This is the highest level in five years, and provides a strong starting point for marketing grain.

As mentioned before the futures price is one component albeit one which makes up the majority of price (even in drought years – see here).

If using swaps/futures, the final price you receive will effectively be your futures price (A$316) plus basis at the point of physical sale.

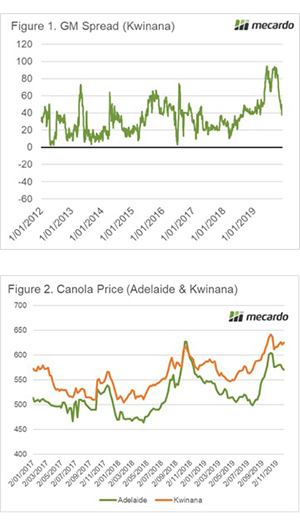
In figure 2 the weekly average basis is displayed since 2010. As we can see the past year and a half is probably not a reliable indicator due to the drought led basis. However, the average across the country is:

  • Adelaide A$28
  • Geelong A$37
  • Kwinana A$49
  • Port Kembla A$51
  • Port Lincoln A$24

On the law of averages locking in futures and selling on average basis would return between A$340 & A$366. A price that is historically attractive.

*For the purpose of this analysis we are not including FX, and basing on a converted futures price.

Remember to listen to the  Commodity Conversation podcast by Mecardo

What does it mean/next week?:

The futures market is currently offering strong levels for December 2020. A large proportion of the rise in recent weeks has been due to geopolitical factors – which could lead to volatility.

At present these are high levels compared to the last five years. If you lock in a little at these levels, and it turns out to be the worst trade you do – it is still likely to be profitable.

Little and often wins the day.

It’s a deal, it’s a steal, it’s the sale of the century

A welcome sound not heard for a long time is being heard throughout large parts of NSW & QLD. The noise of raindrops hitting roofs. This week we cover a few factors from overseas impacting on markets including Egyptian purchases, Russian intervention, and the phase 1 deal.

In recent months weather forecasts have consistently tantalized without providing much (see map). Last week strong rainfall was forecast for large parts of the country, and like the boy who cried wolf – I didn’t believe the forecasts. As time flowed this one seemed to be coming to fruition, but I had been tricked into a false sense of security before.

To my delight, this one has delivered for many. Although this rainfall event would have been more welcome four weeks ago for the summer crop, it has provided a good dump of rain throughout the drought-ridden east coast. Let’s not get too cocky though, we’ll need a little more rain to guarantee a good 2020 crop.

Let’s start with the global market. At the end of last week, the Chicago futures market rallied as Egypt bought 300kmt of wheat, at the highest price since February. This volume was unsurprisingly black sea origin however provided a bullish sentiment for overall pricing.

Russia also assisted with the price rise by intervening in their markets. A new export quota limiting grain exports to 20mmt for the first half of the year was enacted. This caused some concern as interventions by what is now the world’s most important grain exporter could have ramifications for trade flows.

Relations between China and the US seemed to be thawing this week, as both countries agreed to a phase 1 trade deal. This deal is a starting point in improving trade between the two super powers, including the agreement to purchase an increased value in agricultural produce over the next two years.

In the agreement China are set to purchase $36.5bn (A$52bn) in 2020, and $43.5bn(A$63bn) in 2021. To put the scale of the increase in perspective during 2017 China purchased $24bn (A$35bn) in agricultural produce from the US (figure 2).

There is a lot of conjecture at present related to which commodities China will purchase in order to increase their value purchased.

The trade wasn’t overly impressed by the deal as it didn’t contain much detail in regards to products purchased, and included a market value clause:

‘The Parties acknowledge that purchases will be made at market prices based on commercial considerations and that market conditions, particularly in the case of agricultural goods, may dictate the timing of purchases within any given year.’

The big concern for me is that in order to meet these purchase requirements is that the trade flows may prioritise US as an origin for many agricultural commodities.

Remember to listen to the  Commodity Conversation podcast by Mecardo

What does it mean/next week?:

The rain is set to continue through many parts which will provide some confidence for the coming crop. This must be tempered by the reality of it being four months until seeding and nine months from harvest.

The price of GM crops

The South Australian government is debating a bill to end the moratorium on GM crop cultivation. I received information from a contact related to claims from anti-gm activists. I thought it was time to dispel some of the activist’s misunderstandings.

The Mecardo team produced a report on behalf of Grain Producers South Australia (GPSA) and the Agricultural Biotechnology Council of Australia (ABCA). This report was instrumental in removing some of the inaccuracies present in the debate when it comes to pricing.

The information we received was that farmers were avoiding GM crops in Western Australia due to the high premium (up to $100/mt). The reality is that in Western Australia >28% of the Canola crop has been GM in recent years, a considerable volume when you consider that GM is generally used as an agronomic tool for cleaning up paddocks.

In figure 1, the weekly average spread for GM to Non-GM in Kwinana is displayed. As we can see the claim of A$100 discount for GM is a bit of a reach. It has averaged close to A$100 at points during this year. However, it hasn’t stayed there for a particularly wrong period. The average discount for GM canola is A$31.

Co-existence is possible between GM and Non-GM. If it were not, we would be seeing very strong premiums in South Australia against Kwinana due to its GM-free status. However, we do not see this happening (figure 2).

The market never lies. If there was a substantive premium for canola produced in South Australia due to its GM-free status we would see it in the price.

What does it mean for next week?

It is important to understand that GM crops are part of a toolkit for farmers. The discount for GM canola is variable and market-driven.

It is true that there have been large discounts at times, however, it has been close to parity with Non-GM at numerous points over recent years. It is up to farmers to decide whether the agronomic benefits outweigh the discount.

It is important to note that many activists use the GM spread erroneously, depicting that introducing GM canola would result in all canola dropping in price. This is incorrect, it is important to compare apples for apples with Non-GM canola in states to determine if the GM-free status provides a premium for producers. It clearly doesn’t provide a premium.

Weekly Wool Forwards for week ending 4th October 2019

Back to hushed tones and whispers in the forwards market this week, as only two trades agreed.

One trade was dealt for 21 Micron wool and agreed at 1,680¢ for later this month. One trade was dealt for 28 Micron wool and agreed at 920¢ for November.

With the auction spot-price yoyo bouncing so frequently and significantly, it’s difficult to know at what level things will settle, though, looking over the longer term, at least some sideways movement is evident. With a slim auction market, a good picture of average agreed trading price in any MPG becomes difficult. In addition to that, the more producers open themselves to risk by not posting their price, the broader the average gap between post and settle, due to the uncertainty that comes with slim pickings.

Cattle in a holding pattern

Cattle slaughter ticked up last week, but prices continued to track sideways.  The market seems to be in a holding pattern in the east, while the WA premium remains strong.

Just when we thought finished cattle supplies were heading for their spring lull, Victoria and NSW found more cattle, pushing slaughter back to a two month high last week.

Figure 1 shows east coast cattle slaughter at 153,000 head, driven by NSW, which had its second largest week of the year.  Victoria also had a strong rally in yardings, but at 27,000 remains small on the national scale, and relative to earlier in the year.

Figure 1 shows cattle slaughter is still tracking above last year’s level, and it’s not too much of a stretch to say the herd remains in liquidation mode.

In contrast, young cattle supplies have been on the decline.  Figure 2 shows Eastern Young Cattle Indicator (EYCI) dipped back to 12,533 head on Thursday, the lowest full week level for the year.  Southern Queensland was the driver in the lower yardings, with the Roma Store and Dalby markets both falling 40%.

The slight rise in the EYCI (figure 3) was more driven by a shift in weightings than any real increase in price.  Wagga was the biggest yard this week, with 13% of the EYCI, and it was priced at 539¢, while Roma, which fell from the top spot was at 470¢/kg cwt.

Over in the west cattle prices are similar to southern values.  The Western Young Cattle Indicator (WYCI) rallied strongly to 551¢/kg cwt, and is close to over the hooks values.  Historically this is a very good price as we approach peak supply season in the west.

Wool re-discovers its mo-jo

This week the wool market opened strongly in the three selling centres, posting gains across all MPG’s of up to 100 cents. Again, the medium merino types found the strongest price increases, although any “Good style” wools with high N/Ktex in the fine types were also highly sought.

By the week’s end 18 MPG in Melbourne had improved 40 cents, 20 MPG 100 cents, and the Cardings indicator were again above 1,000 cents across all centres. A strong result across the board.

The Eastern Market Indicator (EMI) lifted 67 cents or 4.2% for the week, to finish at 1,542 cents.              The Au$ fell slightly to US $0.676. This saw the EMI in US$ also lift by 40 cents to end the week at 1,087 cents.

Western Australia performed strongly on the opening day posting some significant gains which continued in the early part of Thursday. Of concern though, was that AWEX reported that the “fleece market noticeably softened” toward the end of the week. This resulted in falls of 30 – 70 cents on the day, however over the week the Western Market Indicator rose by 59 cents to close at 1,702 cents.

Sellers reacted to the improved market with the National Pass-in (PI) rate for the week 7.6%. Of interest is that the PI rates plummeted this week to 3.0 & 4.0% in the North & South respectively, recording the lowest rates for the past 3 months. It was a different story in W.A., for the week almost 20% was passed, and on Thursday in the softer market, this figure touched 30%.

When looking back we note that while the EMI is currently at 1600, in May the EMI was 1900 cents with a PI rate at 20%. It seems seller expectation has moderated.

27,458 bales were offered to sale with 25,384 bales cleared to the trade (Figure 2). There have been 102,483 fewer bales sold this season compared to the same period last year. This is an average weekly gap of 10,248 bales.

The dollar value for the week was $47.35 million, for a combined value so far this season of $424.93 million.

The week ahead

Next week a larger offering of 40,999 bales are rostered, falling back to around 30,000 in subsequent weeks.

The market appeared to have shaken off its doldrums retracing 64% of its August fall. We have concern though about the weaker market in Fremantle at the end of the week. The increased offering and soft finish this week will be causing stress to buyer & sellers regarding next weeks market.

Making hay or growing beef

The hay market is set for another hot year.  Supplies have dwindled but there are reports of plenty of crop being cut.  Part of Victoria, South Australia and Tasmania are having good seasons, after dry summers, and this week we look at the numbers on cutting hay, or buying cattle.

Having excess feed is a good problem to have, but deciding how to use it can be tricky.  Hay is expensive, and making it will be preferable to buying in supplementary feed, but the numbers are tighter this year than last.

Last year we went through the costs of making hay in grassfed sheep and cattle operations and the same calculations apply this year.  The cost of making 5t of hay per hectare comes in at $567/ha, or $113/t.

With Dairy Australia quoting good quality pasture hay at $250-300 ex-farm for good quality pasture hay there appears to be a solid margin of $685-835/ha in making hay this year.  Historically we haven’t seen much better margins in hay, but there are always other options.

We know store cattle prices are at all-time lows relative to feeder and finished cattle, so we might be better off converting excess feed into beef rather than selling it to someone else to do the same.

Figure 1 shows some rough numbers on buying 350kg steers and adding 50kgs to take to feeder weight of 400kgs.  We are assuming cattle will take off 5t per hectare, and pastures should be able to handle the heavy stocking rate of 10 steers per hectare at this time of year.  After 60 days cattle should have at least gained 50kgs and possibly more.

Lower end feeder prices of 280¢/kg lwt would result in a margin of $700/ha before any costs were included.  As feeder prices increase the margins improve rapidly.  Angus feeder steers are currently making up to 350¢/kg lwt, which gives a margin per hectare of $3,500, way in front of hay making margins.

What does it mean/next week?:

While making hay will be cheaper than buying hay or grain this year, if grass is surplus to requirements there is likely to be better money in converting it to beef directly.  Obviously there is price and production risk involved in cattle trading, but there is also plenty of risk in making hay.

Those planning to make hay to supplement feed in summer and autumn might be better off trading stock and using the profit to buy grain.  Obviously detailed calculations need to be done on this, but it’s worth thinking about.

Weekly Wool Forwards for week ending 27th September 2019

Forwards has almost, but not quite seen exclusivity toward 19 Micron wool this week.

We saw one trade for 21 Micron wool, agreeing at 1,750¢ for October.

For 19 Micron wool, a mighty ten trades dealt, the lions share of these this year.  Four trades were agreed for October between 1,790¢ and 1,830¢. Another four trades were agreed for November, agreeing between 1,800¢ and 1,850¢. One trade was dealt with each for February and April 2020 and agreed at 1,800¢.

For 19 Micron at least, the trades this week do point toward stabilizing price for the time being, as the recent steadying of confidence continues. We’ll have to wait for more data to see if this trend flows through to the other MPGs and it’s anyone’s guess how long it will last.

China increasing share of New Zealand’s lamb

Earlier in the week we took a look at beef export flows out of New Zealand, and the impact increased Chinese demand was having on markets.  Chinese demand for lamb and mutton has also been on the rise, and it’s an opportune time to look at how New Zealand is faring on this front.

New Zealand is Australia’s only real competitor in lamb export markets, and as such it’s worth checking in on how their exports are tracking.

China has traditionally been a large market for New Zealand.  For the year to date New Zealand has exported more than twice the amount of lamb to China than Australia has.  Over the last five years New Zealand has exported 64% more lamb to China than Australia.  Needless to say China is a major market for New Zealand.

Despite being historically strong, New Zealand’s exports to China have been even stronger this year.  Figure 1 shows that every month except May have seen larger NZ lamb exports to China, and this has seen the year to July exports up 19% on last year, and 37.5% on the five year average.


The increases in exports to China have not been due to stronger production.  Figure 2 shows China’s share of New Zealand’s beef exports has grown this year.  For the year to date 45% of New Zealand’s lamb exports have gone to China.  China’s share was well up on 37% in 2018 and 32% average over five years.

Figure 1 shows there is plenty of seasonality in New Zealand’s exports to China, and while this is a function of production seasonality, China’s share of exports does decline in winter.  A smaller share for China when production dips is likely due to European markets having more money.

China’s increased volume and share or New Zealand’s lamb exports has come largely at the expense of the United Kingdom.  The UK is New Zealand’s second largest export market, yet its share lamb exports has fallen from 16% in the year to July 2018 to 12% in 2019.  The US is the third largest market to NZ lamb, and managed to maintain its share at 7%.

What does it mean/next week?:

Increasing demand for lamb from China has been impacting our friends over the ditch as well.  We can see declining production and exports from New Zealand in June and July obviously helped push our prices higher.

Moving forward China will start getting more lamb out of New Zealand in November and December, and this will help keep a lid on price rises here.  However, the increasing share of lamb going to China means other markets might have to come to Australia to find their fill.

Lamb up mutton down

The lamb market seems to have found a level it like, but mutton continued to slide this week.  It doesn’t seem price moves were in response to supply, with demand shifts driving markets early in the spring.

The data is a week old, but east coast lamb slaughter to the end of last week saw the rise in lamb slaughter slow.  Figure 1 shows lamb slaughter still running ahead of last year, but at similar level to 2016.  Back in 2016 the Eastern States Trade Lamb Indicator (ESTLI) sat at 621¢ in mid-September.  It was a great price for the time, but now the market is 190¢ stronger.

Figure 2 shows the ESTLI has now been steady for a month despite rising slaughter levels.  This gives an indication that processors might be able to move lamb at around 800¢, and are happy to increase slaughter levels at this price.  There is a way to go in rising supply before chains are full and prices come under significant pressure.

Rising lamb supplies are putting pressure on mutton values.  The National Mutton Indicator (NMI) fell another 35¢ this week to hit a six month low.  Mutton does remain 33¢ above the levels of this time last year, but that was under very strong supply.

Prices in the west have also found a base, but at a lower level.  The WATLI gained 13¢ this week to move back to 646¢/kg cwt and not far off over the hooks quotes.  WA Mutton was also up, at 451¢ now at a much smaller discount to the east coast.


What does it mean/next week?:

Unless you are on the North West coast of the country the latest Bureau of Meteorology (BOM) three month outlook, released yesterday, was not very promising.  There is a less than 35% chance of anywhere on the east coast getting median rainfall from October to December.

Normally this would mean increased supply and lower prices, but the dwindling flock will mean it can’t be as strong as last year.