Category: Grain

The Baltic Dry Index has capsized

Australia is a net exporter of grains, most of which will make its way out of the continent on bulk vessels. Grains are undifferentiated commodities with largely no difference between origins, therefore the cost of logistics becomes a primary driver of competitiveness. In this article we dive into the Baltic Dry Index and its impact on markets.

So what is the Baltic Dry Index (BDI)? The BDI is an index which tracks the cost of bulk shipping around the world. The index is calculated on a daily basis and covers twenty typical routes using three vessel types (Capesize, Panamax and Supramax.) This gives an indication of the trend in price movement, and provides an insight into how much it will cost to transport bulk commodities i.e. a lower BDI would indicate reduced freight costs.

This is important for Australian producers as we typically export the majority of our grain and oilseed production. A low freight rate therefore reduces the benefit of geographical advantage.

The BDI has a secondary function. It is considered by many to be a leading economic indicator. The cargoes typically transported by bulk vessels are commodities requiring further processing (iron ore, coal, grains etc) to create a product. This gives a potential indication of future economic growth, as the demand for raw commodities such as iron ore will increase as economies grow.


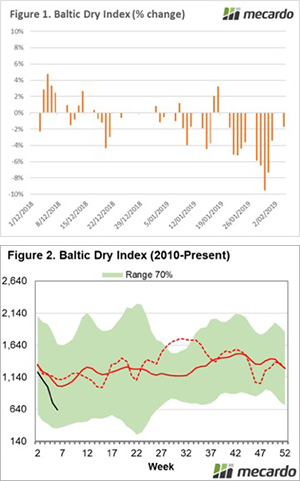
So why are we talking about it? The BDI has submerged (pardon the pun) in recent weeks. In figure 1, the daily change in the BDI is displayed since the start of December. The last positive move was on the 8th of January. This has resulted in a 50.5% fall in the index since the start of January.

It is not however wholly unexpected to see a fall in the BDI, as seasonal trends do tend to show a dip in the first two months of the year (figure 2). The index currently sits at 634, which is a low level albeit within the range which has been experienced during this decade.

So why has it fallen? There are several theories as to why the BDI has capsized, and a combination of all are likely to have had an impact:

  • The Vale dam collapse in Brazil which has led to the loss of 134 lives has resulted in up to forty million tonnes of iron ore being removed from the market, as Vale decommissions similar facilities.
  • The Chinese economy looks to be taking a turn for the worse with the Caixin manufacturing purchasing managers index falling below expectations signaling a deterioration in the manufacturing sector.
  • Seasonal slow down ahead of the Chinese lunar new year.
  • Continued overcapacity of bulk vessels and mismatches of vessel sizes.

What does it mean/next week?:

If the sharp decline in the BDI endures, this does not bode well for global economies – especially China. The Australian economy is heavily reliant upon China as a trading partner, and any fall in their buying power will have an impact on many of our commodities and food products.

The fall in the index along with poor economic data emerging in China may spur a quick resolution by the Chinese delegation in the Trump tariff talks.

The fall in the BDI does not mean that grain prices will fall, however it does mean that traditional trade flows become less important as shipping costs fall.

Key Points

  • The BDI is an indicator of the cost of bulk shipping rates, but also holds a secondary function as a primary economic indicator.
  • The BDI has keeled over, sinking to the depths of 634 from 1282 at the start of January.
  • The sudden fall could point towards a coming slowdown in the global economy.

Plan for the worst; hope for the best (in the west).

In this update I take a look at the most recent BOM three month climate outlook. What does it mean for the 2019/20 crop? In other news there could be some excitement on the market as the USDA start releasing data after a >1 month hiatus, and the Chinese-US negotiations comes to a head.

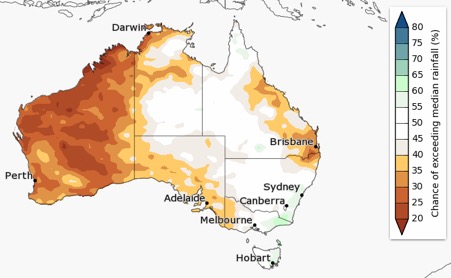
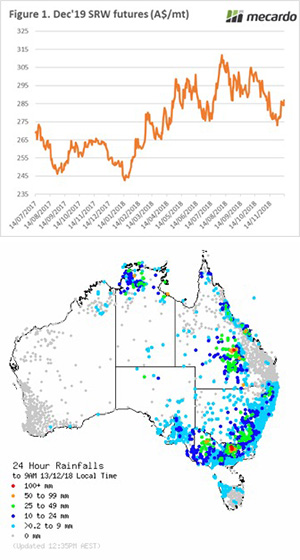
The bureau of meteorology has released its three month climate outlook. It doesn’t look good for Queensland and the West. After a fantastic year where WA produced a 17.5mmt crop, pre season rainfall has a limited chance of exceeding the median. This will put a dampener on expectations for the coming season. However, I have a few thoughts when it comes to this projection:

1. Weather projections can be highly volatile, and this may not be realized.

  1. Although subsoil moisture prior to planting is very welcome, it doesn’t make the crop.

There are a range of factors that will determine the development of the 2019/20 crop, however on the 1st of February it is far to early to judge the end result. It is always best to ‘plan for the worst, hope for the best’.

The futures market lost ground this week with spot futures back A$5 (figure 1). The market has remained subdued whilst awaiting fresh data releases by the USDA. I covered the lack of volatility and volume in late last week (see here) and on the reaction to USDA releases (see here). The release of new data after such a long hiatus could lead to increased levels of volatility, if there are any major surprises that private forecasters had not expected.

The big news to watch over the next week will be whether Trump and Xi can reach a middle ground to reduce the tensions between the two giants of trade. There looks to be some thawing of the relationship as China has agreed to purchase 5mmt of Soybeans. If you have been paying attention to my updates over the past year that soybeans have been at the centre of the trade tariffs which have resulted in US soybeans falling (and Brazilian sources rising).

As the two nations commenced negotiations the market has been quietly confident of a amicable solution being found. This has seen the market start to gain ground (figure 2), as the market opens with news of a 5mmt will we see a sharp upward trajectory?

What does it mean/next week?:
We could be in for a wild ride over the next week as the market reacts to the release of USDA data and US-China trade negotiations.

It’s so hot that the trees are whistling for the dogs

The markets have been quite quiet in recent days. In this weeks comment we are looking overseas at bearish wheat planting numbers, and the impact of heat on electricity demand.

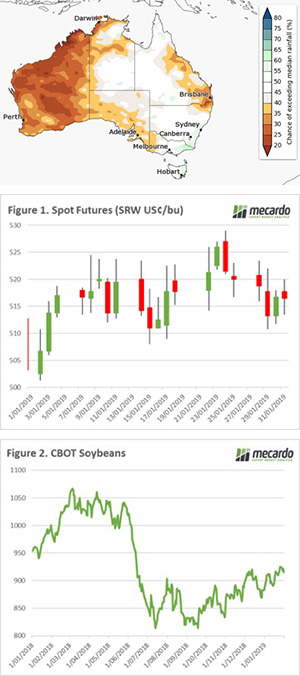
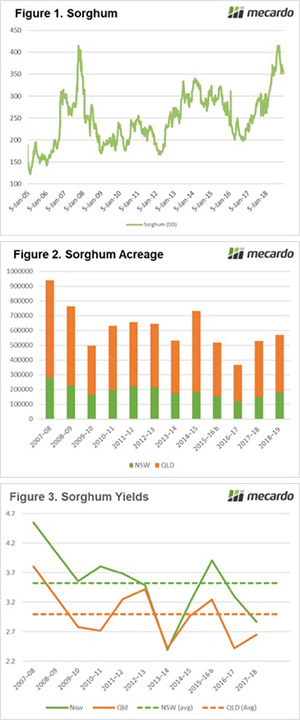
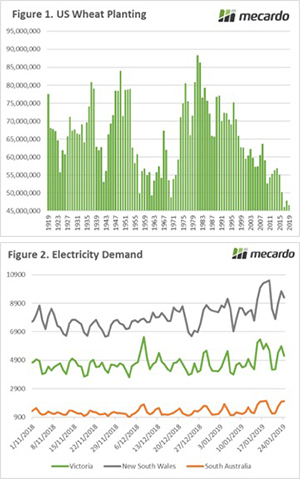
In lieu of data from the USDA, private forecasts become more important. Farm Futures in the US have conducted a survey of producers in order to gain an insight into planting expectations. It is anticipated that corn will rise by 1.3% year on year. There will however be major downward revisions to tariff impacted soybeans and sorghum with a substantial 5.5% and 12.1% reduction.

Wheat continues to lose popularity in the US, with planting levels for all wheat (spring, winter & durum) are at 46.6 million acres. This is the second lowest level in the past century (figure 1), the lowest being two years ago in 2017. Although technology has meant that yields are drastically improved from the past, this does place the US in a poor position if the weather turns poor in the growing season.

Yesterday South Australia sweltered through record temperatures, and Victoria is going to be hit with hot temperatures (and some strong winds in places). As temperatures increase demand (figure 2) on power infrastructure increases due to the number of people (myself included) sitting in air-conditioned rooms.

The weather is also starting to impact heavily upon the sorghum crop. The beneficial rainfall in December in NNSW and QLD has been followed up with dry weather, which has diminished the potential of the summer sorghum crop.

It’s important to be aware of the risk of heat stress in these hot days, so ensure that you remain fully hydrated – and slip, slap, slop.

What does it mean/next week?:

The reduction in acreage in the US starts to point toward a market balancing further and further towards a bullish sentiment. It will only take a production issue in North America or the black sea region to see a strong upward movement.

My shutdowns are the greatest shutdowns.

The market trades based on information. The largest source of publicly available information is currently on a record-breaking holiday thanks to the US government shutdown. What impact does this have?


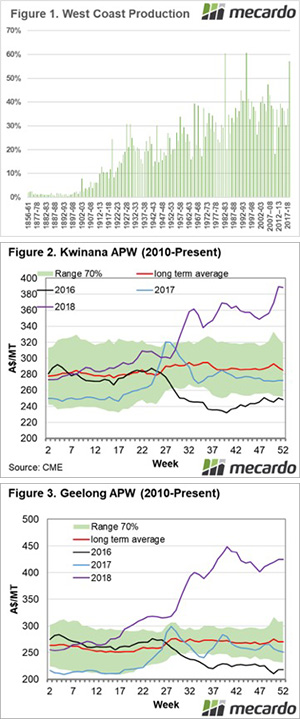
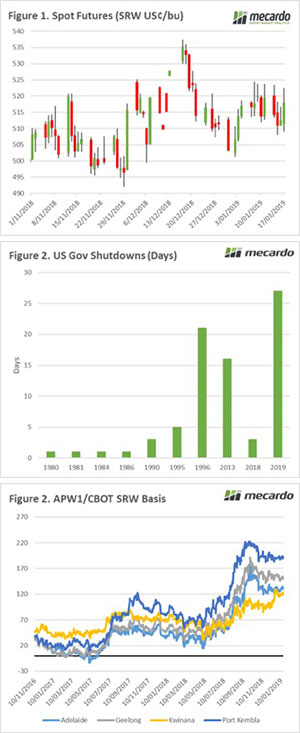
January is typically a quiet month for overseas markets. This month has been no exception to the rule. Chicago wheat futures are unchanged week on week in both US$ and A$ terms (Figure 1). The US will receive snow cover during the weekend, which will benefit the development of the crop. It provides protection against forecast cold snaps.

According to Trump, he is the best at a number of tasks. His ability is generally self-assessed; however, he is currently the record holder for presiding over the longest government shutdown in US history at 27 days.  The president is currently unable to get his budget approved due to his insistence on US$8bn to build a wall between Mexico and the US.

The shutdown has resulted in 100’s of thousands of government employees being furloughed. The biggest impact to agriculture at present is that the USDA is no longer releasing any new data including export, production and the WASDE report. Although there are many private forecasts available, the USDA data is usually a starting point for the trade.

The longer a shutdown continues the bigger the impact on the US economy. The US government estimates that quarterly growth will reduce by 0.13% per week. This is due to the impact of government workers having less income to spend/invest. The slow down in growth will likely slow down the pace of any US interest rate rises, which are now not expected until Q3 at the earliest.

At a local level, the Australian crop is largely complete. The only area continuing to harvest is Tasmania, which has experienced a fantastic growing season with conditions almost perfect. This has necessitated the construction of additional storage (see here) by Tasmania’s main storage and handling company.

This season has seen very little harvest pressure, as demand on the east coast has stripped supply. The basis levels have largely remained flat since the start of harvest (Figure 3), with the exception of WA. These basis levels remain at post-deregulation record levels and are liable to remain strong through until at least the middle of the year.

What does it mean/next week?:

As the government shutdown continues, there will be less and less current data available for the trade. However, most of the market uses USDA data alongside privately held data. At present, there seems to be no end in sight to the shutdown, with Trump holding his ground.

The real driver in coming weeks will be whether Russia can maintain its export pace and weather conditions in the northern hemisphere.

Cash in your grain and still retain exposure to the market.

There will be many of our readers who use swaps as an instrument in their grain marketing toolbox. The swap is a simple tool to use, and in general, is used pre-harvest but are there opportunities to turn the swap on its head and use post-harvest?

The traditional method of utilizing a swap is to sell a swap prior to harvest in order to lock in a futures price, then unwind the swap by buying it back from the bank at or near harvest. The main point of using swaps as a marketing tool is to create a hedge to protect against downside in physical prices, not as a speculative tool. At its most basic, if physical market rallies you will lose on the swap and gain on the physical and vice versa (Figure 1).

A detailed explanation of swaps and a video on how to use them is available on the below link:

Grain Swaps – farmers’ friend or hazard to be avoided?

The above explanation briefly outlines the traditional use of swaps, with the grower as the seller in advance of harvest. In our previous analysis article ‘3 elements you must consider when pricing grain’, we have explained the importance of thinking of your grain price as three distinct components. It is important to always keep in mind basis and futures.

During a year with low harvest prices, many growers will elect to hold onto grain with the hope of prices increasing in the post-harvest period. The holding of grain has a cost attached (interest lost, storage costs), and alternatives, where you can cash your grain and still have exposure to the market, are an attractive proposition.

With a number of banks, it is possible to turn it around and instead of selling a wheat swap, buy a wheat swap. Let’s say for instance the current basis levels were high (currently the case) and futures were low. It would be possible to sell your physical grain and lock in the basis, at the same time as buying a wheat swap.

The buying of the swap would give exposure to the futures market. Therefore, if the futures market rallied, you would participate in any upside. In an ideal world, you would then close out your swap position when you had reached your target price, and with the addition of the basis already captured, would be your overall price.

It has to be noted that there is also the potential for downside risk, and for many, it may be more beneficial to use a cash and call strategy which has a known ‘worst case scenario’.

The use of derivatives as an alternative to holding onto grain either on farm or in the system storage has a number of advantages:

  • You are able to gain cash flow from the physical sale of your grain.
  • You no longer have to pay storage costs
  • If the basis levels are attractive they are locked in, leaving no exposure to falls.

 What does it mean?:

It is important to understand a number of different ways of marketing your grain, as the tools available will work better in different marketing environments.

The opportunity for growers to buy a swap is best utilized when basis levels are high and upside is limited. This provides exposure to the futures market through the northern hemisphere growing period.

Cattle + Sheep – January 2019

Cattle

In this series of blog articles, we’re taking a look back at the year that was for agricultural commodities and provide our insight for the year ahead. This instalment highlights 2018’s key movements in the cattle market and what to keep your eye on in 2019.

The 2018 season saw tough trading conditions for cattle farmers with a drier than average rainfall pattern impacting across the entire continent from April to September, which saw restocker activity curtailed and prices for store/young cattle ease.

The climate impact put a halt to the herd rebuild with the female slaughter ratio climbing rapidly during the first quarter of 2018 as the dry conditions 
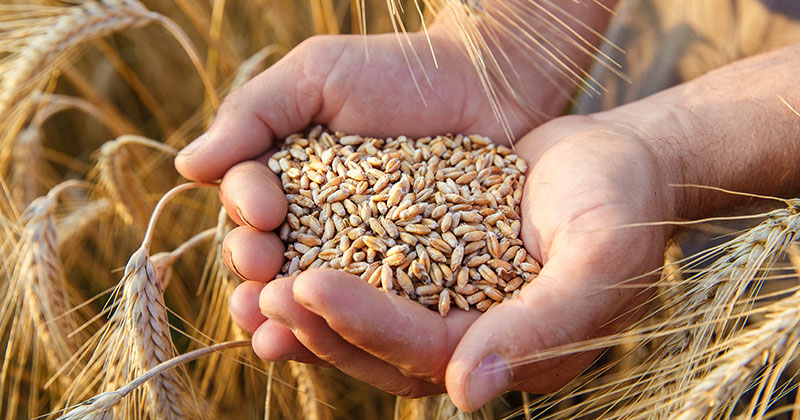
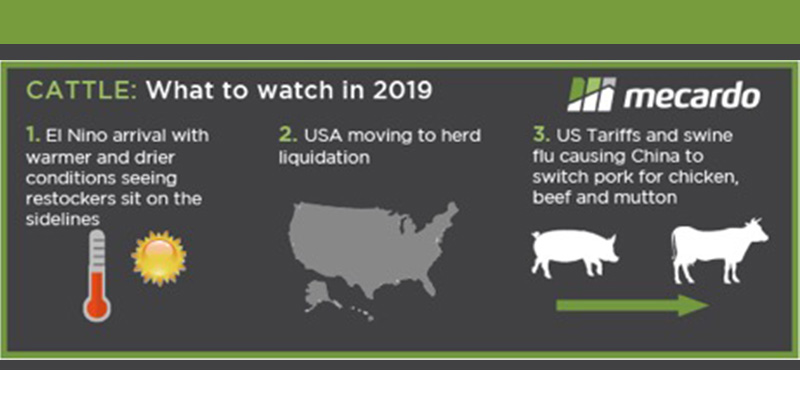
intensified. Since April 2018 the female slaughter ratio extended beyond levels experienced during the last significant reduction in the cattle herd, during the 2014/15 drought, and with an annual average female slaughter ratio for 2018 above 50% demonstrates that the herd liquidation remains well entrenched.

The 2018 drought saw feed grain prices surge placing pressure on feedlot margins. However, falling feeder values and firm finished grainfed cattle prices allowed enough margin to encourage an increase in cattle on feed to record levels beyond 1.1 million head.

What to keep an eye on in 2019

  1. Climate

Global forecast models continue to suggest an El Nino is likely early in the 2019 season with warmer and drier conditions to persist for much of the country. A late start to the northern monsoon season appears likely which will continue to limit northern producer’s appetite to restock.

If the 2019 season brings another failed autumn break to the south restockers here will remain on the sidelines and will continue to pressure young/store cattle prices. However, a return to more favourable conditions will see restockers encouraged back into the market with a vengeance.

  1. USA moving to herd liquidation

The USA is our main beef competitor into the key Asian markets of Japan and South Korea, and it is also a key export destination for Australian beef, holding the second spot in annual beef export trade volumes behind Japan, so what happens in the USA can influence our cattle markets.

The USA is on the verge of entering a liquidation phase for their cattle herd during the 2019 season, which will mean additional supply will flow into the global market. Demand for beef from Asia remains strong and should be able to soak up some of the increased US production if they move into destocking phase. However, any hiccup in Asian demand could see global beef prices come under pressure and flow through to Australian markets.

  1. China

The swine flu epidemic in China will impact upon their local pork production and Chinese consumers will have to source pork elsewhere. Ongoing trade tensions between the USA and China and tariff increases during the 2018 season will mean that the US pork industry may not be a viable solution to satisfy the gap in Chinese pork supply. This could see demand for meat protein in China transition toward increased consumption of chicken, beef and mutton during the 2019 season. An increased appetite for beef from China will be a positive for Australian beef producers.

Nevertheless, concern remains regarding a looming debt crisis within China. A financial shock in the form of debt induced drop in economic growth could see Chinese wealth and consumption levels take a hit, including the consumption of beef. The contagion of a Chinese debt crisis into Asian neighbouring countries and potentially spreading to the rest of the world could set off a second global financial crisis which would have disastrous consequences for Australia, beyond the beef industry. In terms of boxed beef product China takes around 10% of our export volumes. However, Australia is heavily tied to China across a range of export commodities and they are our top trading partner, so we need to keep a close eye on developments in China during the 2019 season.

Sheep

Dry conditions during the 2018 season saw the sheep offtake ratio climb back above the 12% thresh-hold during the middle of the year. The sheep offtake ratio measures the level of sheep turnoff into meatworks or live export as a proportion of the total flock expressed as a rolling 12- month average. Historically, when the sheep offtake ratio lifts above 12% the flock numbers begin to decline. 2016 was a wet year and this allowed the offtake ratio to fall below 8% in mid-2017. Since then, seasonal conditions have been generally dry, so the sheep offtake has risen. Since July 2018 this rolling measure of offtake has been indicating downward pressure on the sheep flock by rising above 12%.

Despite the reduction in the flock and higher slaughter levels due to the dry conditions sheep and lamb prices along the East coast have managed to maintain historically high levels during the 2018 season due to robust offshore demand, particularly for mutton out of the USA and China. Indeed, from June to December 2018, average monthly exports of Australian mutton to the USA have been 88% above the five-year average level and flows to China have been 70% higher.

What to keep an eye on in 2019

  1. Move to ban live sheep exports

During 2018 live sheep exports came under the microscope and flows ground to a halt during the northern hemisphere summer. The impact of reduced volumes of live sheep exported saw lamb and sheep prices in Western Australia stagnate, failing to follow East coast prices higher and limiting WA sheep producer’s revenues. A third of WA sheep turnoff goes to live export each year so the live trade is a crucial component of the WA sheep and lamb market, helping to underpin prices in the west.

It is an election year in 2019 and the Australian Labour Party, along with several cross-bench senators, have indicated a preference to phase out live sheep exports. If those seeking to ban live sheep exports are successful it is likely just a matter of time before their target will shift toward other aspect of agriculture that they find distasteful. What will be their next target if they achieve success in banning live sheep exports? Banning intensive animal farming practices in the beef feedlot, pork, chicken and egg industries, banning long haul animal transport over land and/or any shipments of live animals overseas – including the sizeable live cattle trade? It’s a slippery slope and may extend to the use of glyphosate and GMO technology in cropping/horticulture or the practice of mulesing in the wool industry.

  1. Reduction in NZ supply

Across the ditch the switch from sheep to cattle continues with Beef and Lamb NZ forecasting further growth in the beef herd at the expense of the sheep/lamb flock during the 2018 season and this is a pattern that isn’t expected to change as we head into 2019. The net result of the contraction in breeding ewes and lambs born will push the total sheep flock in NZ to a new low of 27.3 million head, or a decline of 0.8%.

In global export terms Australia and NZ supply around 70% of the market and in many of Australia’s key international markets NZ is our only real competitor. With NZ supply forecast to continue to decline the demand from offshore will need to find a source country to secure product and Australia is the obvious solution.

  1. Growth in demand from developing world

OECD forecasts for the next five years suggest that demand for sheep meat from Asia is set to average a 2% growth rate, annually. While this doesn’t sound like much the trade into Asia was more than US$2.1 billion last season and 60% of global sheep/lamb exports are destined to head to Asian markets, so it represents a significant chunk.

Asian demand for Australian sheep meat has supported the robust prices sheep producers have enjoyed during the 2018 season and with the NZ sheep industry shrinking there is a fair chance we will see growing Asian demand continue to support the Australian sheep/lamb sector as we progress through 2019.

2019 Outlook

In this series of blog articles, we’re taking a look back at the year that was for agricultural commodities and provide our insight for the year ahead. This instalment highlights 2018’s key movements in grain markets and what to keep your eye on in 2019.

The east coast of Australia has been ravaged by poor growing conditions in 2018. Although the drought has been widely publicised, farms have also been impacted by hail, storms and frost further exacerbating the already poor production potential.

The present forecast for wheat production in the eastern states (SA, VIC, NSW & QLD) is currently estimated at 7.2-7.5mmt. This is the lowest level since the 2006/07 crop and the third lowest in the past twenty years.

In the period since 2006/07, east coast domestic consumption of wheat has increased dramatically which intensified the impact as demand exceeds supply.

In contrast, Western Australia has taken the mantle of ‘production region of the year’. Although there were fears that frost would badly hamper Western Australia’s ability to produce a crop, however the fears were largely unjustified with production estimated at 9.6-9.9mmt. This marks only the third time in history that the west has produced more than 50% of the nation’s wheat (figure 1).

The northern growing region in New South Wales and Queensland suffered through a lack of rainfall during the winter production period. However, during the last three months of the year received above respectable levels of rainfall.

The late rainfall was welcomed by summer croppers, leading to increased planting. This rainfall will provide some surety to the sorghum crop, as there should now be sufficient moisture to get the crop through to a close to average finish.

The last quarter of 2018 has seen global markets unchanged, with the average for the quarter down 7¢ per bushel and up A$1/mt. This is largely unsurprising as the last quarter of the year has few surprises to move markets drastically higher or lower. This is due to the majority of the worlds grain harvest being complete, providing an element of clarity.

At a local level the picture is very different, with local pricing diverting from the international market due to drought conditions. This has resulted in wheat pricing in eastern Australia rising to levels not seen since prior to deregulation.

Domestic demand in the eastern states has led to substantial increases in pricing levels; Geelong +A$57 & Port Kembla +A$45. There has been a flow-on effect to WA prices, as transshipments price competitively.

What to keep an eye on in 2019

1 Politics / Global Trade

2018 was a year where trade scuffles broke out between the US and China. This lead to a lot of uncertainty in the market. Initially, the US targeted Chinese imports, however, retaliation by China targeted US agricultural exports.

The biggest impact was felt in soybeans with US exports into China being extremely important for American farmers (and Trump’s support base). The tariffs leave many questions about the capability of China to continue with trade restrictions. Over the past ten years, China has on average imported 62% of the worlds export soybeans. This places a huge strain on China’s ability to find alternate sources, especially considering the US is providing 40% of the world’s exports.

To satisfy the demand into China without paying tariffs, close to 100% of the global trade in soybeans (ex USA) will have to go into China. This has huge have flow-on impacts into other soybean destinations, which will likely change origin to the USA.

US-China negotiations are currently underway and have the potential to colossally impact our economy. A positive outcome will see strong trade flows between China and the US, which will then carry through to the Australian economy due to our reliance on China as a trading partner.

If negotiations end poorly, it is highly likely that the Chinese economy will stall due to the importance of the US economy to their manufactured exports.

2 Weather

The first half of 2019 will see all eyes look to the skies above the northern hemisphere. This is the important period of time where the 2019/20 crop will be made. 2018 was the first year in the past five where production fell below consumption. The world was assisted by strong stocks globally, however, the situation will be tighter this year with the majority of stocks held in China.

China as a nation is a large producer and have huge stockpiles in their inventory, yet it very rarely sees the light of day in the export market. The average exports from China since the turn of the decade have been 917kmt. The largest year of exports since 1960 was in 2007/08 with 2.8mmt. The high domestic price in China (Gov intervention) and historical precedence would point to China being unlikely to come to the aid of the global trade.

When we exclude Chinese stocks from the global situation, the world is sitting on similar levels of stocks to 2008/09 and 2012/13. These were both periods when futures prices rose dramatically and importing countries were hit especially hard with food prices rising, especially in 2008.

This means that major production issues in Europe, the Black Sea or the US could lead to a drastic upward movement in pricing at a global level.

3 Local Conditions

Prices in Australia have risen dramatically due to strong domestic basis. Pricing levels are the highest since the start of the deregulated market. We can see in figure 2 & 3, that these prices are ‘abnormal’ compared to the past ten years.

It is important to understand that these prices are not the ‘new, new’. If we have an average or above year in 2019, the premiums currently in the market will erode very quickly. The market will move back to a pricing point based on the export market and will align with international values.

At present no-one knows how the weather will treat us in the next year. If anyone tells you that they do; they are guessing. It therefore makes sense to investigate the forward market either through physical or futures to commence a structured sales plan for 2019/20.

However, if Australia experiences another drought we will see basis remain at strong levels.

Surety in sorghum?

When it rains, it pours. It’s been a dry year, and to end the month the east coast has received a deluge, with many areas receiving more rainfall over the past week, than they had received for the entire year. What does this mean for sorghum?


The rainfall in Queensland and Northern New South Wales was welcomed by summer croppers, with reports of 100-300mm. This rainfall will provide surety to the sorghum crop, as there should now be sufficient moisture to get the crop through to harvest.

The Sorghum price has been very strong in recent months due to a combination of drought and record numbers of cattle on feed. The peak of the year was reached in September, however has fallen 15% since this time (Figure 1). This peak was at similar levels to the previous record held in the drought year of 2007/08. Nonetheless, even with the sharp fall in pricing levels, Sorghum is still priced well above average.

The question now remains, what size will this crop be? The crop production is made up of two factors; acreage & yield.

The December ABARES report forecast the total sorghum crop acreage at 570kmt, shy of the decade average of 615kmt (Figure 2). However, these forecasts were produced before the December rains, and there is still ample time for producers to seed recently moistened paddocks. I would expect acreage to increase in following updates to levels above average.

The bumper sorghum crop in 2007/08 was due to a combination of both yield (figure 3) and acreage. This resulted in a sorghum crop of 3.7mmt. At present we would like to consider that yields will be at or above average for the coming crop due to the recent deluge. This would place the crop at approximately 1.8mmt, based on the ABARES most recent acreage forecasts. However, with acreage likely to be increased above their forecasts, a 2mmt (or above) production year is not unfeasible.

What does it mean/next week?:

The ABARES forecasts are likely to be ratcheted up as both yield and acreage projections are revised.

The bigger the sorghum crop becomes, the larger the impact will be on pricing of both Sorghum and other feed crops. This will be a relief for grain consumers up and down the east coast as the flow on effect reduces input prices.

However, with record cattle on feed and a poor northern winter crop the pricing scenarios are still expected to attractive for producers.

As always it is a good idea to consider selling in small chunks, especially as production becomes more assured. This will help average up pricing if the market does fall.

Key Points

  • The recent rainfall in NNSW and QLD will provide an element of surety to the sorghum crop.
  • The sorghum market has fallen 15% since its peak in September, however remains at historically attractive levels (for producers).
  • The acreage & yield for sorghum will increase due to positive moisture levels.

Why does it always rain on me?

The sound of rain can be heard on roofs throughout the east coast. This will be welcome to some and a hindrance to others. In this update we take a look at futures for next year, and the last two days deluge.


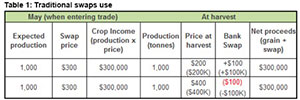
It is always important to look towards the horizon when creating a strategy for grain marketing. This is especially true this year, as producers in Australia are all likely to receive a historically high price due to the local drought conditions. There isn’t much strategy really required in a year like this.

We don’t however know what the outcome will be for next year, will we have a big or small crop? Therefore, it is important to start considering forward sales.  Since the start of the month the December 2019 CBOT wheat contract has increased by 4%, from A$275/mt to A$287/mt (Figure 1). As we move forward into the northern hemisphere risk market, opportunities may present themselves.

Locally the east coast of Australia has received a deluge of rainfall with reports of over 200mm in 24 hours. Technically that will leave many with above average rainfall for the season. Unfortunately, it didn’t arrive at the right time for many.

The rainfall will cause more delays to harvesting, and likely downgrading to quality in Victoria. On a positive note, it will provide some subsoil moisture for next season and place a floor in sorghum production.

The delay in harvest may provide a lift in prices between now and Christmas for prompt delivery, as consumers attempt to gain access to feed.

What does it mean/next week?

There is a meeting in Russia next week to discuss the wheat export pace. The inevitable rumors of an export ban are back to the fore.

It is unlikely that an export ban will be put in place, a more likely result would be some form of curbs. However either action would result in a move back to US exports becoming competitive.

A crude harvest present

Those who are lucky enough to be still harvesting are receiving an early Christmas present in the form of a reduced fuel bill. Diesel is one of the biggest costs on farm, so it’s worthwhile looking at this downward move.


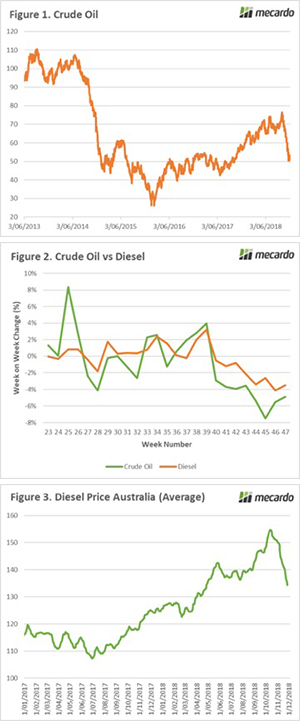
In mid-September, I covered fuel in the sarcastically titled ‘The great fuel robbery of 2018’. During this time fuel prices in Australia had risen dramatically to the highest since 2014. This led to calls to boycott the fuel companies. My view, in this case, was that boycotting the fuel companies was an ineffective action as the price of fuel is based on factors largely out with the fuel stations control. It is a function of commodity pricing.

In early October crude oil futures reached a four-year peak (Figure 1). The market has fallen dramatically since then. Diesel is a derivative of crude oil therefore when crude falls, in theory so should diesel (and vice versa).

To show this, I examined the weekly change in price between crude oil and diesel over the past six months. In figure 2 the movement in price (as a %) is displayed, clearly showing a strong relationship. This chart uses a lag of one week, which signifies that there is a delay between the value in crude moving and diesel prices.

The correlation between the two commodities is displayed below, with 1 being a perfect correlation and 0 being no correlation.

  • 0 lag : 0.33
  • 1 week lag :78
  • 2 week lag :66
  • 3 week lag :41

The result of this downward movement in crude has been that diesel prices in Australia have started to reflect the fall (Figure 3). This means that any purchases at present should be considerably cheaper than pre-harvest which will be welcome to all.

What does it mean/next week?:

November was the weakest month for crude oil futures during the past decade. This is due to supply outstripping demand, with US stockpiles at record highs in recent months.

Prices are likely to stay weak until we see either an improvement in global economic growth or production curbs enacted by OPEC.

Key Points

  • Diesel is a derivative of crude oil.
  • There is a strong correlation for a 1 week lag in changes in crude oil being reflected in diesel prices in Australia.
  • In November, crude oil had its worst month in ten years.