 It hasn’t happened to the Eastern Young Cattle Indicator (EYCI) yet, but we have a few slaughter categories which have moved below year ago levels. It’s been a while since producers were getting less money than the year before, in fact it’s been three years, but is anyone complaining?
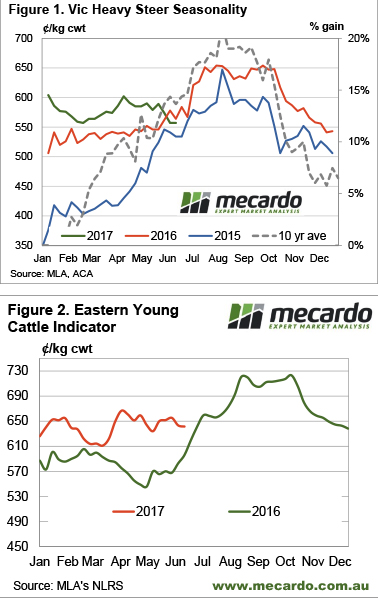
It’s been nearly two months of cattle prices tracking sideways, as just as the market seemed to avoid the usual autumn decline, the winter rally is taking it’s time to appear.
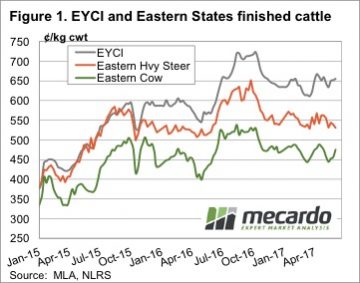
Figure 1 shows the Victorian Heavy Steer Indicator, which is a pretty good proxy for slaughter cattle on the east coast. Since 2015 there hasn’t been a week when the Vic Heavy Steer was lower than the previous year. In fact, we had to go back to February and March 2014 to find a time when the Vic heavy steer was lower than the year earlier. At that time the Indictor was at 310-320¢/kg cwt, just 5-10¢ below 2013 values. This week’s price was 557¢/kg cwt.
So is anyone complaining about prices? We can see from figure 1 that producers with heavy steer might be disappointed they didn’t sell a month ago, with the Vic Heavy Steer down 30¢ in that time. This equates to around $105/hd on a 350kg cwt steer, which hurts a bit.
In terms of the trade, if these steers were bought back 18 months ago, the EYCI was 600¢/kg cwt. Convert to live weight and add a bit of basis, and they might have cost around $1,000/hd at 300kg lwt. Selling this week as heavy steers they would have returned $1,950/hd. We’re not sure anyone is complaining about a $950/hd gross margin.
the week ahead
Seasonality suggests cattle prices are due to rally, and Matt’s analysis earlier this week on processor margins suggests there is room for slaughter cattle to begin their winter appreciation. Young cattle prices remain strong, as restocker and feeder demand is still robust enough (figure 2). We might see slaughter cattle rise without young cattle for a start. Although the very dry weather outlook for the next 8 days suggests we might be waiting a bit longer yet.
 A reduction in lamb yarding this week along the East coast was met with broadly softer saleyard prices suggesting that buyers took a bit of a spell. The Eastern States Trade Lamb Indicator off a fraction, down 4¢ (or 0.6% lower) to 666¢/kg cwt. National Mutton a little softer, with sheep throughput holding firm, to see a fall of 11¢ (a 2.1% decline) to close at 511¢.
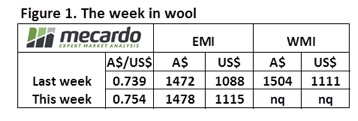
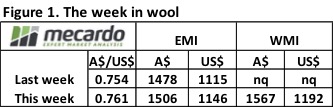 Increased demand this week from exporters noted as Chinese buyers resume their activity, undeterred in the face of a higher A$. The EMI creeping back above 1500¢, up 28¢ to 1506¢ and gaining 31US¢ to 1146US¢. The Western markets resumed auctions this week and activity participated in the rally, making up for lost time with a 63¢ rise to see the WMI at 1567¢, up 58¢ in US terms to 1192US¢.
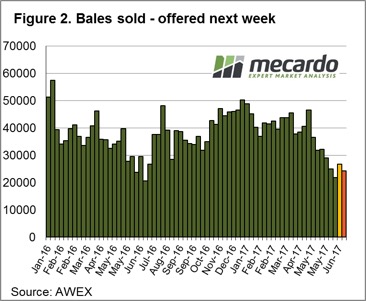 Interestingly, the medium fibres displaying a more robust price movement this time around with the 21 micron reaching levels in AUD terms not seen since the middle 1988. Indeed, in May 2016 when the 21-micron hit 1535¢ in the South the 17 mpg was trading above $23 and the 19 mpg was above $19.5. This week with 21 mpg at 1549¢ the 17-micron unable to climb above $22 and 19-micron can’t crack the $19 level.
 The week ahead
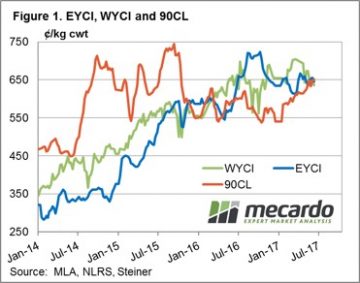 The Eastern Young Cattle Indicator (EYCI) just 1.8% softer to close at 643.25¢/kg cwt. It’s Western cousin a touch heavier with a 2.3% fall to 635¢, while the key beef export benchmark 90CL frozen cow managed a slight 0.9% gain to 652¢/kg CIF – figure 1.
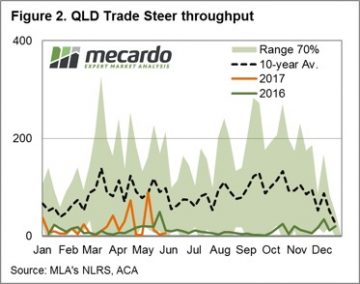 The sideways price action demonstrated by most cattle categories somewhat unsurprising given the broadly unchanged weekly slaughter and yardings numbers. East coast slaughter for the week ending 2nd June only 83 lower than the prior period and just shy of 136,000 head. East coast yarding posting a 1.8% gain on the week to see 54,940 head change hands – figure 3.
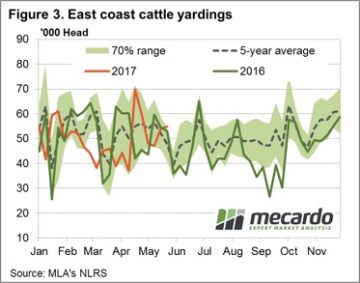
 Australian Wool Innovation has stated it will progress with its Wool Exchange Portal (WEP) beyond the scoping stage and is now moving to the “discovery stage” where the portal is built. Expected industry benefits are $38 million over the first 15 years. In this article Mecardo puts this expected benefit into perspective.
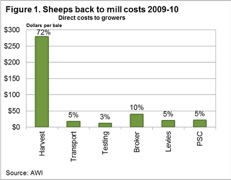
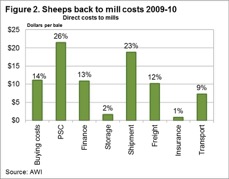 Costs incurred by growers after the wool has been delivered to store (excluding shearing and delivery to store costs) were $72 per farm bale in 2009-10. Figure 2 shows a breakup of the costs associated with purchasing wool (direct costs to mill) in Australia which totalled $75 per farm bale in 2009-10. In total it cost $175 per farm bale to sell wool in 2009-10, through a system with no counterparty risk.
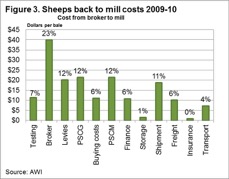 In Australia in 2017, around 1.5 to 1.6 million farm bales will be sold annually through the auction system. In May the average gross value per bale was $1670. For the past three years the average gross value per bale sold has been $1411.
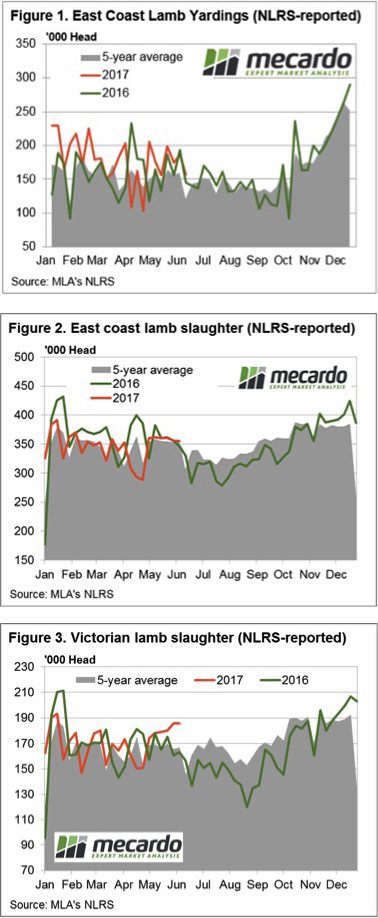
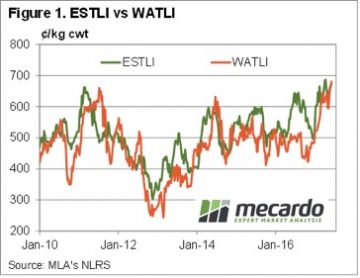 WA doesn’t have the most expensive lambs in the country, but with the Western Australian Trade Lamb Indicator (WATLI) hit a new record this week. The WATLI gained 17¢, to hit 681¢/kg cwt (figure 1), stronger than the ESTLI (670¢) but weaker than Victorian Trade Lambs, which sit at 695¢/kg cwt.
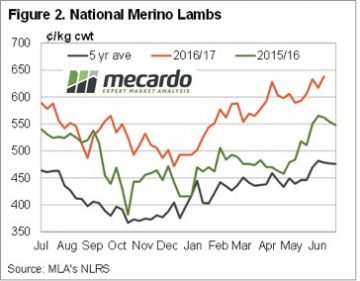 It’s interesting to see lamb slaughter remaining relatively steady over the last five weeks (figure 3), at levels similar to last year. As we said a couple of weeks ago, the same supply, and prices 12% higher, suggest demand has strengthened.
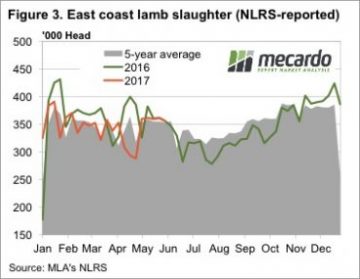
 Normal market drivers and influences were turned on their head this week. On Wednesday, the A$ fell and so did the market, while on Thursday the market rallied with the A$ ending the week up by almost US$0.015 cents.
 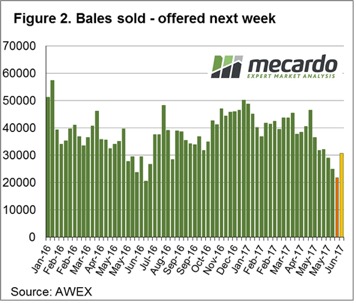 To compare with the same period last year, wool sales; more specifically “clearance to the trade”, are on average 4,000 bales per week lower.
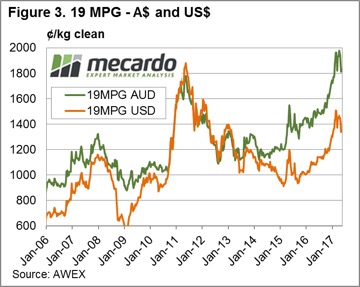 The opportunity for wool growers is to apply a strategic approach to sales; that is use the wool broker to identify types that are selling well as well as types that are over supplied or lacking demand; and then sell or hold back as your situation allows. The recent market activity shows that a weak market one week is quickly replaced by a rally. It is also a time to have any unsold wool listed on Wool Trade where buyers can access if required.
 In our grain article yesterday, we picked out a few bullish factors at play in the market. Our view is that based on current market factors that pricing is close to the floor. In this weekly comment, we look at current pricing and the situation in Spain.
 In the past week, we have also seen the Baltic Dry Index (BDI) fall below the 200-day moving average (Fig 3). The BDI is considered a leading economic indicator as the cargoes typically transported by bulk vessels are commodities requiring further processing (iron ore, coal, grains etc) to create an end product, thereby giving an insight into future economic performance. The poor economic data in China, and declining Iron Ore returns could place further pressure on the A$.
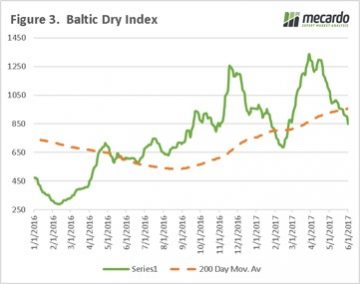
 The fundamental international market news was bullish this week, but markets seemed to focus more on local issues. Broader indicators managed hold their ground, or even rally a bit, but at the state level there were some heavy price declines.
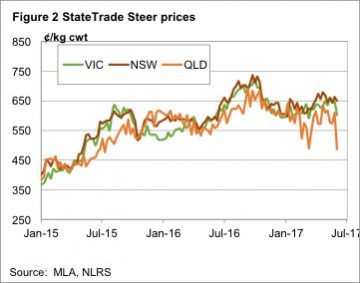 Restockers pushed the EYCI higher, as shown in figure 1, it gained 4¢ for the week to hit 655.25¢ a five week high. Cows also rallied, while heavy steers fell.
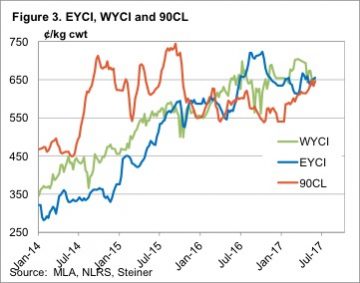 In WA the Western Young Cattle Indicator (WYCI) gained a couple of cents to sit at 650¢/kg cwt. Figure 3 shows an interesting convergence. The EYCI, WYCI and 90CL indicator all sitting between 645 and 655¢. The last time we saw this was in March 2016.
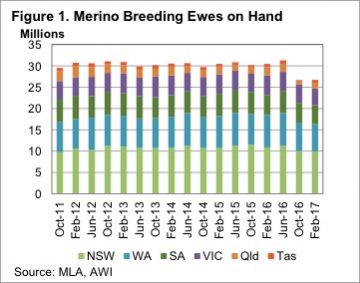 Living in Western Victoria, which is one of the hotspots for the swing to meat breeds, it’s hard to imagine that 69% of the ewe flock is made up of Merinos. Figure 1 in part explains this, with 61% of the nation’s Merinos being in NSW and WA. Just 15% of Australia’s Merino Ewes are now in Victoria.
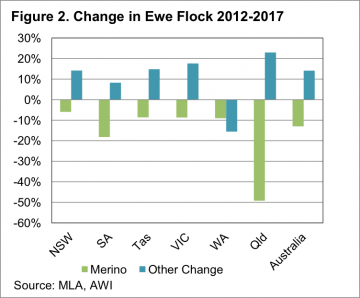 Figure 2 also shows every state except WA has increased their number of ‘other’ breeds since 2012. On a national scale, the decline in Merinos hasn’t been matched by increases in other ewes. However, in NSW and Victoria Merinos have been displaced by other ewes. In WA, SA and Queensland total sheep numbers have fallen.
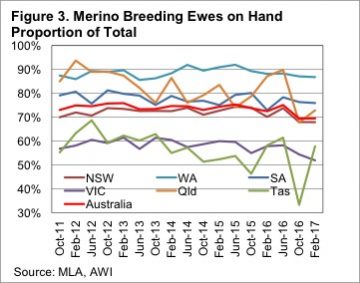 Perhaps it is due to climatic conditions, or it might be due to the fact that Merino’s are bigger and more suited to lamb production in WA, but the West remains a stronghold of the Merino. The proportion of Merino’s in the west hasn’t really changed over the last five years, fluctuating between 86 and 92% and currently sitting at 87%.