Tag: Analysis

Wheat gets a boost from the WASDE

Normally World Agricultural Supply and Demand (WASDE) reports released early in the year are relatively benign. The old crop is largely known, with only minor changes in exports to move the market. Not this month however, with wheat getting a boost thanks to some surprises.

Picture1
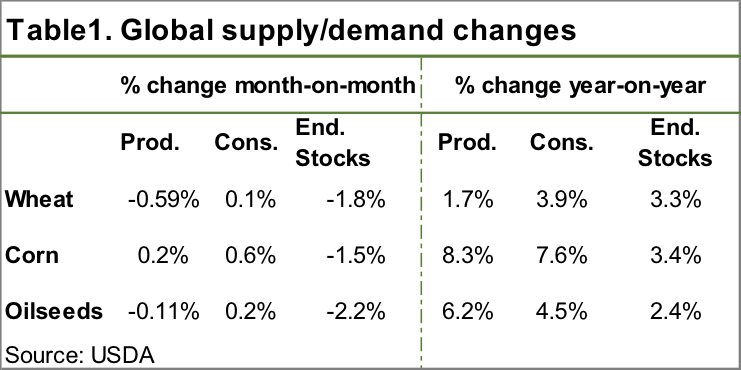
World wheat production was cut by 4.4mmt this month, largely thanks to a downgrade in India. The United States Department of Agriculture (USDA) are still saying 2016-17 will be the biggest crop on record. However, a small increase in consumption (Table 1) and a decrease in ending stocks saw the stocks to use ratio decline from 34.2% to 33.5%. Sounds small, but as shown in figure 2, the stock to use for 16/17 is now smaller than last year.

Picture2
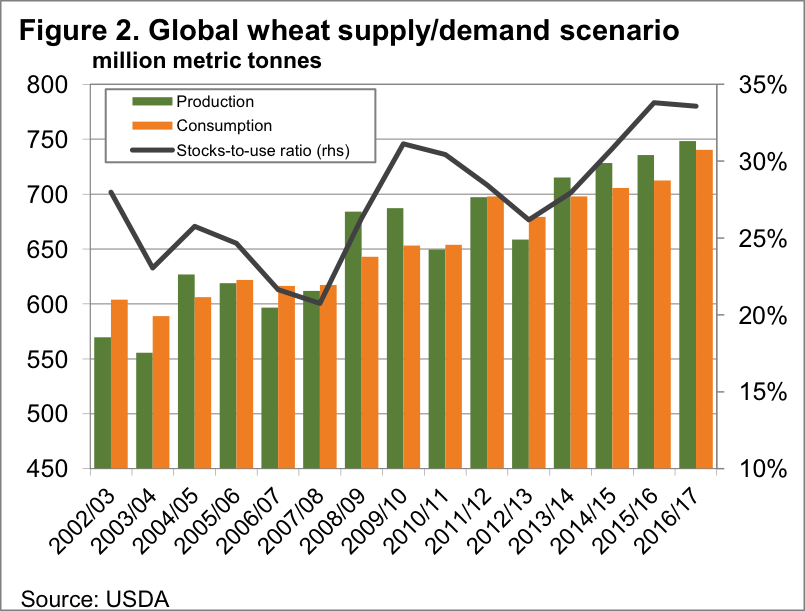
In theory, a smaller stocks to use ratio should mean higher prices than last year. This had funds jumping out of wheat last night, pushing the CBOT spot contract to a 7 month high of 442¢/bu (figure 3). Still a long way from the 500¢ of February 2016.

Picture3In our terms the stronger AUD sees prices just below the 7 month highs hit in January, with the spot contract at $213/t, up $5 for the week, and Dec-17 at $238/t, shown by the red line on figure 3. There is full carry into Dec-17, and those concerned about prices ticking along at current levels for another year might be tempted to sell a bit at these levels.
Soybeans took a bit of a hit on an upgrade in US stocks, but oilseeds in general were stronger. ICE Canola has moved back to its recent high of $CA527/t which in our terms is exactly the same, thanks to the currencies being at parity.

The week ahead
Old crop wheat has found a little bit of strength in the last week as a stronger CBOT, and buying for export shipments has added $5-10 to APW and ASW prices. The latest jump in CBOT might add another few dollars today.

The latest WASDE shows we are entering a traditionally volatile period for grain prices on international markets, and there might be opportunities to take some derivative cover for next year, or even on physical sales to be made later in 2017.

Increased northern throughput takes a toll

Picture1
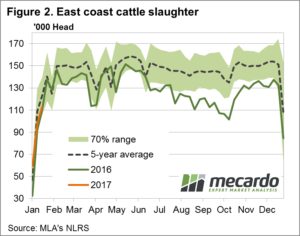
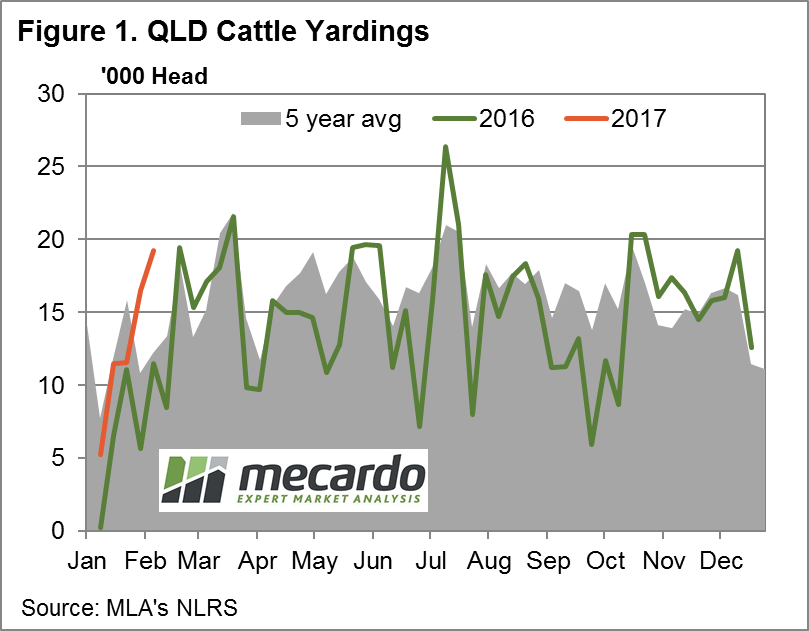
Surging weekly Queensland throughput and above average NSW throughput weighed on cattle prices in these regions dragging down the east coast figures this week with the Eastern Young Cattle Indicator (EYCI) dropping to levels not seen since the start of the season.

Figure 1 highlights the yarding pattern so far this year in Queensland with the large jump in throughput evident for this week compared to the 2016 trend and the five-year average pattern. The 19,246 head recorded a 57.8% increase on the average for this time of year. Queensland the only state to see price falls in all NLRS reported saleyard categories of cattle with QLD Feeder Steers leading the decline posting a 4% drop to 353¢/kg lwt.

Picture2
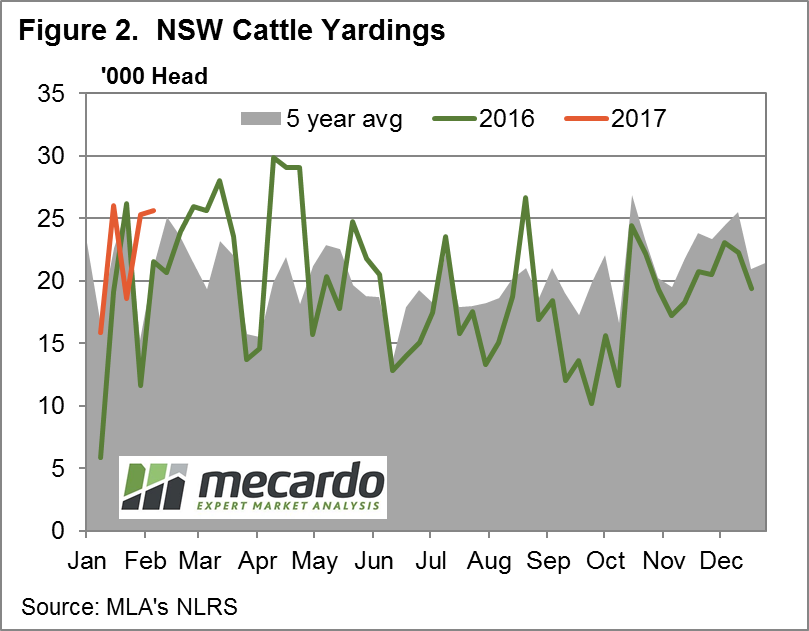
NSW experiencing price declines in all NLRS saleyard categories, apart from Medium and Heavy Steers, with Trade Steers headlining with the biggest percentage decrease, down 6% to 332¢/kg lwt with elevated NSW throughput appearing to contributing to the price pressure – figure 2.
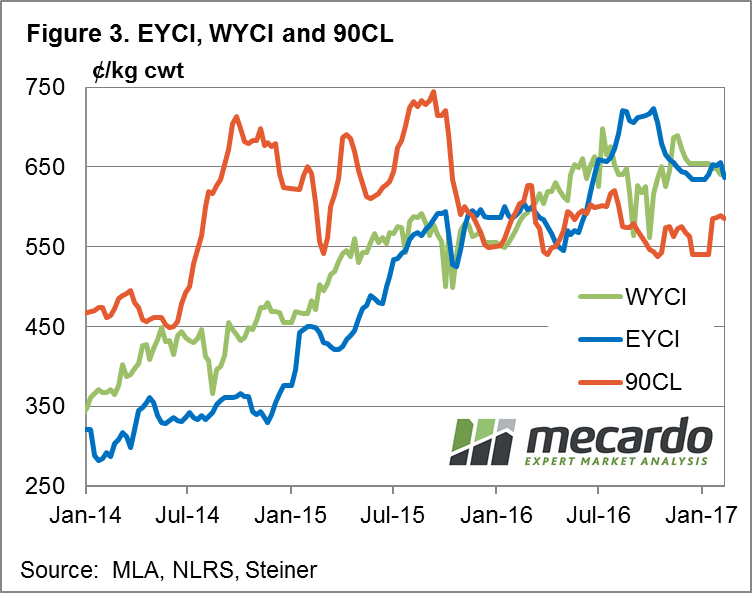
The EYCI dropping 3% on the week to close at 636.5¢/kg cwt despite beef export prices managing to hold onto the recent gains with the 90CL frozen cow tracking sideways to finish the session off at 585.5¢/kg CIF – figure 3. Softening US cattle futures creating some headwinds for the 90CL and providing a barrier to local cattle prices extending their gains achieved since the start of the season.

Picture3Register here for the MLA/Mecardo Cattle Market Webinar scheduled for the 16th February at 1pm AEST. Registered participants will be able to view a copy of the webinar at a time that suits them if unable to view it live.

The week ahead
While it is not uncommon to see weekly throughput in Queensland test toward the low 20,000 head vicinity during March/April the surge reported this week comes a little earlier than anticipated. Perhaps brought forward by the attractive price levels and the prospect of a drier than normal February – April period as forecast by the Bureau.
If you haven’t already done so, please consider signing up for the cattle market webinar we are running in conjunction with MLA on the 16th February – see link above for further details.

Global cattle in A$ terms

Key Points 

  • Diverging price trends between the US and Australia during much of 2016 saw the usual EYCI discount spread to US Feeder Steers move into extreme positive spread territory.
  • A lift in US cattle prices in the last quarter of 2016 saw the spread return to a discount.
  • Current US Feeder Steer prices at 122US¢/lb translates to around 351A¢/kg lwt while the EYCI is trading at around 342A¢/kg lwt

Picture1
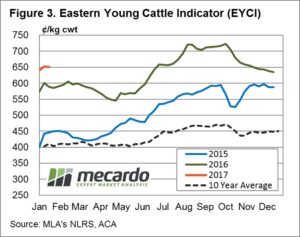
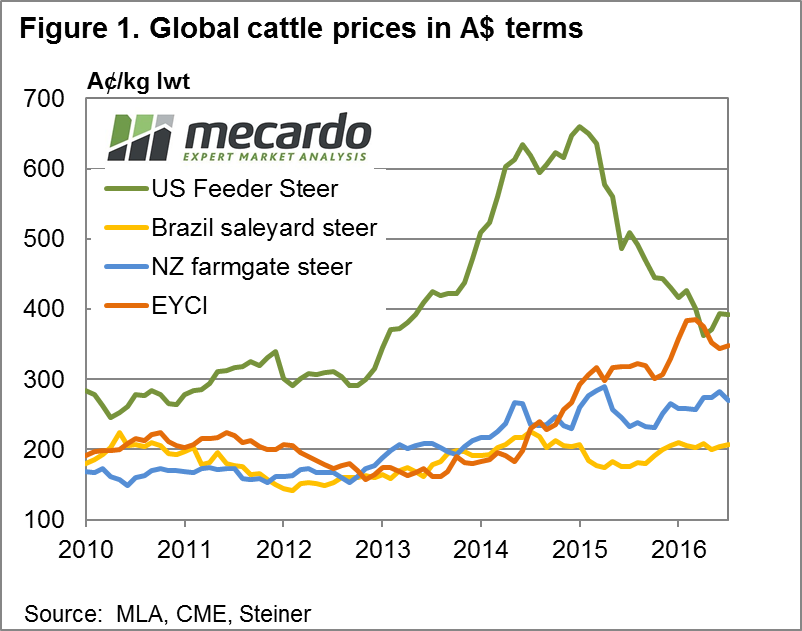
Often at Mecardo we look at local and global cattle price relationships in US$ terms as the US cattle market is one of the key drivers of Australian cattle prices over the longer term. However, in this analysis we flip the magnifying glass to take a look at global prices in our terms.

Figure 1 shows a handful of global cattle prices compared to the Eastern Young Cattle Indicator (EYCI) expressed in A$ terms on a live weight basis. Clearly, we can see for much of the period between 2010 to 2013 US Feeder Steers held a reasonable premium to comparable cattle prices in Brazil, NZ and Australia. However, during 2013 to 2015 the US market took off and the prices there doubled from 300¢ to over 600¢/kg lwt. During much of the 2013 to 2015 period prices in Australia remained subdued due the very high drought induced turnoff and Brazilian prices were kept under wraps due to a rapidly devaluing currency, while prices in NZ showed some modest gains.

Australian cattle prices started to rally into 2015 as seasonal conditions improved and for much of the 2015/16 seasons continued to probe higher as restocker demand buoyed the market and an optimistic outlook encouraged the beginning of a herd rebuild. In contrast, being further along the rebuild phase, US cattle prices began to ease during this time frame as production here increased.

The divergence between US and Australian prices can be seen by the sharp narrowing of the percentage discount spread between the EYCI and US Feeder cattle as highlighted in figure 2. Indeed, the spread narrowed so much that it went to positive territory for much of the 2016 season. Overlaid on the chart for figure 2 is the green band showing where the spread has fluctuated for 70% of the time, the 95% range as indicated by the two red dotted lines and the long-term average spread, which sits at a 43% discount of the EYCI to US Feeder Steers, when comparing priced expressed in A$ terms.

Picture2Taking a look at the correlation between US Feeder Steers and the EYCI we can see a moderately strong relationship between the two series when looking at annual average prices expressed in A$ terms – figure 3. Although, as previous Mecardo analysis has shown, the correlations between Australian and US prices are stronger when comparing annual average prices in US¢/kg.

Click on the links above and below to read past analysis on correlations between US and local prices in US$ terms.

EYCI and 90CL beef export price
US Live cattle futures and National Heavy Steers

What does this mean?
Picture3
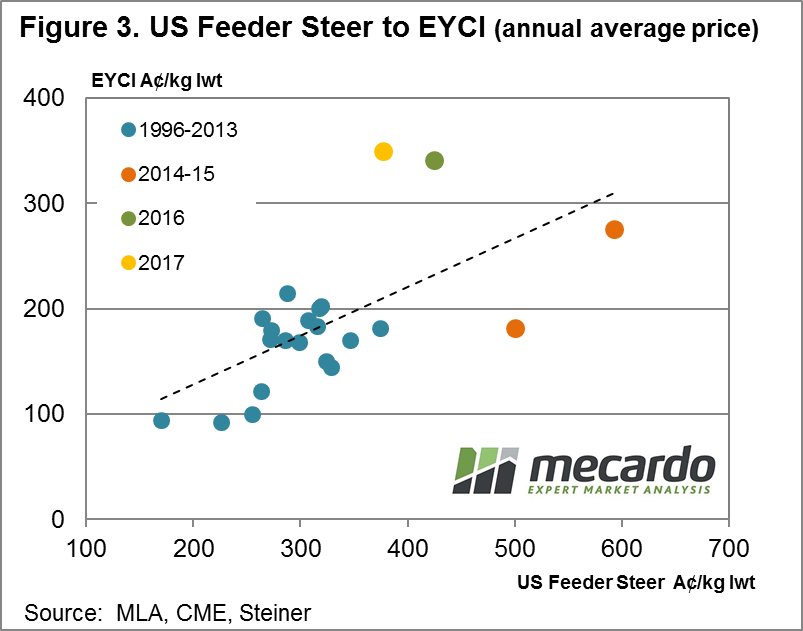
The lift in US prices since October has taken some of the downward pressure off local prices. Although from a longer term historical perspective local prices remain in overvalued territory and have not been helped by a stronger A$ during January.
A continuation of the downtrend in US prices or a significantly higher A$ (above 85US¢) would see some pressure return on local prices. However, on the flipside, tight local supply, a continuation of the herd rebuild and the remnants of a very favourable weather pattern during 2016 should be enough to see local cattle price remain buoyant for the first half of the year.

Simple economics – Lamb supply up price down

Picture1
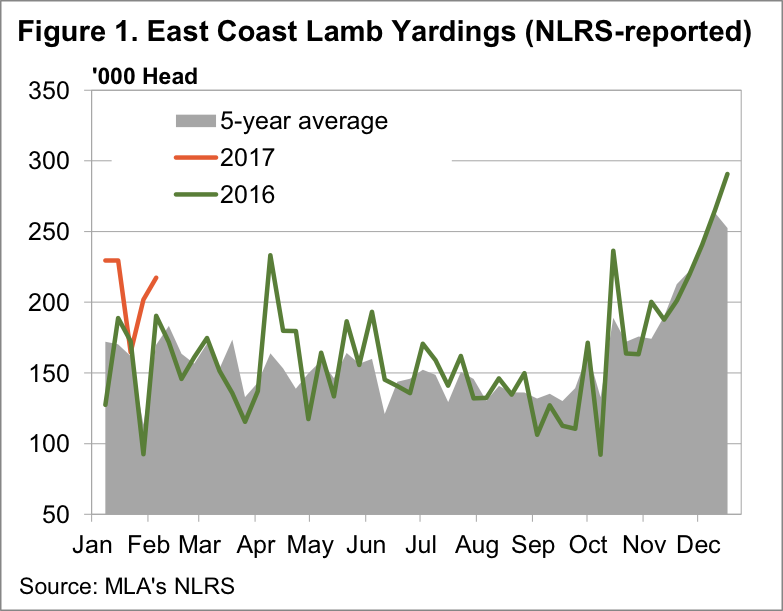
The very high prices seen last week had the desired effect for processors, drawing out very large lamb numbers, and sending prices lower. Sheep are a bit of a different story, especially in Victoria, where yardings waned, and as such prices have largely held their ground.

Figure 1 shows East Coast lamb yardings increased by 15,529 head this week or 7.6% to record their highest February weekly yarding in at least 11 years. No doubt the extra high prices of last week led producers to send anything which was ready to market.

The result of the influx of lambs was lamb prices not quite returning to the prices of a fortnight ago. The Eastern States Trade Lamb Indicator (ESTLI) fell 28¢ this week to sit at 618¢/kg cwt, still a very solid level. Picture2
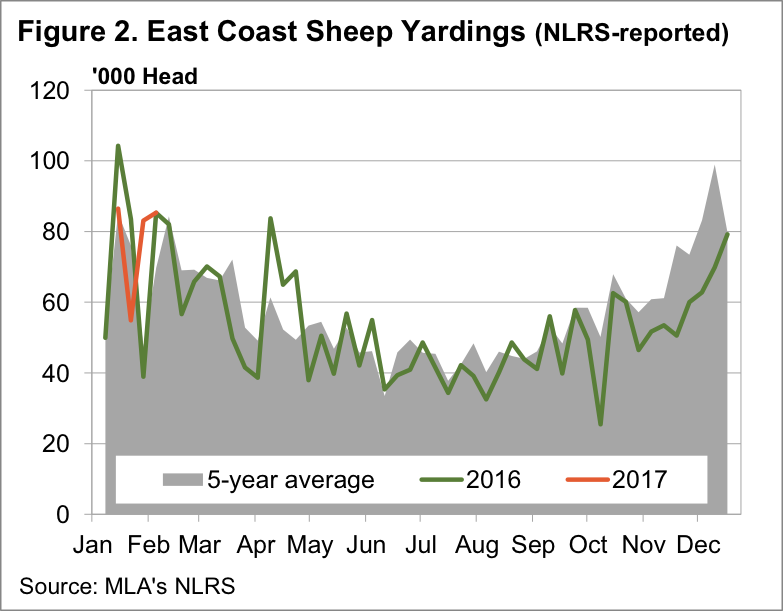
The fall was strongest in Victoria, where trade lambs lost 45¢, or 7%, and moved back into line with NSW and SA.
Mutton yardings only managed a marginal rally, increasing 4.8% to sit at almost exactly the same level as last year. Mutton prices reacted to an extent, falling less than 10¢ in NSW (404¢) and Victoria (444¢), but increasing 13¢ in SA to 402¢/kg cwt.

Picture3
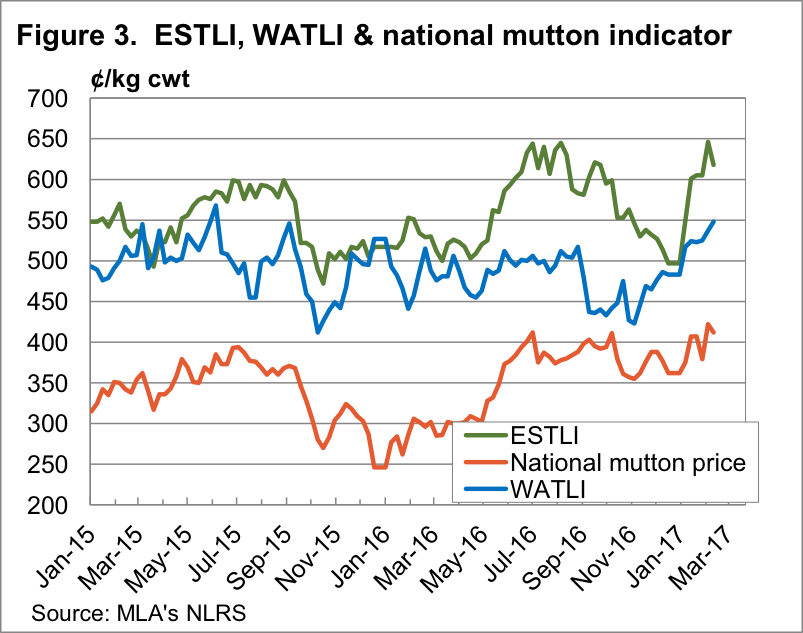
In WA lamb prices continued to play catch up to the east coast, with the WA Trade Lamb Indicator (WATLI) hitting a 19 month high of 548¢/kg cwt (figure 3).
Lamb yardings in the West were up by 62%, with rising prices an indication that export demand is possibly increasing. This improves the prospects for sustaining current strong prices over the coming months.

The week ahead
The south west of WA is set for some very strong rainfall in the coming week, which could see the continuation of rallying prices there. In the east the question is whether this week was the start of a run of lambs, or whether the strong prices pulled out all that is ready. If it is the former prices will continue to ease, if it’s the latter we might see another spike, or at least prices tracking sideways.

Fine microns lead the way

Picture1
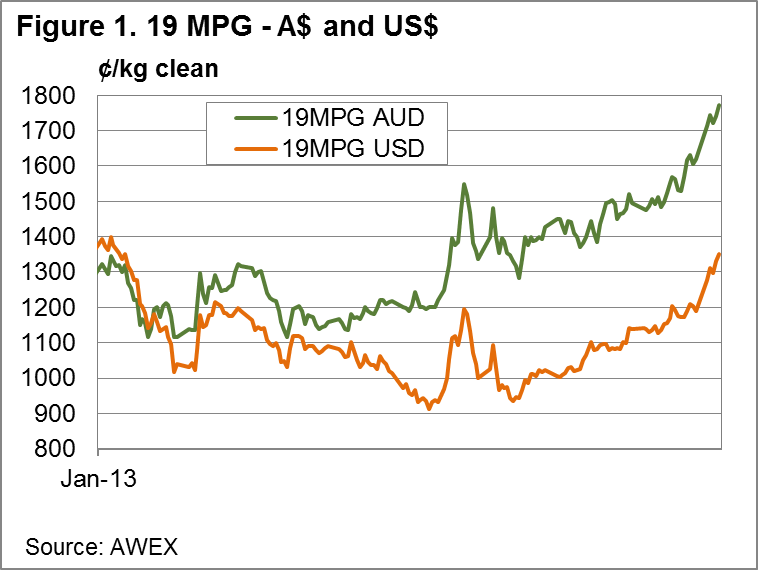
The good news for the wool market continued; again, it was the fine wool that was the stand-out and led the market. Sydney had a designated fine wool sale; this came at the perfect time for NSW fine wool growers resulting in the Merino fleece and skirtings component having an almost total clearance with only 1.6% Passed In, compared to the national PI rate of 6.7%. The EMI was up A$0.15, while in US$ terms it was 9 cents better.
The premium for fine wool continues to grow, in Melbourne 18 MPG is 500 cents over the 21 MPG, while the Sydney catalogue reported a 550-cent premium due to a generally sounder offering.

Picture2
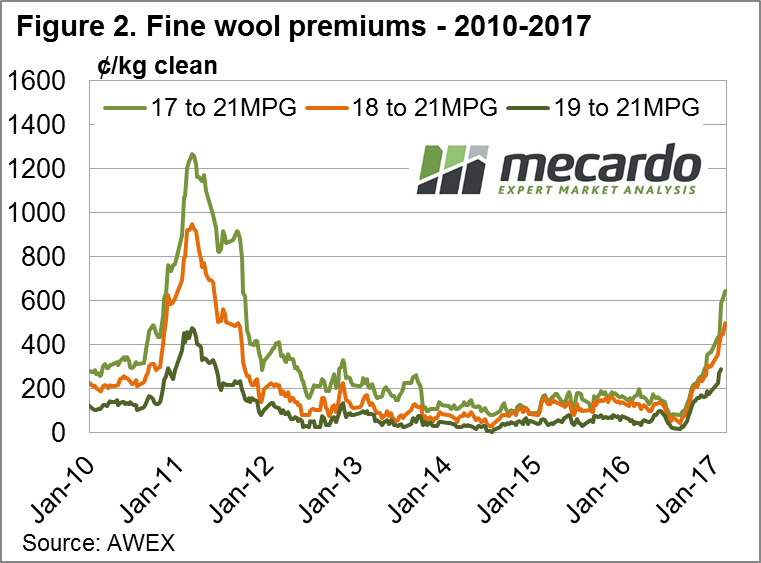
The last time 18MPG basis was at this level was July 2011 (Fig 2). Of further note is that in July 2016 (last year) it was quoted in Melbourne at 52 cents. Is that a 900% increase in less than 12 months?
Of the 44,400 bales offered, 41,500 were sold into a market where all but the coarse X Bred types improved on last week’s price levels.
were also good traded levels on Riemann concentrating on the 19 MPG contract with 1700 cents for the winter maturity and 1640 out to September. As one grower noted, “Sales above $2,000 per bale are now available out to December and we have sold plenty below this level in the past 5 years, so hedging a percentage of the next clip makes sense even if we think the market outlook is bullish!”.
This week Mecardo had a look at wool volumes, with the “Some up, some down” article reporting Auction data for merino combing wool showing a continued swing to the broader half of the merino distribution with 21 micron auction volumes up by 34% for the past three months.
Understanding what this observation means to the future for wool was helped when the subsequent article was published looking at how the main competitors to wool were placed regarding price.
The average merino micron price in US dollar terms continues to outperform the major apparel fibres. However, price forecasts for cotton and manmade fibres in 2017 point to their rolling five year ranks easing. It is easy enough to envisage finer micron merino prices continuing to outperform due to lower supply but broader merino categories will have increased supplies coming onto the market which will make continued outperformance difficult.

The week ahead
The combination of a stronger market both in US$ and A$ terms alongside lower Pass-In rates points to a growing demand from processors. This is also fuelled by the expectation of tighter supply for fine wool going forward; all this leads to a strong level of confidence for the near term.
Next week Melbourne is selling over three days with Fremantle and Sydney on Wednesday & Thursday. The strong market has enticed some additional volume to the market with 47,500 bales listed for next week, however forward projections for the following weeks trail off to 43,000 and 40,000.

Southern cattle should start to get (more) expensive

The last week in January, or the first week in February, is usually the time when southern cattle reach their annual price low-point, relative to northern markets and the Eastern Young Cattle Indicator (EYCI).  Recent price movFigure1
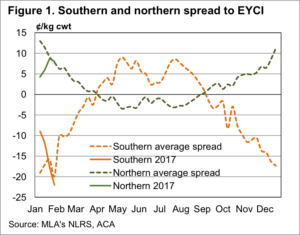
ements suggest this will again be the case, so what does this mean for pricing over the coming months.

Figure 1 shows that since early January we have seen a sharp correction in the relative prices of young cattle in EYCI saleyards south of Dubbo.  The discount for young cattle in the south has widened from 10¢ in early January, to just move past the 10 year average, and sit at 22¢.

Young cattle prices in yards south of Dubbo haven’t actually changed, but the EYCI has gained 15¢, driven by a 19¢ appreciation in yards north of Dubbo, hence those in the south have become relatively ‘cheap’.  This is despite absolute prices being at record levels of 633¢/kg cwt, for this time of year.

Figure2
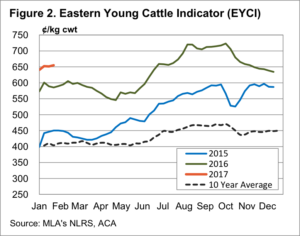
More interesting is what happens from there with the southern spread to the EYCI.  Over February, March and April, the southern discount becomes a premium, as the supply of grass finished cattle tightens, as grass supply wanes.

In the north the supply of finished cattle starts to improve in January, with the result being a weakening premium to the EYCI, bottoming out in May.

Figure 2 shows that the EYCI generally tracks sideways to slightly higher, in February and March.  With the southern discount to the EYCI narrowing, to a steady or higher EYCI, this suggests we might see 20-30¢/kg cwt upside in southern young cattle prices in the coming month or two.

Picture3
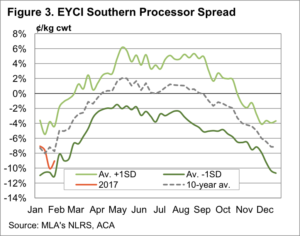
It young cattle destined for slaughter, or trade steers and heifers, which are set to benefit the most over the coming months.  Figure 3 shows that young cattle sold to processors improve 8% over the late summer and autumn.  From the current level of 595¢/kg cwt, a narrowing of the discount to parity, would see the price reach 630-640¢/kg cwt.  Prices haven’t been this good since October.


Key points:

  • The southern cattle prices discount to the EYCI has fallen to its annual low point for the year.
  • From the start of February southern young cattle prices generally improve 20-30¢ relative to the EYCI.
  • Finished cattle have further to improve than restocker or feeder prices, and prices are unlikely to fall in the short term.

What does this mean?

Seasonality in cattle markets is driven by cattle supply, and the case of the southern discount to the EYCI is no different.  Seasonality in this case is reliable, which suggests that young cattle in general, and trade steers and heifers in particular, are likely to improve in price over the coming month or two.

Whether it’s worth holding cattle to profit from this upside depends on the costs of carrying cattle through, and the direction of the EYCI.

In the north the decreasing premium to the EYCI is usually counteracted by a small improvement in the EYCI itself, and as such there it only the risk of cattle prices falling in general to discourage putting more weight on cattle.


Ameri-can and Mexi-can’t

It’s now nearly a week since Trump was sworn in,
and he has been busy signing executive orders. The
market is tentatively watching Trumps actions,
especially when it comes to corn.

One of the first acts which Trump performed was a
freeze on the activities of the Environmental
Protection Agency (EPA). This has caused a high
degree of consternation by climate change proponents
throughout the world. One of the key environmental
policies introduced by the EPA under the Obama
administration was the renewable fuel
standard/biofuel mandate. This required petroleum
producers to blend at least 10% bioethanol with fossil
oil, and there were plans to increase the blend.

This is great news for corn producers in the US, as it
created a relatively inelastic demand for corn to
maintain the blending ratio. It is speculated that
Trump may at the least curtail the biofuel mandate,
which would have a detrimental impact on demand
and therefore price.

In addition, Trump has continued his calls for a wall
between Mexico and the US which unsurprisingly is
increasing tensions between the two nations. The US
and Mexico are strong trade partners when it comes to
corn, with nearly all corn imports in Mexico originating
in the US.

Any issue with trade between the two countries would be
likely to impact corn (and linked feeds), as Mexico is the
2nd largest importer of corn in the world. In recent months,
Mexican buying power has already been eroded, with the
value of the US$ rising against the Peso, since the day of
the election (figure 1).

The biofuel mandate and the deteriorating Mexico-US
relations have impacted the corn market (figure 2) in recent
days, a deteriorating corn price will flow through to other feed
grains such as sorghum and barley.

Trump’s executive orders could be extremely negative to US
corn farmers. It is yet to be seen how far the policies enacted
by the president will marry up with his election speeches, but so
far, he has held up to his word. I would however expect that the
strong farm lobby in the US, where has a high degree of support
will in time make his moves more cautious.

The Week Ahead

Politics will continue to play a part as the market unwinds
Trump’s intentions, however eyes will start to move towards
the progress of the northern hemisphere crop.

It is still too early to form a strong view on the global crop,
but to raise prices substantially we do require a supply shock.

A market within the market

Picture1
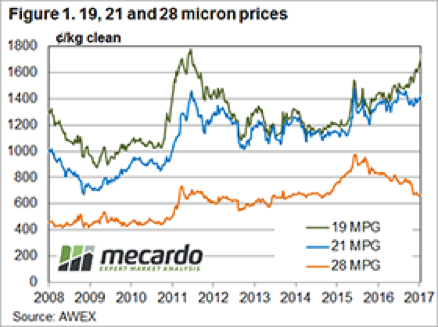
The response from three wool brokers this week when asked about the wool market was unanimous – it’s extremely good if you have wool 19 micron and finer, its good if you are in the “bread and butter” 20 to 22 micron range, and it’s terrible if you have crossbred types. This reinforces the concept that the wool market is not homogenous, it’s made up of a variety different markets.

There were some proviso’s on the above comment; the increasing number of lots containing higher levels of vegetable matter and burr are starting to be left behind, with buyers preferencing the good “FNF” (free or nearly free) types. This is a normal response as more wool with fault comes forward at this time of the year. The good season with excess growth of grass and burr’s is a factor; we note that it is usually more extreme when wool prices are high.

The general market showed a lift of 10 cents in A$, and with a weaker US$ the EMI lifted 22 cents in US$ terms.

Picture2
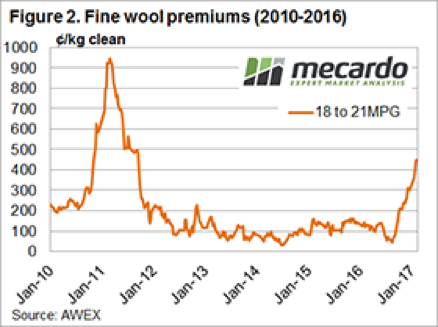
Fine wool has finally come out of the shadows and remerged to show good premiums over the mainstream types, the concern with the trade now is that this incentive for fine wool producers to continue with this specialty product has come too late for some. The fine wool premium as shown in Fig 2, identifies that the 18 premium over 21 MPG is now at a record not seen since September 2011

This should see the fine wool prices continue to lead the market, supporting the other merino microns (a repayment of recent times when the medium wool supported fine wool prices). The concern about supply of fine and superfine wool is not simply about wool producers having taken breeding decisions based on the disappointing prices of recent times; the terrific season across most wool growing areas means that each flock will test broader this season.

The week ahead

Next week an offering of 45,861 bales at all centres is rostered, its hard to see that there is not more of the same coming with wool producers (except for cross-bred types) happy to take full advantage of a buoyant market.

Buyers take a pause as dry weather outlook released

The Eastern Young Cattle Indicator (EYCI) was FIGURE 1
marginally softer this week as the Australia Day
holiday and a release from the Bureau of Meteorology
(BOM) showing dryer conditions expected for
February through to April gave buyers reason to pause.

Figure 1 highlights the anticipated rainfall outlook
released from BOM which highlights a reduced
likelihood for rainfall to exceed the seasonal averages
for much of the central and south-eastern region of the
nation. The Bureau is also forecasting a hotter than
average minimum and maximum temperature range
for the same areas of the country anticipated to Figure 2
experience the dry spell. The dry and hot forecast
appearing to take some of the “heat” out for the cattle
market this week.

East coast cattle slaughter figures for the week ending
20th January coming in 2.8% higher than for the same
time in 2016 at 112,995 head boosted by Queensland
weekly slaughter figures. Indeed, Queensland was the
only state in the nation to record weekly slaughter
figures above the 2016 levels and above the five-year
average for this time of the year. Despite the boost from
the “Sunshine state” total east coast slaughter is still Figure 3
tracking 8.2% below the five-year average trend – figure 2.

Figure 3 outlines this week’s sideways movement in
EYCI closing just 0.75¢ softer at 651.5¢/kg cwt as
restockers pause to think about the weather implications.
This time last year the MLA released an article looking
at the relationship between movements in the EYCI
over January compared the overall performance over
the season. Interestingly they discovered that 78% of
the time the January performance was mirrored in the
rest of the year’s performance.

The week ahead

The MLA article would seem to suggest that based on this
January’s price movements we are in for a positive price
pattern this year, although not as strong price gains as those
that occurred during 2015 and 2016 – figure 3. As we head
into February eyes will be on the skies, temperature gauges
and the condition of the pasture as this will influence how
aggressive restocker demand will be for cattle and if they
will continue to drive the price direction as much as they
did last season.

Long term mutton prices

Key points:

  • The most recent peak in NSW mutton prices Picture1in deflated terms (current day dollars) occurred during April 2011 at 523¢/kg cwt
  • The long term average deflated NSW mutton price is 239¢ based on data going as far back as 1949
  • Since 1949, NSW mutton prices have spent 70% of the time between 115¢-362¢ and 95% of the time between 0¢-485¢

Last week Mecardo released an article on long term deflated prices for the Eastern States Trade Lamb indicator (ESTLI) and this week we have published a similar analysis focusing on long term mutton prices, looking at NSW mutton prices since 1949.

Click here to read the deflated ESTLI article.Picture2

Figure 1 shows the price pattern for both nominal and deflated average monthly NSW mutton prices going back to 1949. Clearly, the 2016 season was a good one for mutton prices and the 2017 season bodes well with the NSW mutton January average of 394¢/kg cwt just sitting 15.4% shy of the nominal average monthly peak that occurred during April 2011 at 466¢. In deflated terms the current mutton prices are holding up well too with a deflated peak in 2011 at 523¢, not too far away from the current level.

Indeed, figure 2 highlights just how well mutton prices have been in current day dollars with the market sitting well above the long term deflated monthly average of 239¢/kg cwt – (blue dotted line). The green 70% range between 115¢ – 362¢ shows were deflated mutton prices have traded for 70% of the time since 1949 and the red lines show the range that encompasses 95% of the variation in price (0¢-485¢/kg cwt) over the same time frame.

Figure 3 displays the same deflated mutton Picture3
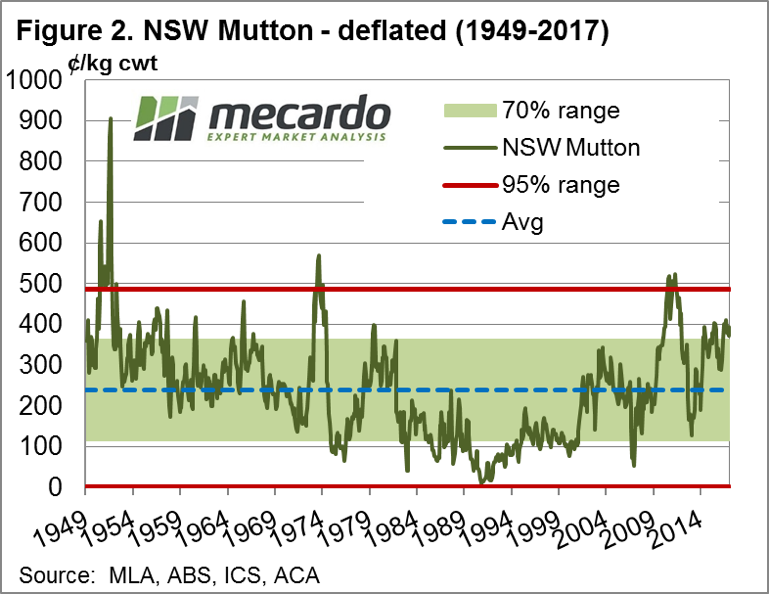
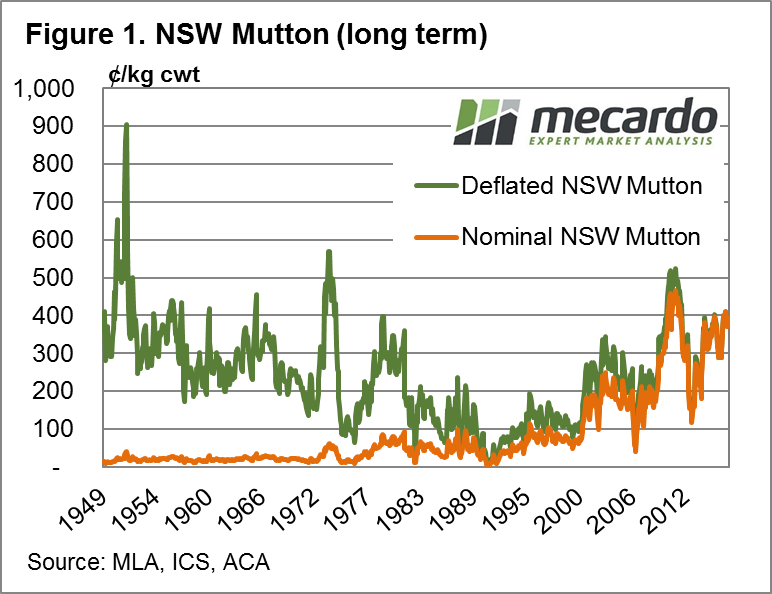
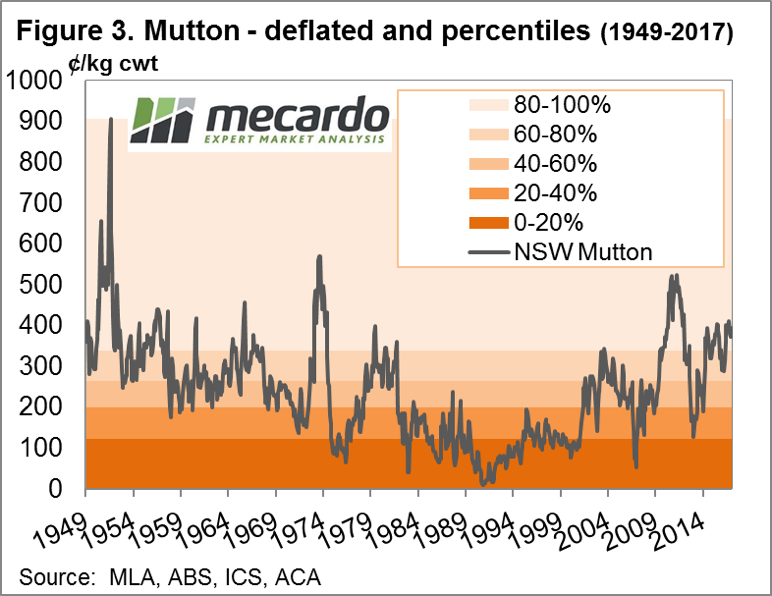
price series overlaid with percentile ranges which shows that the current average monthly NSW mutton price has remained in the 80-100th percentile range since April 2016. Unquestionably, mutton prices are holding firm with the January average of 394¢ sitting at the 90th percentile when compared to the deflated price data series since 1949.

What does this mean?

As outlined in the “Mutton hitting the ceiling” article from last week (see link above) there is a case for mutton prices continuing to firm into the 2017 season. While the deflated data suggest we are at reasonably high historic levels there have been times in the past when mutton prices were higher in real terms.

NSW mutton prices wouldn’t be considered to be at extremely high levels until above 485¢ and have reached as high as 523¢ (in current dollar terms) within the last five years, so mutton prices near or slightly above 500¢ this season aren’t out of the question.