Tag: Analysis

Support coming from US export market

Cattle prices edged higher this week, as markets remain in a holding pattern, seemingly across all levels.  Export beef prices have started the year relatively steady, putting a base in the market.  Slaughter cattle are maybe a little too expensive for processors, but tight supply and restocker demand is supporting prices.

Figure2 State Trader Steer Prices

Regular readers will know we often quote the 90CL Frozen Cow indicator as a benchmark for export beef prices.  Historically the 90CL has had a good relationship with cattle prices here, and it is reported weekly, hence we like to use it.

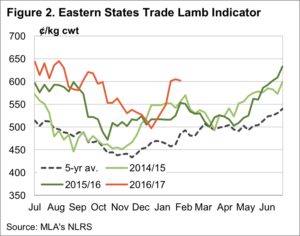
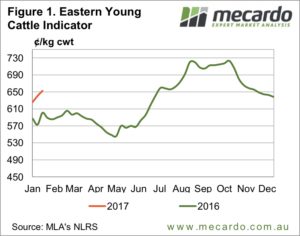
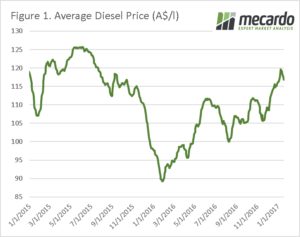
This week the 90CL edged a little higher, hitting 590¢/kg cwt, almost exactly the same level as this time last year (figure 1).  In fact, the 90CL indicator has tracked in a historically narrow range for much of the last 12 months, bouncing between 550 and 600¢/kg swt.  Tight supply out of Australia and New Zealand has been somewhat counteracted by weakening demand from the US.

According to the weekly Steiner report, beef demand in the US has improved recently.  This has been on the back of cheaper domestic beef, and improving margins for retailers, therefore they have been pushing beef in their marketing campaigns.  For us it’s strange to think retail or fast food marketing campaigns could have any impact on cattle prices, but apparently it’s gFigure1 90CL vs EYCI
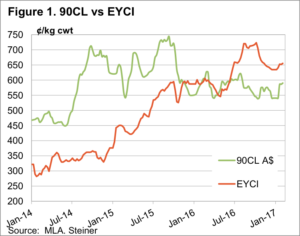
ood for us if McDonalds sell more burgers in the US.

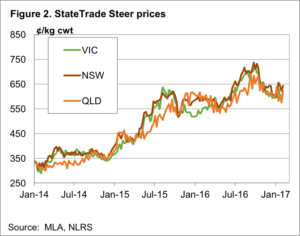
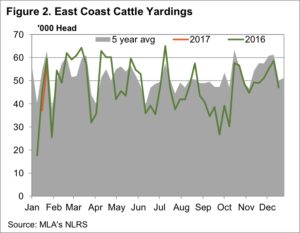
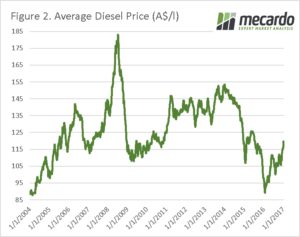
Locally it was Queensland where the action was this week.  The Qld trade steer indicator rallied 50¢ to 625¢/kg cwt (figure 2).  The saleyards in Queensland are a full dollar higher than the Over the Hooks quote.


The week ahead

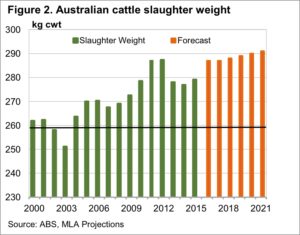
Figure 2 shows there is little difference between state trade steer indicators, which is normal for this time of year, as markets move into a holding pattern.  The next major market move is usually lower in autumn, as northern weaner cattle and cull cows hit the market.  How much impact this has this year will depend on rainfall, obviously.

Cattle projections forecasting lower slaughter but demand will drive prices

Meat and Livestock Australia (MLA) have hit the target
with their recent cattle projections, and as such not much
has changed in their January update. It is, however, Figure 1
worthwhile taking a look at what the peak body see is
going to be the supply situation for the coming year
and beyond.

Figure 1 shows MLA’s slaughter and herd projections,
and how slaughter has changed from the October
estimates. The herd is still expected to have bottomed
out last year, at 26.14 million head, a 20 year low.

A relatively quick herd rebuild is expected, on the
back of 20 year low slaughter rates next year. The herdFigure 2
isn’t expected to reach the highs of 2013 in the next five years,
but is expected to move back above 28 million head by 2019.

MLA have made some slight revisions to slaughter
numbers. For 2016 slaughter was down 100,000 head,
and this has been shifted into 2017, lifting the estimate
by 1.4% to 7.1 million head. Further down the track
slaughter estimates have been lifted marginally,
basically due to the herd being slightly larger than previously estimated.

The projections of 8 million head slaughtered in 2020 Figure 3
and 2021 are high relative to historical levels, but remain
well behind the peaks of 2014 and 2015. Obviously MLA’s projections are based on ‘normal’ seasonal conditions, with the growth in the herd driven by current strong prices, and the fact many regions are currently understocked.

Some interesting figures from this week’s projections
comes from the average carcase weights of cattle
slaughtered. Figure 2 shows a jump in slaughter weights
in 2016, from the lows of the drought where heavy female
young cattle slaughter saw weights at 278-279kgs. In 2016
slaughter weights increased 3% to 287kgs per head, and
are expected to start a slow ascent to 291kgs by 2021.

Interestingly the 2016 slaughter weights couldn’t quite
eclipse those seen in 2012, which suggests that the good
season wasn’t enough to see cattle held to heavier weights.
Rather producers took the good money when cattle
were ready.

Key points:

  • MLA have released their updated cattle projections,
    with little change to herd or slaughter forecasts.
  • The cattle herd is expected to have bottomed out in 2016,
    with the slaughter low coming this year.
  • Continued tight cattle supply should ensure prices
    remain relatively strong for the coming year.

What does this mean?

Regular readers will be familiar with figure 3, which plots
the spread between the 90CL export price and the EYCI,
against annual cattle slaughter. The fact that the 2016
point sits well above the trend suggests local demand
was very strong in 2016.

As that restocker demand wanes as the herd grows we
would expect the EYCI’s premium over the 90CL to fall
back to the trend line. This means that even though slaughter
is expected to be lower this year, we may see lower prices as
well, with the current 90CL price, and the historical trend
suggesting the EYCI should average around 600¢ in 2017.

Tight supply maintains the strong prices

Meat and Livestock Australia (MLA) slaughter figures
confirmed that January lamb supply has been tighter
than usual. The result has been very strong summer
lamb prices, at a time when the market has tracked
sideways in recent years.

Figure 1 shows east coast lamb slaughter for the week
ending the 20th of January was well below last year.
The 18% reduction in numbers seems to have been due
to the good spring, which saw many lambs finish early
and hit the market in December, leaving a dearth of
numbers in January.

The result has been the best January lamb prices since
2011, with the Eastern States Trade Lamb Indicator
(ESTLI) managing to spend its third week above 600¢.

The ESTLI did ease slightly this week, but only 2¢ to
finish at 602¢/kg cwt. Mutton values took more of a hit,
losing 12¢ to hit 395¢/kg cwt as supply improved.

The question now for lamb markets is whether they can
maintain the strong levels. The five year average would
suggest they can, but figure 2 shows that in the last two
years February has seen the ESTLI ease. Lower prices in
February are likely due to domestic demand waning after
Australia Day and supply improving as shorn lambs start
to come back to the market.

As always the price trend will depend on how many lambs
are actually out there, and as indicated by survey results,
it could be fewer this year, so lamb prices could find some
solid support in the 560-580¢/kg cwt range.

The Week Ahead

We expect prices to ease over the coming weeks, but not
by much. Lamb producers not likely to be forced to sell in
the short terms, so may hold out for stronger prices if we
see any correction.

Mutton values should recover from this week’s correction,
it’s hard to see more supply coming forward given the feed
situation and the wool price.


Reality check has timely lessons

Last week we had wool at all-time highs, and the
usual response is to look forward to see how much
higher it could go. This week the wool market provided
a reality check, prices on the opening day (Tuesday)
were down 20 to 40 cents compared to the close of last week.
It was the mid-point of Merino microns that suffered,
with 19 to 21 MPG feeling the brunt of the retracement
while fine wool was least effected.
The good news was that after the “correction” on
Tuesday, the market was remarkably resilient on
Wednesday; in fact, by the end of the week the 17 & 18
MPG’S had closed above last week’s level in Melbourne.

To retain some perspective; the EMI is still well above
the closing December markets, whether measured in A$
or US$ terms – figure 1.

The trend of improving fine wool premiums continued
this week; the 18 Basis premium over 21 MPG has
doubled since October last year. Fine wool producers
have seen this premium rally from 123 cents this time
last year to now sit at 443. This will provide an incentive
to hold the line with fine wool sheep, although it is
concerning processors how far the micron will broaden
this year given the excellent seasonal conditions currently in play.

Growers response to the easing wool market was to pass-in 13.3% of the offering, or almost 6,000 bales. To break this down a bit more, of the 30,657 bales of Merino fleece and skirtings offered, 3,500 bales or 11.4% were passed-in by brokers. Normally this would be seen
as a “brave” decision when the market is at record levels; the change in supply as well as the very limited wool either in the pipeline or in brokers stores makes this decision a little more understandable.

As we said last week, high prices provide an opportunity in
the wool market to forward sell, this week’s retracement
is a timely reminder that often high prices are the
antidote for high prices.Table 1

This week we have had a lot of feedback about our blog
article, “Let’s make merino great again!”. We are looking
for innovations and ideas we can publicise to showcase the
great things that are happening in the merino/wool industry.

The Week Ahead

The offering of next week is 42,584 bales in all three centres
over two days. Based on the recovery to the Tuesday correction
and the reduced offering we should see the market at least hold.
The test will be if the processors remain buoyant about the
market outlook or were they “spooked” by this week’s roller
coaster and decide to sit back and see how this plays out.
As usual, interesting times for wool.


Demand driving cattle prices higher

Cattle markets have opened 2017 with a bit of a bang,
with extraordinary restocker demand, and very good
feeder demand driving prices higher. Cattle supply in
saleyards has been similar to last year, so it would
seem demand is the driver.

The Eastern Young Cattle Indicator (EYCI) has
rallied back above 650¢/kg cwt this week, hitting a
six week high (figure 1). With the dearth of quotes for
the cattle market last week, it’s hard to pinpoint who
is driving the stronger prices. However, with the east
coast trade steer sitting at 632¢, and feeder cattle
around 10¢ higher, it would seem restockers are
dragging the EYCI higher.

East Coast cattle yardings rallied higher this week,
which is not unusual as normal sales resume. Usually
the pent up supply from the break sees prices move
sideways in January, but it appears it is pent up
demand pushing prices higher.

Some recent rain in Queensland has no doubt helped
push demand in the north, but large parts of
southern Queensland and NSW are still 25-100mm
below the January average.

After opening up much stronger, heavy steers eased
marginally this week (figure 3) as the strong price
drew out supply, while cows were also a little lower.
Despite the wide spread between finished and store
cattle prices, the numbers seem to still be working for
those purchasing expensive young cattle.

The Week Ahead

There has been a few positives for the cattle market of late,
and this has resulted in higher prices early this year.
Add to this the widespread rain which is forecast
for the next week and we could see a little more
upside for prices in the short term.

However, unless we see a strong rally in export values,
it’s hard to see cattle getting back to the levels of last
spring, with 5% upside probably the limit.


Input update: Fertilizer and Fuel (Jan 2017)

Key Points

  • The August-November average diesel price at port was $106/l
    versus $116 for the past month.
  • There is a global glut of fertilizers on the market which is unlikely to rectify anytime soon.

The harvest is all but done, now is the time to start looking towards next year. There will be changes in planting, a little more of this and a little less of that. However, regardless of what you plant you will be burning diesel and spreading fertilizer. In this report, we look at these two important inputs.

In the last two months’ millions of litres of diesel
will have been burnt across the grain growing regions
of Australia, and in reality, we are only a few months
away from starting all over again with seeding and
the diesel bills will start flowing in. In figure 1,
the average port diesel price for Australia is
displayed since the start of 2015. Assuming that
most farmers purchased their fuel well in advance
of harvest as recommended by Mecardo early in 2016,
the input costs for fuel for the 2016/17 harvest
will be considerably lower than current levels.

The average diesel price for Aug/Nov was A$106/l,
versus A$116/l for the past month. Although diesel is
creeping back up diesel prices have spent a lot of the
last ten years above current levels (figure 2). In late
December OPEC agreed for the first time in eight
years to cut oil production, which alongside improving
economic conditions has led to an increase in crude
oil prices and therefore diesel. The market for oil is
hard to predict and in coming months it is important
to keep a close eye on the market with a view to
locking in fuel for the coming season either through
swaps or fuel contracts.

The picture is rosier when it comes to fertilizer. In
figure 3, we can see that both DAP and Urea are both
pricing at good levels since the start of the decade.
Although Urea has seen an uptick in past months, the
outlook for fertilizer supply still points to a surplus for
at least the next two to three years. The supply issue
aside the real risk is a fall in the A$ increasing the
cost of imports.

What does it mean?

The fertilizer market remains at low levels; however,
the market outlook remains bearish to neutral reducing
the impetus to go out straight away and stock up.

In terms of fuel the outlook is less certain, and looking in
a proportion of fuel requirements in advance could be an
advisable risk management strategy.


ESTLI holds firm despite strong throughput and currency

The Eastern States Trade Lamb Indicator (ESTLI)
held onto the strong gains since the start of the
year remaining above 600¢/kg cwt this week
in the face of solid lamb throughput figures,
particularly from NSW, and a resurgent A$ –
boosted by a Trump impacted weaker US$.

Figure 1 shows the east coast lamb yarding
figures for this week opening the year at
229,495 head, some 21.6% above the yarding
figures for this time last season and 34.7%
higher than the five-year average. Overall east
coast lamb yardings given a boost from NSW
throughput, which came in 26.4% above figures
recorded for this week in 2016 and 58.9% higher
than the five-year average for this time of year.

After a stronger start to the season slaughter figures
have returned to levels consistent with the 2016
pattern – figure 2. East coast lamb slaughter for the
week ending 13th January reported at 382,865 head,
a mere 2.3% below the slaughter figures for the same
week in 2016 and 8.9% above the five-year average
for this time in the season.

The ESTLI closing yesterday at 609¢/kg cwt, a
10¢ gain on last week. Not as impressive as the
previous week’s rally but a gain nevertheless.
Combined with an A$ 5% higher than where is
finished 2016 this places the ESTLI in US$
terms the highest it has been since September
2016 – figure 3. Despite the recent A$ strength
the currency currently trading at 75.5US¢ is still
below the two-decade average of 76.25US¢.

The Week Ahead

The A$ recovery over the last month has been on
the back of broad US$ weakness with financial
market nervousness setting in as we draw closer
to a President Trump inauguration. Expect regular
currency volatility as the new leader settles in and
his unpredictable style of communication via Twitter
running of the country continues to unnerve the
market. Any significant impact on export demand
for Australian sheep and lamb product unlikely
unless a prolonged period of US$ weakness pushes
the A$ above 85-90US¢.


Is it a record? Maybe yes, maybe no.

The first week of sales for the new year last week
opened with a bang, the EMI smashed through
1400 cents, while the WMI reached almost 1500
cents. (WMI has little influence from X Bred prices).
This week the good times continued, prompting
AWI to announce the wool market was at an
all-time record. This statement needs a little more
detail to confirm; the wool market across the board
is not all at record levels.

While not wanting to dampen down the enthusiasm,
the wool market covers a wide range of types, not all
are trading at highs. It also needs to consider the
timeframe; the high this week of the EMI still hasn’t
overtaken the April 1988 high of 1523. As Mecardo
followers will know, we also look at the price the
processors are paying to determine how strong is
demand; so, when looking at prices do you consider
the price from the buyer’s perspective or the seller’s
perspective? We think that while the price the grower
receives is important from an Australian viewpoint,
the cost to the buyers is a truer reflection of demand.

In Au$ terms the June/July period of 2011 was the
previous recent high for the EMI – 1426 cents.
At this time the A$ was trading at US$1.07, causing
the processors to shell out US$ 1500 cents. Note
that this week the EMI in US$ terms is still below
1100 cents. (Fig 1.)

The positives to the above analysis is that in this
scenario everyone is happy. Buyers receive regular
orders when the market is rising; processors don’t
want to miss out and a strong market resonates
confidence all the way up the wool pipeline. The
lower A$ (compared to peak levels when it traded
around parity) is keeping prices for the ultimate
end customers below previous peaks. Happy sellers,
happy buyers – the true definition of a “win-win!”.

On a cautionary note, the EMI high reached in the
winter of 2011 was then followed by the recent history
low point of 946 in September 2012. The market then
wobbled along with the EMI oscillating between
1000 + 1140 until early 2015 before the beginning of
this current positive run. Out take on this rear view is
that markets are continuously moving; so at “record”
levels locking in some of the future clip needs to be
considered. As one grower said, this is the time to
“kick the can as far down the road as we can!”

The trend of improving fine wool premiums continued
this week, we are now seeing the highest “basis” levels
since January 2012, however as Fig 2 shows, we have a
long way to run to get back to the heady days of 2011.
It is great to see that the 18 – 21 MPG basis has doubled
to 400 cents since October last year, fine wool producers
should begin to feel that their product is again on the up.

A challenge for the industry if, as is expected, the market
remains strong but supply stays static, is that the wool
trade may become frustrated that higher prices are not
encouraging increased production. As Andrew Woods
reported, sheep numbers in these bumper times are
only forecast to rise by 1.4% next year.

The Week Ahead

The offering of next week is below 50,000 bales so after a
couple of big offerings supply is easing, and based on reports
from traders the market is going to continue to remain active.
It would be unusual to see the market continue to rise at the
same rate as the last 2 week’s (not unprecedented though!),
so on balance a steady week ahead with a continuance of
strong demand for selected lots of the better-quality fine types.


Make grain great again

This week Obama is out, and Trump is officially in.
The world will be watching as the new ‘leader of the
free world’ takes office, and whether he will still be
moving the markets through his twitter account.
The market is looking forward to the 2017/18 harvest,
and wondering how the global wheat crop will look
for next year. Will plantings be down?

The futures market had a strong rally since the USDA
set their forecasts for the US winter wheat planting
at the lowest level since 1909, however the reality
has crept back into the market that global end stocks
are still record high. Although US plantings of wheat
are expected to be reduced, it is expected by the
International Grain Council (IGC) that the rest of
the world will largely be unchanged. The IGC point
to favourable conditions in the northern hemisphere
resulting in a predicted 17/18 crop of around 735mmt,
and the third largest on record. We have to remind
that forecasts at this time of year are open to large
margins of error, yet the market has responded with
falls overnight (figure 1).

At a local level it will not be a surprise to anyone
reading Mecardo updates over the past year that the
size of the harvest is pressuring basis. In table 1,
we have shown basis levels across a number of ports.
The general trend is that basis is slipping across all
ports, the most exceptional is Port Lincoln which
has steadily fallen into negative territory. In
Kwinana basis is still strong, however looking back
at December levels were greater than $50.

All eyes in the coming weeks will be on President-elect Trump,
with a wide degree of volatility expected.
This has already been seen with traders dumping the
US$ (figure 2) despite comments from federal reserve
pointing towards interest rate rises in the coming
weeks. Overnight Trump appointed George Perdue
as the secretary for agriculture. Perdue is the first
agriculture secretary since 1994 from out with the
Midwest, but has a wide range of experience within
the grain and livestock industries.

The Week Ahead

The inauguration will be held at 3am east Australian
time on Saturday morning, I will probably be up at
that time watching it thanks to a sleepless newborn.
There are a lot of contrary views when it comes to
Trump and regardless of your view of him his election
has produced a lot of energy. In the coming months,
we will get a strong view of whether candidate Trump
is the same as President Trump. One of the risks in
markets which is always extremely difficult to predict
is political, and we could see black swan events in the
coming months, and that is before we look at the
coming EU elections.

The world continues to be awash with wheat, and barring
any major weather event in the next 6-8 months, prices
will remain low. In the last four seasons the global crop
has largely made it through without any major hiccups –
can we get a “five-peat”?

China wades back in despite higher A$

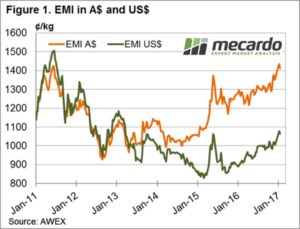
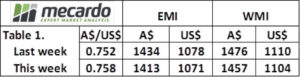
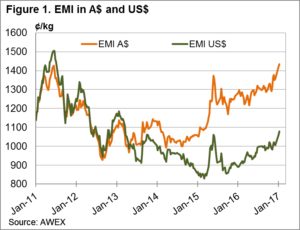
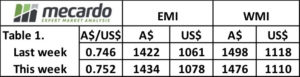
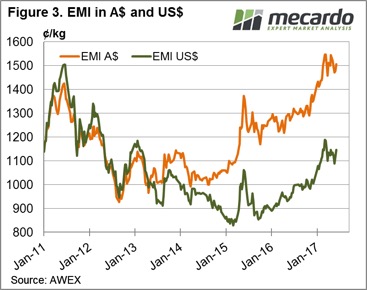
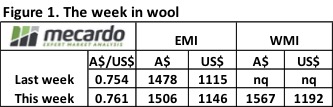
Increased demand this week from exporters noted as Chinese buyers resume their activity, undeterred in the face of a higher A$. The EMI creeping back above 1500¢, up 28¢ to 1506¢ and gaining 31US¢ to 1146US¢. The Western markets resumed auctions this week and activity participated in the rally, making up for lost time with a 63¢ rise to see the WMI at 1567¢, up 58¢ in US terms to 1192US¢.

Price gains for most categories of wool noted, although the medium fibres leading the charge higher with gains of 50-65¢ noted for microns between 20 to 23 mpg in the East and 90-110¢ gains for similar wool in the West. The rally in finer wool limited to a 15-50¢ range in all three centres.

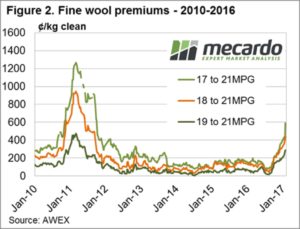
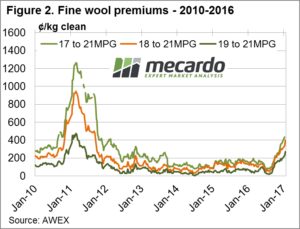
Interestingly, the medium fibres displaying a more robust price movement this time around with the 21 micron reaching levels in AUD terms not seen since the middle 1988. Indeed, in May 2016 when the 21-micron hit 1535¢ in the South the 17 mpg was trading above $23 and the 19 mpg was above $19.5. This week with 21 mpg at 1549¢ the 17-micron unable to climb above $22 and 19-micron can’t crack the $19 level.

Some whispers around the traps that if the Chinese step away again the fine end could be in for a quick correction. Although, the prospect of higher US interest rates later this year could continue to play into wool grower’s favour. This week the US Federal Reserve lifted rates and because this was highly anticipated it had limited impact on the A$. However, any sign that the US will move to a more tightening bias or indications of more frequent potential future rate rises in the US could see the A$ come under reasonable pressure again, pushing it back toward the 70US¢ level. A relatively softer A$ now compared to back in 2011/12 helping to keep wool prices competitive overseas, despite the high local prices – figure 3.