 In commodities, and particularly in agricultural commodities, a stable market is generally a good sign, especially if the market is at the top of its recent trading range. The wool market can best be described as “steady” this week, however, as usual there were some exceptions with the fine wool and crossbred selections in Melbourne underperforming the market.
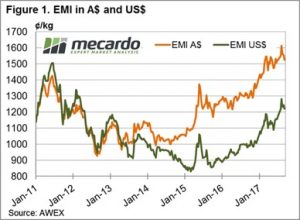
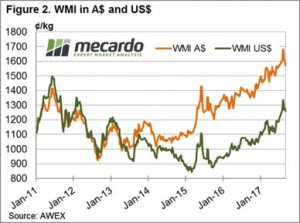
The Eastern Market Indicator for the week remained unchanged at 1,525 cents in A$ terms, while in US$’s it fell 1 cent to 1,220 (Figure 1). Not to be outdone, the market in the west followed a similar path, rising 2 cents to close at 1572 cents.
The skirtings market was by comparison erratic; gains on the first day of 10 to 20 cents were given back on the second day of selling to see this sector unchanged on last week.
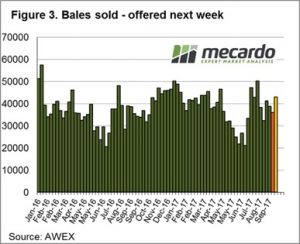
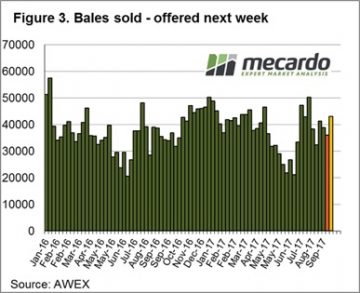
 A total of 40,699 bales were offered for sale this week. The steady market encouraged growers to more readily meet the market, with the pass-in rate of 6.9% well down from last week’s significant 15.5%. (Figure 3).
In regards to the Melbourne fine wool market performance, this was affected by an increasing prevalence of wool exhibiting higher mid breaks. To emphasise, AWEX report that wool with less than 20% mid breaks found increased competition and greater premiums.
The week ahead
A total of 41,483 bales are listed for sale next week across the three selling centres. This is consistent for the next three weeks as the early spring shearing rolls into stores.
 The market has been a bit “bouncy” up to this week, we wouldn’t predict either stable or unstable for next week, its “one of those times” in the wool market!


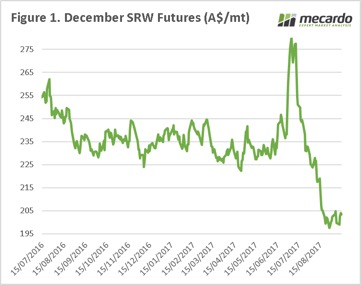 The Australian east coast crop is a tale of two continents, with the bulk of NSW and QLD in a poor state, and Victoria/ East SA developing. The market is well and truly capturing the status of the crop, and the domestic market is pricing accordingly. This creates an issue of premiums being available (half full), but being unable to take advantage of them (half empty).
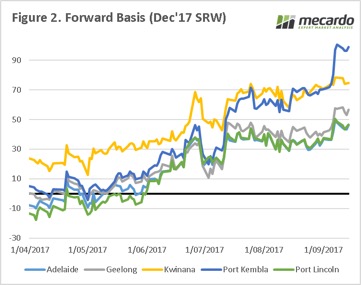 If a grower in Port Kembla had taken out a swap during the height of the July rally, then their overall price today would be >$370, which shows the value in strategic marketing using derivatives.
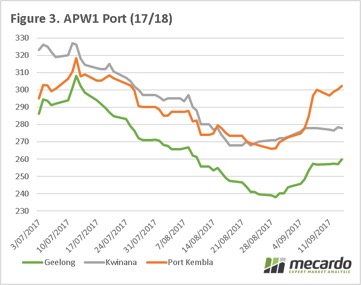 In the next week will we see the speculators continue to view the market as bearish, or will we start to see additional profit taking?
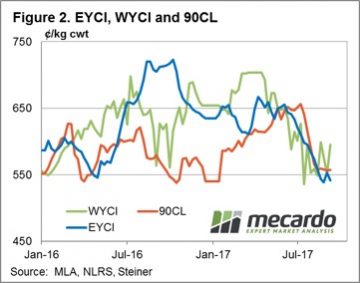
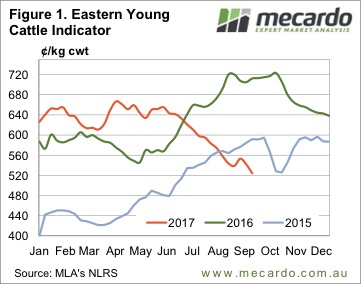 A couple of weeks ago we wrote in this column that the Eastern Young Cattle Indicator (EYCI), and cattle prices in general, might have found a floor. Turns out we were wrong. Figure 1 shows the EYCI falling below the spring lows of 2015, and heading towards 500¢.
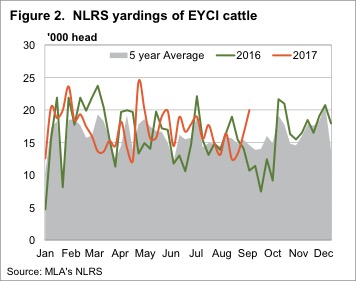 Over in WA the Western Young Cattle Indicator (WYCI) has also weakened, but only eased 6¢ to 589¢/kg cwt. Unlike the EYCI, which is sitting 26% below this time last year, the WYCI is just 4.7% lower, so things aren’t too bad for WA producers.
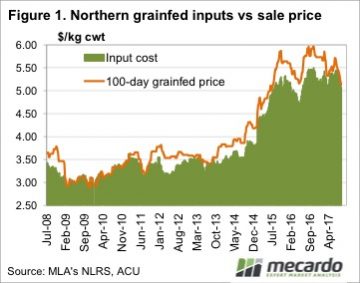 Grainfed cattle prices have fallen in line with the rest of the market, with the consistent decline putting pressure on lotfeeder margins. With pressure on lotfeeder margins comes lower feeder cattle prices, although, on a relative scale, they are performing ok.
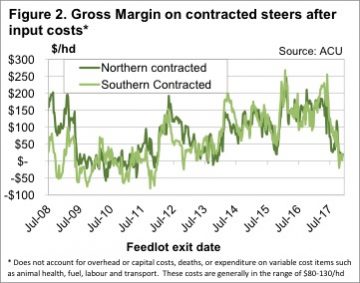 The situation is a bit different now, compared to 2009-2011. Back then cattle on feed numbers were low, with cattle going through feedlots at break-even to keep the doors open. Currently there are plenty of cattle on feed, and we have seen over the past couple of years that weak margins don’t last long.
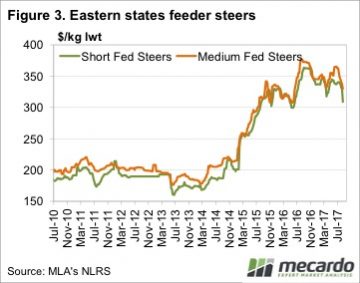 It’s not unusual to see tight feeder cattle supply causing low lotfeeder margins at this time of year. The question is what happen when supply improves in September and October. Under current grainfed cattle and grain prices, feeder prices will have to fall 20¢/kg lwt for lotfeeder margins to improve back to $100/head. Figure 2 shows that $100/head is more in line with recent history.
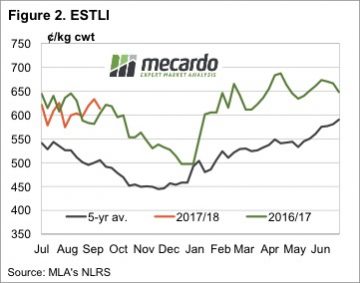
 Mild price declines across the board noted for all categories of national saleyard lamb and sheep this week despite lower numbers at the saleyard. The headline Eastern States Trade Lamb Indicator (ESTLI) down 2.6% to close at 597¢/kg cwt, while National Mutton off just 1.2% to 400¢/kg as gains in NSW and Tasmanian mutton offset falls elsewhere.
  National saleyard lamb categories all softer this week with falls noted between 1-4%, Merino lamb leading the decline with a 3.8% drop to 539¢/kg cwt. National Trade and Heavy lambs the better performers, only down 1.8% (596¢) and 1.6% (601¢), respectively. The lower prices on the back of a reduced saleyard offering indicative of slightly weaker demand.
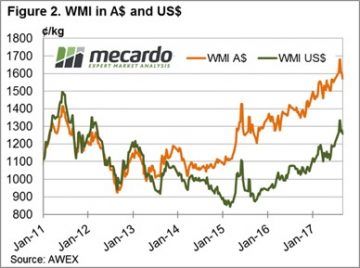
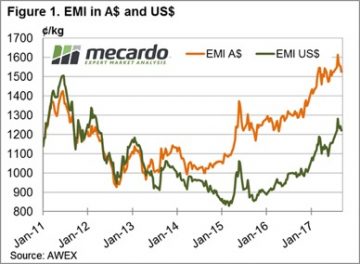 The Eastern Market Indicator dropped down 31 cents to 1,525 cents in A$ terms this week (Figure 1). The market in the west followed a similar path, falling 30 cents out to 1570 cents close (Figure 2). Our dollar is still holding up against the US$, which meant the EMI fared slightly better in US$ terms finishing 22 cents lower on the week at 1221 cents. The A$ traded at 80.5 early and pulled back as the week progressed which was reflected in the market as prices stabilised on the second day of auctions.
 Merino skirtings and crossbred wools also felt a quick early blow in the market before stabilising on day 2. Recovery was slightly better than for Merinos, with losses of 15 to 30 cents for crossbreds and an average of 20 cents on skirtings. Cardings were the only category that managed a positive move by gaining just a few cents on the week.
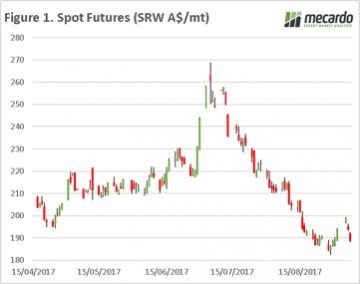 The US were busy celebrating labor day on Monday, well at least those not bracing for (or recovering from) Hurricanes. The market had a strong recovery prior to the holiday, with short sellers taking profits after a continuous decline over the past month (figure 1), however over the past two sessions the market has lost around half of these gains. The market was not helped by the Food and Agriculture Organisation raising its expectations for the global cereals crop to 2.6bmt, which would be the highest on record.
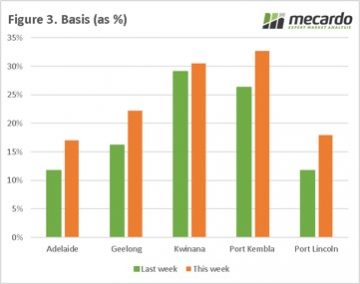
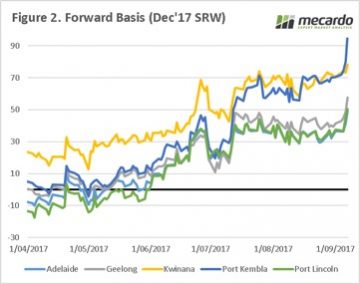 In figure 3, the basis levels as a percentage of the overall price are plotted. As we can see, there have been considerable rises in all zones. The rise was far more sedate in Kwinana, which has for the past 8 weeks maintained at strong levels, and the bulk of issues in the WA crop have been priced in. The basis levels as a percentage of the price in Kwinana and Port Kembla are now at historically high levels.
 The key will be the USDA report, will there be any surprises? The recent upgrades to the Russian crop will likely give a bearish edge to the report.
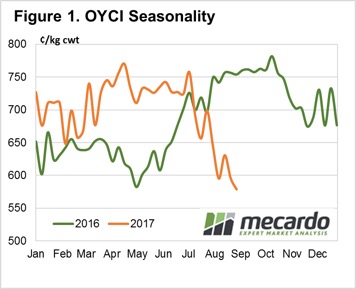 This weekly comment marks the first in our planned fortnightly Online Young Cattle Indicator (OYCI) updates as well as a general summary of the broader cattle market over the last week. Interestingly, the spread of the OYCI to the EYCI has narrowed over the month of August.
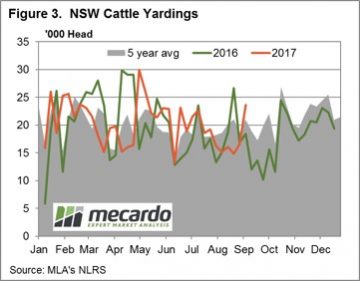
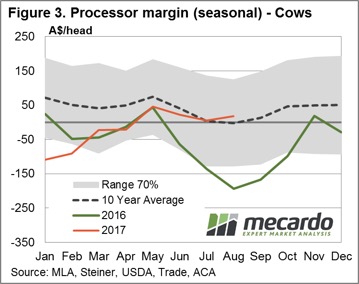
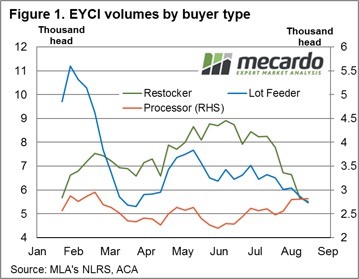 Since the start of Winter there has been a changing dynamic at the saleyard for young cattle purchases. Declines in average volumes have been noted for restockers and lot feeders, on the back of reduced pasture availability and higher feed costs. However, processor purchases have bucked the trend as their margins are stubbornly clinging on to positive territory.
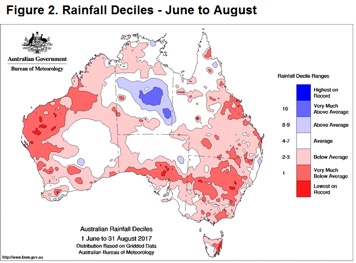 Over the season so far, restocker purchases have been averaging around 7,250 head of EYCI cattle per week. However, average purchases for the last month have reduced to 5,500 head as unseasonal dry conditions, highlighted by the rainfall deciles from June to August (figure 2), sap some of the optimism out of restocker demand.
 The updated Bureau of Meteorology three-month weather outlook indicates a move to a more neutral condition for much of the country. The BOM expect rainfall to be below average in southwest Australia, above average in parts of southeast Queensland, and has a 50/50 chance of being above or below average elsewhere.
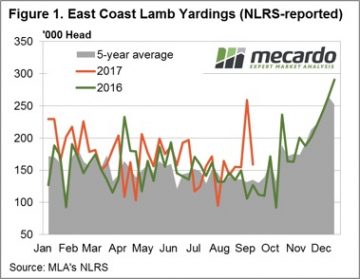
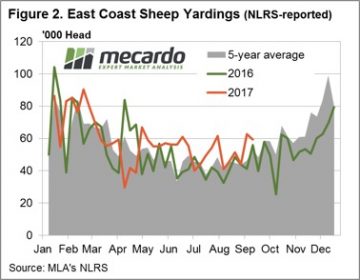
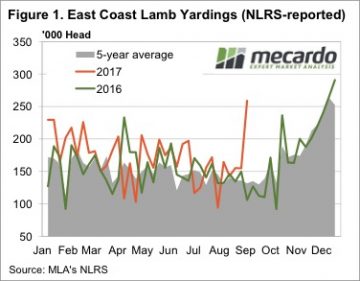 It was a rather extraordinary week for lamb supply at saleyards. In NSW lamb prices not only hit a record, but were 28.5% higher than the previous record, at 194,781 head. Lamb yardings in Victoria more than doubled, pushing East Coast yardings to a 67.5% rise for the week.
 It’s hard to see lamb supply maintaining the extraordinary levels of this week, but we don’t expect a fall in yardings to do much to price. New season lambs are now flowing fairly steadily, with the only question being over the weight of lambs. This could see heavy and trade lambs hold their ground to an extent, in the face of easing light and restocker lamb prices.