Tag: article

The Russians at the gates

In recent times, there have been accusations of Russian tampering in western politics. In the wheat game, the Russian crop is interfering with our grain pricing! In this week’s comment, we highlight the Black Sea, and its impact on global pricing.

In figure 1, the spot futures are plotted. It’s not a pretty chart. The Chicago futures market has lost 142¢/bu or approximately A$66 since the peak of the season in July. This rally has provided many of our readers with good opportunities, for those who covered swaps or confidently contracted physical forwards. It is important that when we have such an oversupplied market that, when markets rally substantially, we begin to lock away price. We must make sure we don’t aim to hit the top of the market, as you will be perpetually disappointed.

The recent fall in the market can partially be attributed to growing expectations of the Russian wheat crop. The recent WASDE report, alongside many private forecasters have tipped that the Russian crop will be the largest the country has produced at 77mt (figure 2), 7% above last year and well above (+40%) the ten-year average of 55mmt. Although, the Ukrainian crop has marginally dropped year on year, it also remains large at 22% above average.

The expectations of an immense Russian crop, alongside a low rouble, has resulted in Russian wheat becoming extremely attractive with an A$/mt terms 12.5% protein wheat pricing at $233 fob. The Black Sea crop will continue to place pressure on prices, as their export program will be substantial this year, and will be competing into similar markets to Australia.

Next Week/What does this mean?

This year seems to have parallels with the past two seasons, however last year the majority were gifted with strong production in Australia.

The focus at a local level will firmly be on the crop, at the moment the rain is coming in leaps and bounds. How long will this continue, and how much surety in the crop do we have. At present estimates of the overall crop have improved from the end of July, and it wouldn’t be unexpected to reach the upper end of the 17-22mt range.

Lamb price doesn’t want to die

Average trade lamb prices continue to track around the 600¢ mark on the east coast, and higher in the west. Lamb and sheep slaughter has rallied and is sitting well above last year’s mark, but demand appear to be keeping pace with supply.
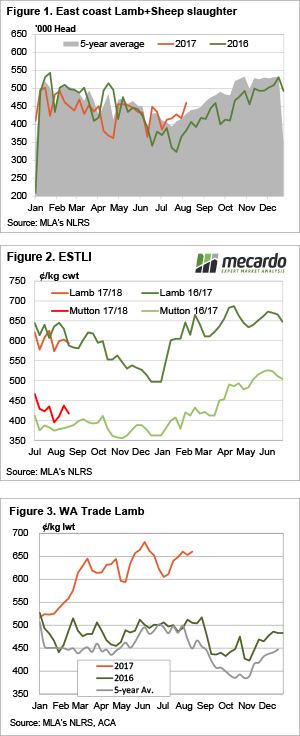
In the week ending last Friday lamb and sheep slaughter tipped over 450,000 head, and reached its highest level since March (figure 1). Ovine slaughter sat 20% above the same week in 2016, and was largely driven by much higher lamb slaughter in SA and Victoria. In NSW there was an extraordinary 65% year on year rise in sheep slaughter.

The good news is the stronger supply this year isn’t sending prices lower. Figure 2 shows the Eastern States Trade Lamb Indicator (ESTLI) and the National Mutton Indicator (NMI). The ESTLI is at almost exactly the same level as last year, despite lamb supply being stronger, while the NMI is 8.6% above this time last year.

In WA the market continues to outpace its east coast counterpart, sitting at 660¢/kg cwt this week (figure 3). In SA trade lambs are at 524¢, which for a 20kg lamb equates to a difference of $27/head. It doesn’t happen often, but it’s almost worth trucking lambs to the west.

Figure 3 also shows that the precipice is coming for WA lambs, as they there is a very reliable price decline at this time of year. How far WA lamb prices fall is the hard part, it’s hard to see them going back to 500¢, but that is where they came from in January.

The week ahead

Lamb and mutton price should decline further in most markets over the coming month. They are, however, showing stubborn resistance to lower level, even in the face of stronger supply. This is good news, but the tipping point is coming, with the only question being how low they will go. My moneys on a 525-550¢ range in September.

NZ flock still in decline, but stabilising


Beef and Lamb NZ’s mid-year stock number survey shows the Kiwi sheep flock and number of breeding ewes continuing to decline into 2017, albeit at a lesser degree than in previous seasons. Although, good pasture and ewe condition throughout the breeding cycle has seen an improvement in the anticipated lamb crop for this year.
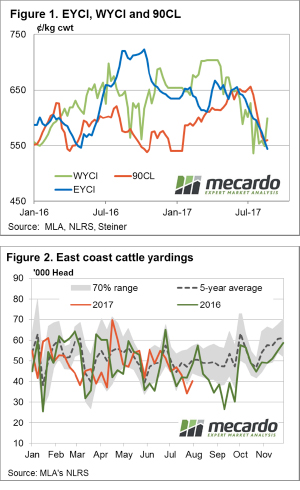
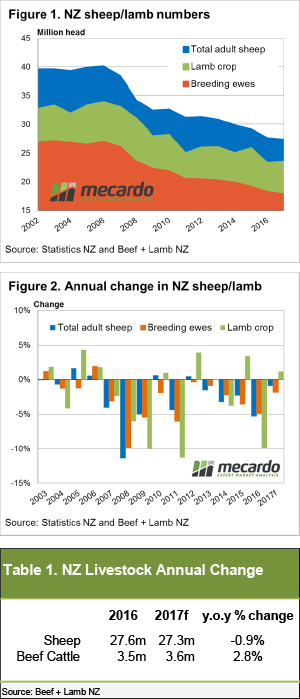
Figure 1 shows the decline in total sheep, breeding ewes and the annual lamb crop numbers since 2002, with a noticeable levelling off in the gradient of decline for total sheep during the 2016 to 2017 period, to see the NZ flock expected to finish the year at 27.3 million head.

Breeding ewe numbers mirroring the decline in the total sheep flock, posting a 1.9% fall from 2016 levels to see 17.8 million head recorded for 2017. Although, the total sheep flock has been given a boost by increasing trade and replacement ewe hoggets over the period to see a 1.7% lift in hoggets for 2017 to 8.7 million head. The net impact of reduced breeding ewes being offset by higher numbers of ewe hoggets being paired with rams and improved pasture availability, leading to improved ewe condition during the mating cycle, has seen an increase in the lamb crop of 1.1% anticipated this Spring to 23.5 million head.

The decreasing annual rate of decline in total sheep and breeding ewe numbers evident in figure 2, with the year on year percentage change from 2016 to 2017 pretty obvious. Indeed, for 2016 total lamb numbers declined 5.3% compared to a 0.9% drop expected for 2017. Similarly, the 4.9% fall in breeding ewes in 2016 has narrowed to a 1.9% decline anticipated for the current season. However, the biggest year on year improvement reserved for the lamb crop with a 9.9% decline in 2016 against a 1.1% rise forecast for 2017.

What does this mean?

The reduction in the rate of decline for sheep numbers in NZ isn’t robust enough to point to a return to favouring sheep/lamb production. Although, it is useful to keep an eye on how the industry is trending over there, particularly with reference to supply, as NZ are our only serious export competitor. Indeed, reduced NZ sheep production over the last decade has helped support overseas demand for the Australian product.

Declines in farm gate dairy prices over the last two years have seen the NZ dairy industry contract slightly, but remains NZ’s largest export sector and continues to fight for acres with sheep producers. Similarly, relatively high cattle prices and a favourable season is expected to see the NZ beef industry continue to expand into 2017 (Table 1) further hampering the ability for the NZ sheep industry to return to a significant expansion phase.

Rain helps support Victoria and WA

National Trade Steers holding up reasonably well this week, supported by price lifts in Queensland, as most other categories of cattle take the lead of the Eastern Young Cattle Indicator (EYCI) and continue to probe lower. Although, prices out West and in Victoria buck the trend as continued rain provides a bit of support.
Figure 1 highlights the 9.2% lift in the Western Young Cattle Indicator (WYCI), a solid recovery but not as strong as WA cows, with Heavy Cows up 12.7% to 188¢/kg lwt and Pastoral Cows posting a 26% increase to 110¢/kg lwt. In contrast, the EYCI continued its slide to shed 2.6% on the week to close at 543.5¢/kg cwt, while the 90CL frozen cow was largely unchanged at 559¢/kg CIF. National saleyard indicators all softer, with the exception of Trade Steers, posting a 1.1% gain to 568¢/kg cwt. The biggest falls in the national market reserved for Medium Cow and Heavy Steers, off 5.3% (393¢/kg cwt) and 4.6% (497¢/kg cwt), respectively.

A 17% lift in East Coast cattle yardings noted, although it must be noted coming off a fairly low base from last week, to see just over 40,000 head change hands – figure 2. Comparing the weekly cattle throughput figures on a state by state basis showing relatively higher yarding levels in Queensland persist, with figures here just 8% below the five-year average levels for this time of the season. In contrast, compared to their respective five-year average levels, NSW throughput is 20% under, Victorian yarding sits 36% below and SA is 40% below.

The week ahead

The rainfall distribution we have seen over the last few weeks continues again for the week ahead, with much of NSW and all of Queensland missing out, while Victoria and parts of WA continue to get a soaking. National cattle price movement likely to remain in a consolidation phase as softer prices in drier areas are offset by firmer prices for those regions enjoying some rainfall. The stabilisation of the 90CL in the last few weeks also likely to lend some support to the EYCI in the short term.

A plunge, a peak and a pretty happy market

Last week the market kicked off for the season with full force and we expected week 2 to be a little lacklustre in comparison. But no, the Australian Dollar plunged, the auction price peaked and those with the patience to hold on past the first week came out grinning.
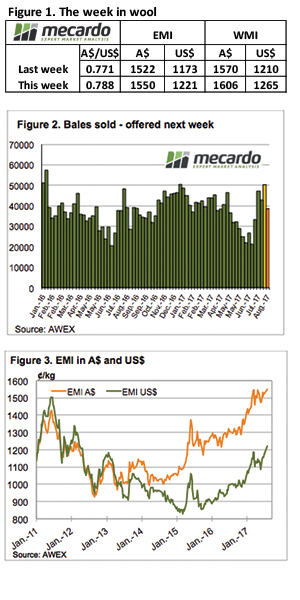
All forces lined up to lift prices right across the wool market. The EMI broke into the record books, rallying 64¢ for the week to an all-time high of 1614¢ in A$ terms. In the West, the indicator finished at 1680¢, up 74¢ (Figure 1). The record prices seen on the auction floor largely have movements in the Australian dollar to thank. Earlier in the week the dollar plunged down to the low 78US¢ region, hitting the lowest level we’ve seen in the last month. This encouraged strong demand on the export side with offshore buyers making the most of the low foreign conversion rate before the currency rallied again toward the weeks’ end. In US dollar terms, the EMI finished 60¢ higher, a substantial 28% gain on this time last year.

It was on Thursday that the market really jumped, with demand clearly exceeding supply. Pressure was particularly high in the 21 to 23-micron range in the East. The 21micron reaching 1668¢ in the North and 1663¢ in the South. Demand for fine wool broadened out between the Northern and Southern markets. 16.5 MPG saw a real win in the South, receiving a 118¢ rise on the week. This was only outshone by the 18.5 micron in the West which gained 120¢ to 2081¢.

As anticipated, volumes leveled down this week after the post recess splurge (Figure 2). 39,126 bales were offered up across the nation with just 2% pass in rate owing to the drop in supply since last week. To compare with this time last year, volumes being pushed out to market are still considerably higher.

Week Ahead

Anecdotal evidence from brokers is suggesting that demand at these levels might be a petering point for mid fibres wools, particularly with the A$ regaining some value again. The chance for similar magnitude gains as experienced this week is probably slim in the coming few weeks. Particularly so, if the Australian dollar remains around its current levels and slows down orders from overseas.

The offerings will continue to decline next week with Fremantle on break. Sydney and Melbourne are both selling but on a Tuesday and Wednesday roster due to Wool Week with 36,888 bales on offer.

USDA launches nuke, and brings the fire and fury

In the past week there has been significant posturing from both the Donald, and North Korea threatening to bring ‘fire and fury’ upon one another. It looks like the USDA might have fired the first salvo, with the release of the August WASDE report. In this week’s comment, we will look at what the fallout has been.
The World Agriculture Supply and Demand Estimates were released overnight. The reports in the middle of the year can provide some surprises, this is due to the fact that this period of time clarity is being achieved on the northern hemisphere market. This month’s report did not disappoint in that respect.

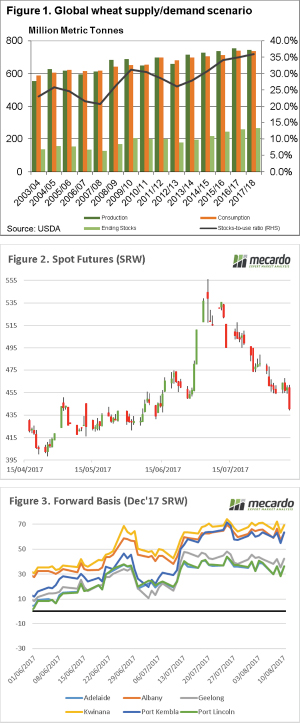
In articles in recent weeks, and presentations around the country I have commented that wheat quantity is not the biggest issue in the world. The main concern faced is quality, there are tightening stocks of high protein wheat around the world. This is reflected in the USDA report, which shows that wheat ending stocks for this year are to increase by 2% to 264.69mmt (Figure 1).

This is the highest world stock levels in history. Many may discount this number by the fact that China hold 48% of the world’s stocks. When we remove Chinese stocks, world stocks are still high. Since 1960, world stocks excluding China have only been higher in 8 seasons.

The report was more bearish than many commentators had expected, this has resulted in overnight prices diving (figure 2). In A$, the Chicago futures spot contract fell around $7, and have fallen A$55 since they mushroomed in late June/early July.

At a local level basis levels have remained somewhat stable over the past few weeks (figure 3) as buyers become reluctant to purchase at higher levels, and recent rains increase a small amount of confidence. Although there is still quite a way to go until harvest, and the crop could easily go either way.

Next Week/What does this mean?

The trade will be continuing to assess the impact of issues on the northern hemisphere, but as each week progresses more clarity is achieved and if nothing major happens upside (on low protein) is limited.

The key factor will be if Australia can achieve high protein wheat this harvest, and the rest of the world has a deficit then we are looking down the barrel of strong premiums. If the rain continues, and low proteins emerge from our crop then our prices and local basis will largely be driven by the domestic market.

China beef ban limited impact

Last week we wrote about how the increasing tariffs on US Beef entering Japan is expected to have a small positive impact on export beef, and cattle prices. Obviously the support hasn’t been strong enough to stop price falling, but is the China import ban causing the fall?
The China import ban is limited to six export beef plants, in Queensland, New South Wales and South Australia. While the reason for the bans seem rather trivial, the impact on individual plant is likely to be relatively severe. The bans were apparently due to mislabelling, with labels inside boxes not matching labels on the outside of the box.

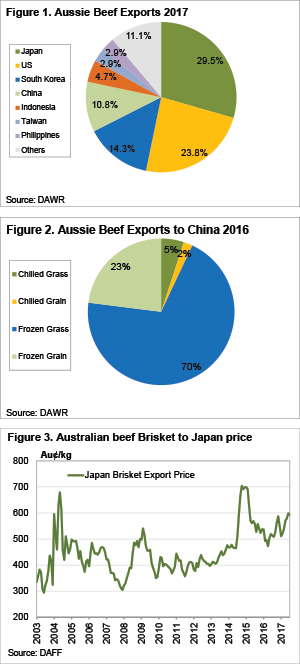
Regardless of the reason for the ban, any limitation of export to a particular market will result in weaker demand for beef, and stronger supply into other markets. Figure 1 shows that China is Australia’s fourth largest market for beef exports. It accounted for 10.8% of our exports for the first half of 2017.

If we take Australian domestic consumption into account, China receives 7.7% of Australian beef. There are currently 46 meatworks which can export beef to China, so there are still 40 works which can still send beef.

In terms of the type of beef, figure 2 shows that in 2016 a vast majority, 70% of Australian beef exported to China, was Frozen Grassfed; while Frozen Grain made up 23%. In terms of cuts, a wide variety is sent to China. According to MLA figures, ‘other’ was the largest category in 2016, accounting for 35% of exports. Brisket was the second largest category, making up 23% of Chinese exports.

As a comparison, in 2016 Australia sent 21,689 tonnes of Brisket to China. Japan took 42,381 tonnes of brisket in 2016, being the second largest cut exported there. Given the Japan tariff hike on US beef is likely to increase demand for Australian frozen briskets, there is likely to be some substitution from Chinese to Japanese markets.

Key points:

  • The Chinese ban on six Australian meatworks is yet to be resolved.
  • The proportion of Australian beef production impacted by the ban is relatively small.
  • Chinese beef imports from Australia are largely made up of grassfed beef, any impact will be felt at this end.

What does this mean?

Given the amount of beef which is likely to impacted by the Chinese ban on six meatworks, the effect on price at saleyard level is unlikely to be noticeable. Figure 3 shows the price of Frozen Briskets exported to Japan, which hit a two and half year high in July. While there are plenty of other factors which come into play with export beef prices, this is the series most likely to show how export issues are impacting the market.

Other comments:

Include here any additional information or specific comments to ensure successful upload by the web manager

Supply still all over the shop thanks to NSW

Some big moves again in East coast lamb and sheep yardings this week, heavily influenced by NSW flows, but for the most part prices around the country finished firmer. The headline, Eastern States Trade Lamb Indicator rising 1.3% to break back above 600¢ – although stronger gains were noted across other categories of lamb across the country.
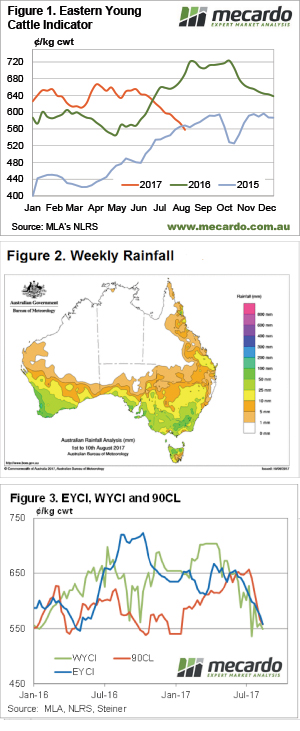
Figure 1 highlights the sharp rebound in lamb throughput at East coast saleyards this week, with a gain of 74% to see just shy of 165,000 head of lamb exchanged. The rebound driven by a surge in lamb throughput in NSW which posted a whopping 108% increase in numbers on the week. It is reasonable to argue that the size of the NSW gain is a bit distorted as the previous week’s numbers were much lower than normal, however the 138,000 head of NSW lamb throughput this week is still 37% above the five-year average for this time of the year.

A similar, but opposite story for sheep yardings along the Eastern seaboard. Figure 2 demonstrates the 33% decline in sheep throughput on the week to see 41,000 head at the sale yard, to see it pretty much in line with longer term average levels. NSW again the driving force behind the lower sheep numbers with a 67% decline noted here this week, although the 33,000-odd head reported still 30% above the five-year average in NSW for this time of the season.

The volatile supply figures did little to dampen most lamb and sheep prices though, with national categories showing Restocker Lambs the only category to post a decline on the week – down 5.3% to $75 per head, dragged down by an 18% drop in WA Restockers. National Merino’s, this week’s winner with an 8.5% rise to 564¢/kg cwt – boosted by strong gains to Merino Lambs in Victoria and SA, up 20% and 16%, respectively. National mutton stronger this week too, up 5.4% to 431¢/kg cwt, as a rebound in Victorian and NSW mutton prices assist the national indicator.

The week ahead

A softer $A, now below 79US¢, flowing through to higher export demand a good sign for the weeks ahead as live export wether prices post a 10.8% gain on the week to close at $140 per head. In other weather news, forecast rainfall for the week ahead shows some good falls to lamb rearing regions of the nation, with NSW the only state to miss out on falls above 5mm. Despite the dry patches in NSW the rainfall to the rest of the country should continue to be broadly supportive of prices in the short term.

This was a good price in 2015

The slide in cattle prices continued this week, with more help from lower export prices, pushing the EYCI back to two year lows for this time of year. Rainfall across NSW and Victoria doesn’t seem to have helped the cause yet, as supply continues to outweigh demand.
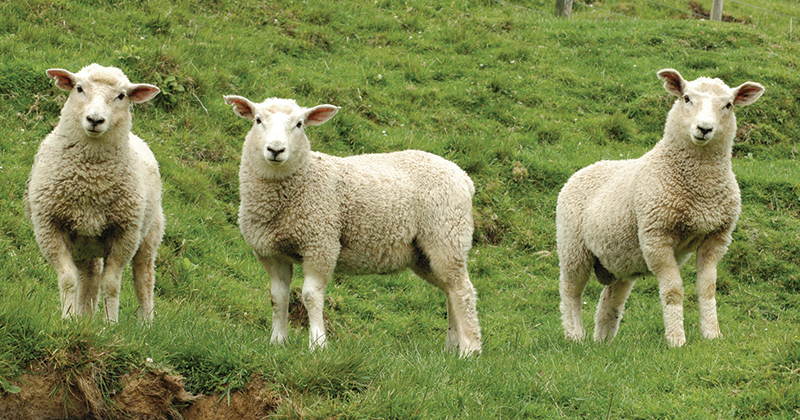
After only recently falling below 2016 levels, the Eastern Young Cattle Indicator (EYCI) this week eased below 2015 levels. The two year low puts the EYCI a very large 134¢, or 19% below the levels of this time last year.

Obviously when the EYCI reached 560¢ back in July 2016, it was happy days for cattle producers. This year prices are still ok, but given they have fallen 14% in 12 weeks, at a time of year when they normally rise, has taken the market by surprise.

There was also some decent rainfall around this week, and for August to date (figure 2). This hasn’t at all translated into any demand, as young cattle prices continue to ease even though yardings haven’t been anything extraordinary.

The 90CL price continued to fall this week, losing a further 10¢ in AUD terms. This is no doubt helping to drag cattle prices lower, as it’s now also lost 14% in 12 weeks. Weakening demand for 90CL beef in the US is apparently the driver, with foodservice not doing so well.

Positives in the cattle market were hard to find this week. The National Heavy Steer Indicator gained 15¢ to move back to 521¢/kg cwt. This was despite the Queensland indicator sitting at 494¢, and there being no quote from any other state.

The week ahead

We are still waiting for cattle prices to find a floor after this very abnormal decline. It’s hard to know if the market will experience a normal spring decline from there, or whether there will be some rain and a subsequent price rise.

Despite the falls in the 90CL export price, there is a little room for upside, especially if the Aussie dollar does the right thing, and it rains.

Away we go, wool bounds out of the blocks

The three-week recess seemed to create pent up demand from the processors, with the larger offering and stronger A$ unable to dampen competition – the wool market had a good week. AWEX reported that buyers were bidding strongly from the outset to fill orders secured over the break.

As Mecardo reported in the last sale report prior to the market recess, demand is good and with growers seemingly selling as soon as wool hits the stores any improving demand will construe to create increased competition on the auction floor. This theme certainly continued this week.

The EMI rallied A$0.28, the WMI improved A$0.36 while in US$ terms the EMI increase of US$0.48 was significant.

While all MPG’s improved, it was the 19.5 MPG and broader that performed strongest including X Bred types. The 28 MPG is back above 800 cents for the first time in 12 months while it was September last year when the 30 MPG closed above the current 614 cents.

This strong auction market translated into strong bidding on the Wool Forward market with growers stepping in to secure good forward cover for the remainder of 2017, and trades secured into 2018.

With a larger offering (on top of a big offering pre-recess) and a season low pass-in rate of 3.9% (season average 6.3%), 50,300 bales were cleared to the trade. This is an outstanding result compared to recent sales patterns; the last time 50k bales were sold was in December 2016, and then you need to go back to January 2016 to see more than this number sold.

There was one negative in the market; the cardings indicators in all centres retreated against the general market trend to post. A small offering in Fremantle held the market steady, however in Sydney & Melbourne the Carding indicator lost 40 & 23 cents respectively.

The week ahead

The result this week gives confidence for the week ahead, and with the A$ seemingly having peaked we should see another strong result with all centres selling.

The smaller offering is a portent of things to come with less than 40k bales rostered per week over the next three weeks; this should assist the market to at least retain current levels.