Tag: article

Is it the return of the Wagyu or did the EYCI strike back?

On international Star Wars day last year (May the 4th be with you) the Mecardo team took a look at Wagyu spreads to the Eastern Young Cattle Indicator (EYCI) and a recent subscriber request for a follow up article prompted us to have another look at how the 2017 season played out… and besides we couldn’t resist the chance for another pun in the heading!
Recap on the original “May the force be Wagyu” analysis here.

Figure 1 shows the monthly average price series for F1 Wagyu Steers, along with the monthly average EYCI since mid-2015. A cursory glance at the chart demonstrates that Wagyu prices have declined in line with the general correction in young cattle prices over the 2017 season.

However, a breakdown of the quarterly average price changes for the two series highlights that the main price gains occurred during the third quarter of 2016, with the EYCI up 19.7% and the F1 Wagyu Steer up 14.9% – figure 2. Similarly, the majority of the price correction occurred during the third quarter of 2017 with the EYCI down 13.6%, while Wagyu Steers came off 9.8%. Although, measuring from their respective peaks to troughs on a quarterly basis over the 2016/17 season shows that the EYCI has dropped 18.4% compared to the Wagyu Steer’s decline of 19.9%.

Correlation analysis of Wagyu Steer to EYCI quarterly price changes indicates a fairly strong relationship between the two price series with an R2 observed of 0.8181** – figure 3. Interestingly, as identified by the colour coded markers for each season, much of the 2016 Wagyu quarterly returns performed above the line of best fit, suggesting a relatively good season for Wagyu prices compared to the respective EYCI movements.

In contrast, the 2017 season has seen Wagyu quarterly returns gathering below the line of best fit, indicative of a somewhat poorer season compared to the EYCI quarterly returns. Perhaps the anecdotal reports of growing interest in Wagyu has led to an increase in supply, causing a narrowing of the Wagyu premium during the 2017 season.

What does it mean?:

Analysis of monthly sales volumes for Wagyu doesn’t demonstrate any particular pattern of expansion – figure 4. Although, there appears to have been a slight increase in the quarterly average volumes (black dotted line) during the middle of 2017 it isn’t significant enough to have caused a poorer season for Wagyu over the year. Indeed, for all of the second half of 2017 the quarterly average volumes remained below the long-term average (orange line).

A look at the percentage spread premium of Wagyu Steers to the EYCI over the last few years shows that while the 2017 season was characterised by narrower premiums than in 2016, with the annual average premium coming in at 78% for 2017 compared to 85% for 2016, much of the monthly movement in the premium spread for 2017 was spent within the normal historic range between 75-100%. So, the EYCI strikes back – but only marginally.

Limited wet in North brings forward supply

Weekly supply statistics showed a fairly normal pattern for the start of the season, with East coast figures hovering near to the longer term seasonal averages. Although Queensland and NSW throughput were slightly elevated for this time in the year as the Northern wet season continues to be delayed, weighing on prices.
A fancy animated chart shows the lack of rainfall that has impacted Queensland and NSW producers over the last fortnight, with higher than average weekly cattle throughput figures in these two regions noted as the dry conditions encourage supply.

Indeed, weekly cattle throughput in Queensland is running nearly 30% higher than the five-year average for this time in the season and NSW throughput isn’t far behind, with 11% higher yarding levels.

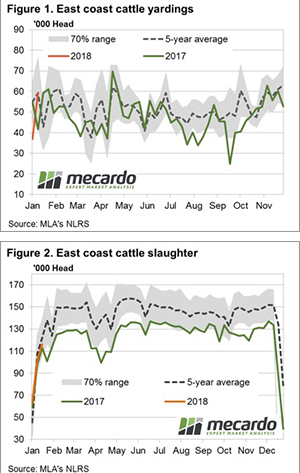
However, lower than usual throughput in the remaining East coast states has seen the total East coast throughput sit nearer to the average seasonal levels, according to the five-year average pattern, with just over 59,000 head recorded this week – figure 1.

Weekly East coast slaughter volumes remains close to normal, 3% higher than this week in 2016 and 4.5% below the five-year average seasonal pattern – figure 2.

What does it mean/next week?:

The benchmark Eastern Young Cattle Indicator (EYCI) off 3.8% to 531.25¢/kg cwt in a move broadly mirrored by the national sale yard indicators last week. Heavy steers registering a 3.1% drop to 255.2¢/kg lwt. Restocker Steers one of the few categories to score a gain, up 2.2% to close at 334¢/kg lwt.

A bit surprising to see Restocker steers performing so well given the recent lack of Northern rain. Looking to the forecast Central Queensland not expected to get much moisture into the week ahead so don’t expect young cattle prices to rebound too much in the short term.

Charts:

Rainfall animation to be included as first graphic (file saved in Mecardo/charts directory see link)

Wheat and Bitcoin.

The markets have been very quiet over the past week, with little in the way of new information to get the trade excited. Usually in our Friday comments, we would take a look at the past week. This week, I thought I would take a quick review of the past two years.

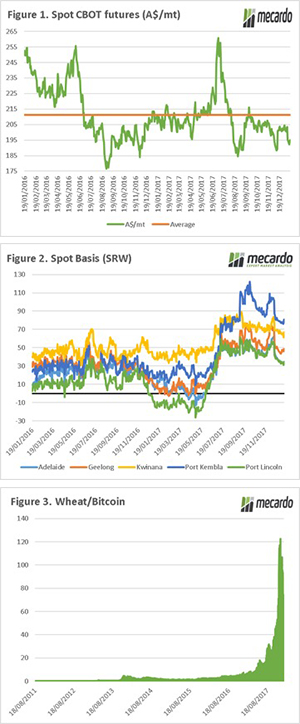
In figure 1, the Chicago spot wheat futures, converted to A$ has been plotted. The past two years has not been pretty, the average price in this period has been a meagre A$211/mt. The futures price makes up the bulk of our price in Australia, we have a very low floor with which our local premiums can contribute to.

The basis is our premium or discount between the physical and futures market, and typically we compare Australian prices to Chicago futures, but it can be against any other pricing point. Basis is important as it can help substantially to increase the prices that we receive locally.

In figure 2, we can see the basis between APW1 and Chicago futures. As we can see, for the bulk of the past two years levels have been at a premium, with a short period of time where SA has experienced negative levels.

This season we can see that basis levels have been extremely strong since seeding. This is due to the weather risk, and then the realization that the Australian crop was going to end up below average. This basis has helped push up localphysical prices to provide a much stronger return for growers.

What is important to remember is that basis levels are largely driven by supply (or lack of), and if Australia had produced an ample harvest, then our basis levels would have been much lower, in combination with a period of low futures prices.

You would have to be living under a rock, if you hadn’t heard about the stratospheric rise of bitcoin. Although of little analytical benefit, I thought this was quite interesting to look over time at how many tonnes of wheat that you can buy for 1 bitcoin. This is displayed in figure 3, in mid-December a bitcoin could get you 122mt on the Chicago futures market, today it will get you 73mt.

What does it mean/next week?:

The market is likely to be quite dull in the coming weeks. There now seems to be less concern about the northern hemisphere crop, and every week that flows without an issue removes risk.

It sounds bad, but we need a supply issue to our fellow farmers in the north. We can’t rely too heavily on basis to make us profitable.

Bring out your lamb, bring out your sheep..

Producers responded to the robust lamb and sheep prices on offer early in the New Year with some huge throughput figures this week noted across sale yards, particularly in Victoria and NSW. The effect of the added supply weighing on prices across the board.

The benchmark Eastern States Trade Lamb Indicator (ESTLI) softening 7.6% over the week to see it close yesterday at 632¢/kg cwt. Despite the large weekly decline the ESTLI is still sitting 2.7% above where it was this time last season, so its not all bad news for producers.

Most eastern states categories of lamb and mutton followed the ESTLI lower with falls ranging between 5-15%. National Mutton posting a similar magnitude decline to the ESTLI with a 7.8% drop to 424¢. WA Trade Lamb one of the few categories to buck the trend with a 4% lift to 672¢.

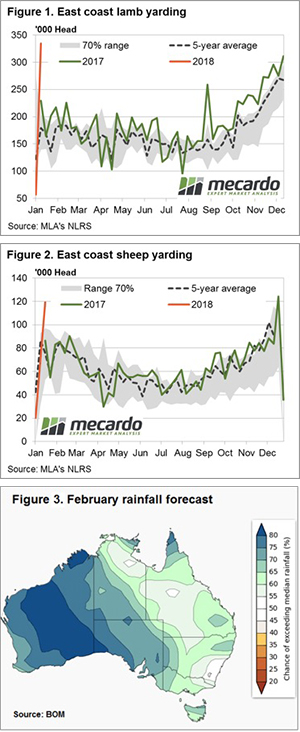
Figures 1 and 2 highlight the key reason for the broad correction this week, with both lamb and sheep throughput opening the season in a very strong fashion.

East coast lamb yarding was just shy of 335,000 head, boosted by strong Victorian and NSW throughput, to see it sitting at levels 86% higher than the five-year average for this time in January.  There was a similar story for mutton, with East coast yarding figures knocking on the door of 120,000 head, which reflects a 37% higher yarding level than the five-year average.

What does it mean/next week?:

Its hard to see yardings sustained at these levels into next week so further price pressure is less likely. Much of the rainfall next week is reserved for the far north, well away from sheep and lamb districts, with only 10-15 mm on the cards for parts of NSW, Victoria and WA.

The most recent release of Bureau of Meteorology rainfall forecast for February points to a much wetter WA, SA and Western Victoria/NSW – figure 3. The likelihood of this rainfall being just around the corner could provide some price support to lamb and sheep prices into the end of January.

All the data is in

For the first time in over a month we have the full suite of Meat and Livestock Australia (MLA) data to analyse. Even with all the data, the conclusions look the same. Markets are easing slightly thanks to a lack of moisture and a rising Aussie dollar.
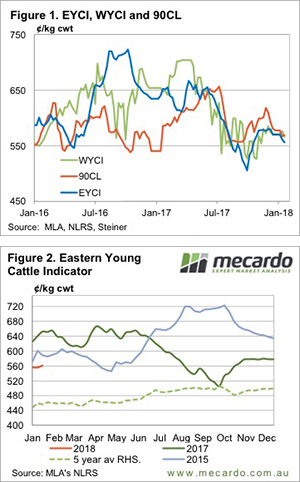
We haven’t seen a quote for the 90CL Frozen Cow export price since mid-December, but the January numbers came in this week. The story for export prices are similar to those for most cattle prices. The 90CL opened the year slightly easier, down 10¢ in our terms before a slight lift this week to 569¢/kg swt.

In US terms, 90CL prices have gained a little ground on weaker supplies out of Australia and New Zealand, thanks to lower slaughter. In our terms prices are weaker, with the Aussie dollar trading well over 79US and thinking about breaking the solid resistance at 80¢.

The eastern and western young cattle indicators are almost in lockstep with the 90CL, but as we outlined in the cattle analysis this week, it was only a year ago that young cattle prices were trading at significant premiums to the 90CL. Widespread rainfall might see somewhat of a repeat, but not at levels of 100¢ which we saw last January.

We went looking for some seasonality in the EYCI to guide us to where the market might be headed. But as figure 2 shows there isn’t much to speak of in the last two years, nor on the five year average. We used to see cattle prices rising from January to March, but this is going to require some rainfall.

The week ahead

With no rain on the forecast, expect prices in general to continue to track sideways or slightly lower. There appears to be little in the way of external factors which are going to see prices rise in the absence of rain.  There is however, mounting evidence in international meat markets pointing towards another year of downward trends, even if we do see a moisture induced late summer rally.

A good chance of rain means what for prices?

A truck driver asked me when we were going to sell some heavy steers that we have wandering around on some still green country. My flippant response was, ‘when it rains in Queensland and the price goes up’. I then thought I’d better do the numbers and make sure this was a better than 50/50 chance of happening.
Cattle prices have been waning early in 2018. Little to no rainfall in some key northern cattle areas since before Christmas, cattle supply has opened up relatively strong, and demand from restockers weak.

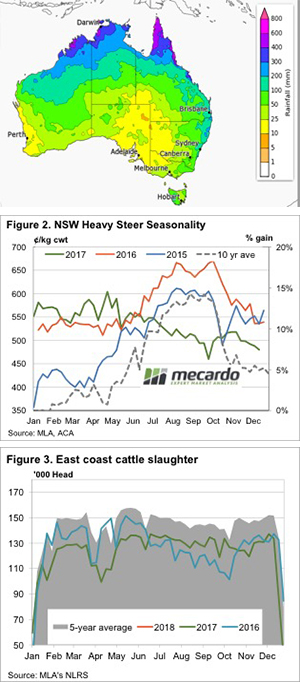
The latest Bureau of Meteorology (BOM) shows a good chance of above median rainfall over the next three months. But what does this mean? Another map produced by the BOM is shown in figure 1 which gives more of an idea of how much rain an area might expect in February.

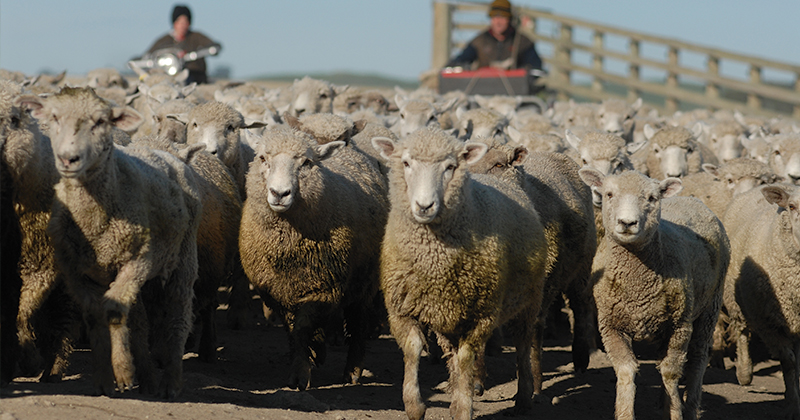
Much of Northern NSW and Queensland have a 50% chance of receiving more than 50mm of rain. Even better, there is a 25% chance of most of Queensland getting 100mm or more. The last time we saw good early year rain was in 2015, and figure 2 shows what that did to heavy steer prices.

The situation is a little different now. Back in early 2015 cattle in Australia were heavily under-priced compared to the export market. At the moment cattle prices are close to fair value relative to export prices.  However, as we saw this time last year, tight supply can see cattle values well above where export prices suggest they should be.

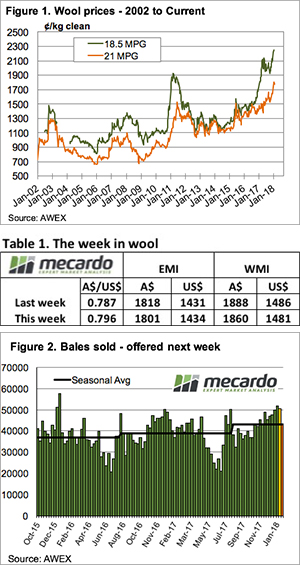
Whether supply will tighten is a tricky one. We know there is a lot of cattle on feed bolstering finished cattle numbers, but many of these cattle would have been drawn from a pool which is normally finished on grass. Figure 3 shows that spring slaughter in 2017 was higher than 2016, but that could have also been catching up from weak autumn slaughter (figure 3).

It’s hard to see cattle slaughter being any weaker than 2017 in the early part of the year, but it doesn’t need to be to see prices rise. East coast slaughter around 130,000-140,000 head per week should be enough to push prices higher.

Key points:

  • The BOM are forecasting a good chance of better than median rainfall in Northern NSW and Queensland from February to April.
  • Historically cattle prices track sideways to higher early in the year, with good rains giving a boost to the upside.
  • Cattle supply is likely to be stronger than 2017 early this year, but prices could still push higher.

What does this mean?

While rain doesn’t limit the number of heavy slaughter cattle which will come to market, it can see the supply of young cattle and cows tighten, which increases demand for cattle which can fill slaughter space. Hence heavy cattle prices can rise with rainfall.

Without significant rainfall, all cattle prices are likely to continue to drift lower, and consistent supply is net with easing restocker demand. This results in processors facing less competition for all cattle, and lower prices.

Buyers bid up for best style.

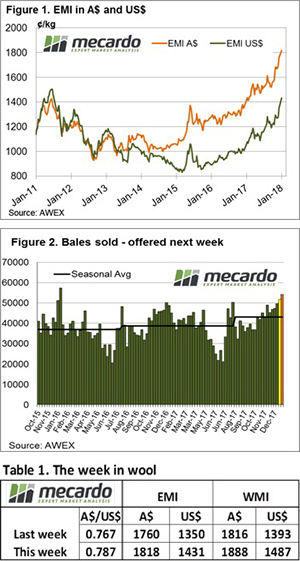
The wool market bubbled along at the higher rates reached last week, however, AWEX reported that this week buyers reverted to a more selective approach, in contrast to the past couple of sales where faults were overlooked.
Wool that exhibited good measurements & style (high tensile strength & low mid breaks) once again attracted strong bidding albeit on a limited supply.

The AU$ improved another US$0.01 over the week, this weighed on the buyer bids with the EMI losing AU$0.17 cents but gaining US$0.03 for the week underpinning the strong market sentiment. W.A. fell also with the WMI giving back 28 cents, closing the week at 1860 cents.

The exception to the general across the board falls were the fine microns, with Sydney & Melbourne for example posting gains for the 17 MPG of 37 & 16 cents respectively.

An interesting note is that in Sydney at the halfway mark of day one of selling, zero fleece lots had been passed in; a recognition by sellers that these are good prices to be taken up.

The Skirtings section tracked a similar path to the fleece, although low VM lots were quoted as stronger, especially for 18.5 micron and finer. This is a continuation of the theme that has been building in recent months; with the market at very high levels the discounts for secondary types such as tender fleece and skirtings fade away. This week the selective approach by buyers returned.

The result was that again best style wool was keenly sought while faulty types were quickly discounted.

As outlined in Mecardo analysis this week, the merino pieces price follows the general story of the faulty type and is some 600 cents above the 2001 levels, while the 18 micron locks price is some 150% up on the 2001 level.

Positive news from the cotton market emerged this week, India is responding to supply concerns by reducing exports which is expected to improve the prospects of US prices. The cotton market has been rising strongly and this week is just shy of its 8-month high point.

This week Mecardo had a look at the wool production estimate on the back of the Australian Wool Production Forecasting Committee report. Sheep offtake rate continues to be supportive of an increase in sheep numbers, with flock modelling pointing to an increase in the flock size in 2018-2019, due to the high wool prices in relation to the wheat price.

However, the projected rise in sheep numbers is only a modest 2.6% next season.

The week ahead

Based on previous wool producer responses, any reduction in price levels will see the pass-in rate jump; growers have been bullish over recent times and are prepared to hold wool back in this market of “just in time” supply.

Along with strong demand, the limited supply of fresh wool combined with wool grower’s optimism the market is unlikely to retrace any time soon.

Next week 43,297 bales are rostered for sale across the three selling centres. It is of note that 50,499 bales were cleared to the trade this week.

Record start to the year for lambs

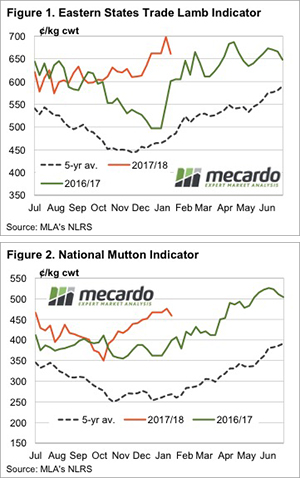
Lamb prices opened the year at record highs, but on relatively small volumes.  As supplies ramped up with a full week of selling we saw indicators weaken, but they remain very strong, and at records for this time of year.

The first published Eastern States Trade Lamb Indicator came out on Monday at an extraordinary record of 698¢/kg cwt.  As the week progressed, prices cheapened, lamb indicators back in to line with the 2017 ending values.
It was this week last year than lamb prices moved, which means that the current ESTLI is now ‘only’ 10% above the same time last year.  It will be interesting to see where lamb prices head from here.  The TFI shutdown is likely to have some say in this week’s lower values, and it comes as a critical peak demand period.  They are hoping to open again at Murray Bridge towards the end of the month, but this will be too late for Australia day demand.

Figure 2 shows mutton values also rallied, but not as far as lamb, and they also fell, edging below the end of December prices.  As outlined in this week’s article on Chinese lamb exports, they continued to drive demand in December.  It looks like this might be continuing into 2018, and this is good news, especially when Murray Bridge is killing again.

Restockers continue to pay up for lambs, although late this week they got some cheaper lambs, which might turn out to be good value if supply tightens.  We saw last week how strong prices can get.

The week ahead

The question for the market is whether the lower prices of this week will see lamb supply weaken.  The supply of well finished woolly lambs is dwindling with feed supplies and older lambs will start to make the running, and many of these might not be ready yet.  We might see the market have a bit of a spike next week.

New Year market continues positively

The break in wool sales over the Christmas period proved positive with the opening sale of 2018 pushing higher across all Merino and fine X Bred types.

Buyers were able to secure new orders over the Christmas break, and also digest the potential of reduced supply in coming months.

Of concern to exporters was year on year tested volumes as reported by AWTA showing December Merino volume was down 20% compared to 2017.

This pushed the EMI to a new high of 1818 cents, adding 58 cents for the week on top of the 405-cent gain in 2017.

Despite the Au$ improving US$0.02 over the break, the EMI jumped 82 US cents for the week underpinning the strong market sentiment. W.A. didn’t miss out either with the WMI lifting 72 cents, closing the week at 1888 cents.

If there is one potential concern on the horizon it is the relationship of wool prices to competitive fibres. Traditionally a 3 : 1 ratio to the cotton price was seen as comfortable. This ratio today is closer to 8 : 1 although as Mecardo reported this week the ground rules have changed. The price ratio is closely related to supply, and with supply unlikely to increase any time soon this risk is minimal.

It was noted that while the high ratio can be supported based on supply of wool as a percentage of cotton production, volatility is still possible. This should encourage wool producers to continue to sell asap, and to consider hedging future clips at record income levels.

In 2017 Cardings “outperformed”, posting a 32% gain for the year to end at almost 1500 cents, however this was no barrier to further increases this week 60 – 75 cent increases achieved.

As we have previously reported, broker’s stores have record low grower stocks, and with growers clearing out wool sheds to get wool into sales to capitalise on the record prices, the supply side has little ability to respond with increased bales to meet demand.

The week ahead

The market heads into 2018 with confidence, reduced supply and increased demand appear to be the underpinning sentiments which bodes well for sellers.

Next week 54,250 bales will be offered in the three selling centres..

Defer grain pricing: More than one way to skin a cat.

At this time of year, those lucky to have grain on hand will now be deciding whether it is best to sell their grain or hold on for higher prices. There are many ways of deferring pricing, and give exposure to the market at a later date. This short article will provide summaries of easily accessible options.

Storing to sell

Exposure: Basis & Futures

The obvious option for deferring pricing is to hold onto your grain and sell at a later date. This can be carried out either through central storage or through your own on-farm storage system.

Key considerations:

  • Remember to calculate your storage costs and interest charges if storing in the system, this amount has to be recouped to make it worthwhile.
  • Place a realistic price on your time, capital, fumigation and interest when storing on farm.
  • Whether your on-farm storage is in a good enough condition to make it to the targeted sales timeframe.

No Price Established contract (NPE)

Exposure: Basis & Futures

 The NPE contract comes under a number of different product names through different providers, however all perform the same function. The purpose of the contract is to provide traders access to grain, when the grower doesn’t like the price. The grower is then given a predetermined timeframe in which to secure their price.

Key considerations:

  • Check what the product fee is.
  • Is there an advance?
  • Check how the pricing is established. What is the methodology if the trader is lower than the market?
  • Do not use an NPE if the contract is only based on the trader’s price.
  • Maintain a close eye, and remember that it is a time-based contract.
  • Check whether storage and handling fees still apply.

More in depth information:
http://blog.mecardo.com.au/grain-canola-npe-contracts-the-simple-facts

Cash and Call

Exposure: Futures

The cash and call strategy involves the use of derivatives, but is not particularly complicated (guide on link below), and can be transacted through most banks or through a broker. The cash and call strategy is suitable when basis levels are strong, and futures are low. At its simplest, the grower sells his physical grain and then takes out a call option, which provides a benefit if the futures market increases in value.

The call option works in a similar way to an insurance, where the grower has a known worst-case scenario, in exchange for paying a premium.

In the Cash and Call strategy, the grower has a known cost (Premium) and for this cost has exposure to future favourable price increases. If the market price of the Call Option does not increase, only the Premium is lost.

Key considerations:

  • Is the market structure favouring removing basis exposure, whilst retaining futures potential?
  • Does your bank have the capacity to offer these instruments?
  • There are no further storage costs in this strategy.
  • The market has to climb higher than the premium to provide a positive pay-off.
  • The premium will change dependent upon time, and strike price.
  • There are some pool providers offering managed products which are based solely on the cash and call strategy.


More details:
http://blog.mecardo.com.au/i-dont-like-the-grain-price-but-i-need-the-cash


Buying a swap/futures contract

Exposure: Futures

The traditional method of utilizing a swap, would be to sell a swap prior to harvest to lock in a futures price, and then unwind the swap by buying back the swap from the bank at or near harvest. Although not common practice amongst farmers, it is possible to buy a swap/future contract.

It is possible with many banks to turn it around and instead of selling a wheat swap, buy a wheat swap. Let’s say for instance the current basis levels were high, and futures were low. It would be possible to sell your physical grain and lock in the basis, at the same time as buying a wheat swap.

The buying of the swap would give an exposure to the futures market. Therefore, if the futures market rallied you would participate in any upside. In an ideal world you would then close out your swap position when you had reached your target price, and with the addition of the basis already captured, would be your overall price.

Key considerations:

  • Is the market structure favouring removing basis exposure, whilst retaining futures potential?
  • There are no further storage costs in this strategy.
  • Some banks will not allow a grower to buy a swap, and those that do will likely want to see a physical sale contract. This is to ensure that the instrument is being used as a hedge and not for speculative activity.
  • A direct futures contract with the exchange will be cheaper but has the potential for margin calls.
  • Should the market fall further after the swap is taken this strategy has the possibility of loss, further eroding the final overall price.

More details:

http://www.mecardo.com.au/commodities/analysis/turn-grain-swaps-around.aspx

Pools

Exposure: Dependent on pool strategy

Prior to 2008, wheat pools were the primary marketing route for the Australian growers. This has changed dramatically and <30% would be expected to be marketed through managed programs. The breadth of providers and products has however ballooned to fight over the remaining pool participants.

At its most basic, the pool is a product where growers provide a manager with tonnage with the expectation that they will manage this to provide a better return than they could achieve themselves. Typically, an unpriced scheme or product would be considered a financial product and require an Australian Financial Services Licence (AFSL), however an exemption for grain pool has been extended by ASIC.

What to keep in mind when selecting a pool:

  • Does the pool strategy meet your requirements and your own view of the market?
  • Do you think the pool provider has the experience to operate the pool?
  • Does the pool provider have an AFSL? This gives an indication that the provider must take compliance extremely seriously.
  • What are the payment schemes, and how do they work with your taxation and cash flow requirements?
  • Pool providers put together some flash marketing, ignore this.
  • Check past history, but remember that past performance is not an indicator of future performance.