Tag: article

The dollar discount.

It must be hard being a currency forecaster, because they rarely seem to get it right. In this weeks grain market commentary we take a look at futures, currency and basis.

The futures market has provided somewhat of a price recovery since the middle of December, when the spot contract switched to the March delivery. In figure 1, I have produced a fancy animation to show both the futures in ¢/bu and A$/mt. The futures contract has made a steady rise (up %), however when converted into A$, we can see that prices have largely gone sideways.

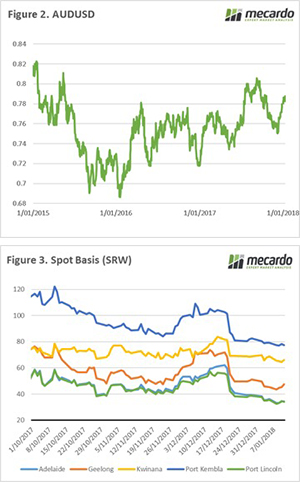
This lack of upward movement is because of an appreciating Australian dollar, this can be seen in figure 2. This has been caused by the recent release of bearish US CPI figures, pointing to the delay of interest rate hikes there, and some stronger economic data out of Australia in the form of improved employment figures and robust retail spending in the lead up to Xmas.

Basis levels have stayed relatively stable during the first two weeks of January, however basis remains on a tight balance. Will a strong finish to sorghum drop feed grain demand, or will the ABS downgrade to the 16/17 crop and resulting fall in carry give a floor to pricing?

Please note this comment was produced last night, and will not consider any changes overnight.

Next week

The WASDE report will be due overnight, along with US planting numbers. It is doubtful that we will see much to sway the markets, but I will keep an eye and if anything interesting comes up, I will report on Tuesday.

The year for cattle

The majority of saleyards have reopened now to start the 2018 season and while there is limited reporting of state by state cattle categories undertaken by Meat and Livestock Australia this week there is enough in the major saleyard reports to kick off the Friday market comments for the new year.

Most MLA saleyard reports indicate that young cattle were the dominant volume with lotfeeder and restocker activity fairly prevalent. Many saleyards did not have the full compliment of processor and export buyers in attendance and both quality of stock present and price movement reported as being fairly mixed.

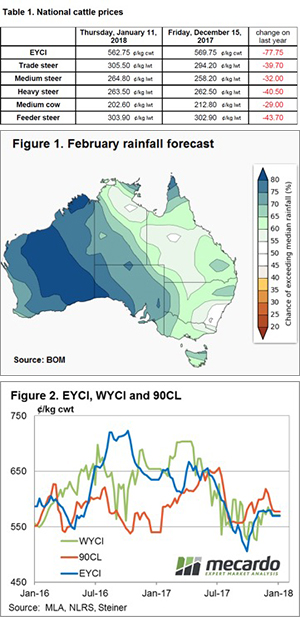
A look at the national price results for the week, compared to last years closing prices and the change from opening prices in January 2017 are displayed in Table 1. The mixed price results from the sale yard reports are reflected in the price movements from last year’s close to this week’s opening prices with the EYCI slightly softer at 562.75¢/kg cwt, a decline of 1.2%. Trade, Medium, Heavy and Feeder steers have all lifted, with Trade Steers leading the gains – up 3.8% from the December close. National Medium Cows the clear laggard posting a 4.7% drop to close this week at 202.6¢/kg lwt.

The Bureau of Meteorology (BOM) are now updating their three-month outlook twice a month with the “first look” being released yesterday for the February to April period. The weak La Nina and recent warm waters around much of the nation responsible for anticipated increased moisture to much of the West and parts of the far North and mid-East for the February period – figure 1.

EYCI, 90CL and WYCI markets now back in sync after wide variation in prices from this time last year – figure 2. Indeed, these three markets are now within 15¢ of each other compared to January 2017 were the price variance between the three categories was in excess of 100¢, with the 90CL heavily discounted at the time.

The week ahead

Table 1 highlights that the cattle market has opened the 2018 season slightly weaker compared to last season, although not significantly so, with the EYCI 12% lower and Heavy Steers off 13%. Historically, the performance of the cattle market over January can be a good predictor to how the season fares over the year and early signs point to a relatively stable, albeit mixed start.

The prospect of some decent rainfall into February may lend some support into the later part of January but there are some dark clouds in the form of a higher A$ and the likelihood of softening beef export prices that could keep any significant gains under wraps.

New year, new opportunities.

Dawn has broken on 2018. The start of a new year brings fresh possibilities, and a few positive signals have started to appear in the market. In the zodiac calendar 2018 is the year of the dog, let’s hope that its wrong and we are in the year of the wheat bull.

So far in 2018 the wheat futures market has shown some positive signs. In US¢/bu. Chicago futures (figure 1) have gained 3% since boxing day, although the A$ has removed most of the shine from the rise. The market is currently starting to price in weather risk into the US winter wheat crop, after a series of cold weather events is likely to have caused some damage since inadequate snow cover was in place.

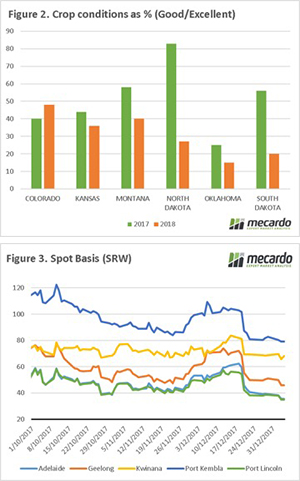
These weather events come on the back of a USDA crop progress which is particularly bullish (figure 2). This chart shows the current percentage of the crop rated as good to excellent. As we can see, with the exception of Colorado, all states are showing substantial year on year reductions in the good to excellent category. It has to be taken into account that this rating was determined prior to the cold snap, and it is liable to be downgraded further.

At a local level, after relatively lacklustre grower selling throughout, harvest sales were more forthcoming between Christmas and New Year. This increased selling pace has led to a depreciation in basis levels (versus Chicago). In figure 3, we can see the extent of the fall in basis since just prior to Christmas, which was largely inevitable and was discussed in following articles:

Lock in premiums, keep exposure to the market

Wheat seasonality: Imitation is the sincerest form of flattery

Let’s look back at historical basis

It remains to be seen whether basis levels will improve as the festive season draws to a close. At present most businesses are still operating at relatively low levels, with many not returning until the 8th January.

Next Week

The market will continue to examine weather risks due to cold and la nina in the northern hemisphere. I don’t expect big jumps in the coming week with the exception of potentially speculatively driving rallies.

It will be interesting to see the direction that basis takes this week; will grower selling pace result in further falls or will more buyers come to the table and drive it north?

Little data around but it’s all down for cattle.

Cattle sales were thin and far between this week, with only a few saleyards operating.  The Thomas Foods International (TFI) fire won’t have as big an impact on cattle as it will on sheep, but we’ve already seen reports of weaker prices in the face of the uncertainty.

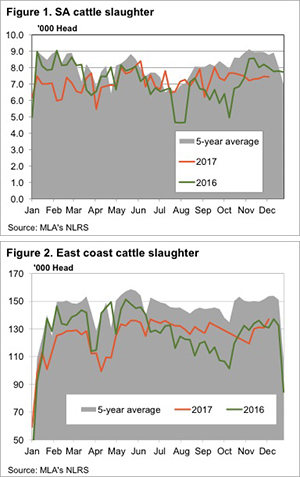
According to a report in ‘The Land’ last November TFI kill around 5,000 head of cattle per week at Murray Bridge. While this is a very large, 65-70% of MLA’s reported weekly kill for South Australia (figure 1), it accounts for just under 4% of east coast slaughter (figure 2).

With total slaughter back so far from the highs of the first half of 2016, TFI are likely to get their cattle slaughtered elsewhere to continue to supply customers. Basically, it seems unlikely that the cattle which now can’t be killed at TFI are going to flood into other markets and depress prices in general.

For those selling cattle at weaner sales in SA and Victoria the timing of the fire is not great. Uncertainty has been blamed in one report for weaners making 10-20¢ less than pre-Christmas sales. Still, prices of 300-335¢/kg cwt for 350kg calves is still good money.

While there has been a bit of rain about over the break, it wasn’t enough to see a lift in the couple of prime markets which were held this week. Casino and Dubbo both quoted prices down around 10¢/kg lwt across the board, but numbers were very limited.

The week ahead

There’s not a lot of rain on the forecast, and the Australian dollar has been rising, back up to 78¢. Both these fundamentals are bad news for cattle prices, as is the uncertainty created by the TFI fire. For better news, we can look to export markets, where demand traditionally picks up a bit in January, but this may take a few weeks to filter through.

Lamb markets open hot, metaphorically and literally

For the first week in January there was certainly some big news this week.  On Wednesday the biggest lamb market in the country at the moment opened even higher than the very strong close.  And on Wednesday night one of the country’s largest lamb processors had a fire.

At the Hamilton Lamb sale on Wednesday lamb prices gained a bit more ground, after having rallied strongly in December. This week’s rise was in the order of 20¢ for ‘young lambs’ (figure 1). More shorn lambs will start to hit the yards over the coming weeks, but young lambs are still the majority of this market.

This early sale might have producers deciding to sell whatever was left, but the fire at Thomas Foods International (TFI) on Wednesday has thrown a massive black swan into the works.

In an article in ‘The Land’ back in November TFI were quoted as killing 55,000 sheep and lamb at Murray Bridge per week. Figures 2 and 3 show weekly slaughter for SA, with the Murray Bridge plant accounting for 50-55% of SA capacity.

On a national scale the Murray Bridge plant kills 10-12% of sheep and lambs. To take this capacity out of the system overnight is guaranteed to have some impact on demand.

The good news is that there might just be enough capacity at other plants to take up TFI’s sheep and lambs. Figure 4 shows that the peak weekly sheep and lamb slaughter for the last 12 months was in December, at 530,000 head. If we assume this is full capacity, and deduct 55,000, this gives us a new number of 475,000 head, shown by the red line.

For the first half of the year at least, if supply runs in a similar fashion to last year, the market shouldn’t be constrained by slaughter capacity.

The week ahead

Uncertainty is not good for markets, and this might lead to a short term slump. We do know, however, that domestic and export lamb and mutton demand isn’t going to go away, the main risk is a processing bottleneck. The best example of this was the 2013-15 drought which saw more cattle on the market than could be killed, or carried, and very weak prices.

There is probably enough sheep and lamb slaughter capacity, along with carrying capacity on farm, to avoid a crash in sheep and lamb markets in the first half of the year at least. Over the coming weeks weaker prices may ensue at saleyards however as TFI make arrangements to handle the supplies they had booked up for January.

ABARES forecasting more lambs but demand to drive.

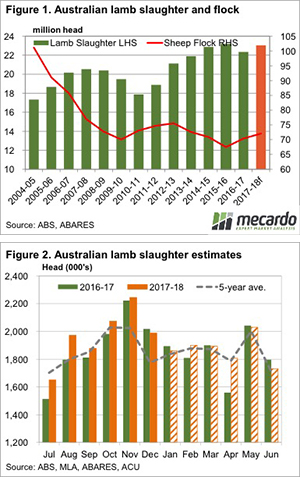
The Australian Bureau of Agricultural and Resource Economics and Sciences (ABARES) are good enough to have a crack at forecasting financial year lamb slaughter. This week we take a look into this, assume their December forecasts are right, and see what it means for second half lamb supply.

Regular readers will know that forecasting supply of any agricultural commodity is an imprecise art. With livestock, in particular sheep, it’s even harder. The starting number of sheep is always rubbery. Good seasons can see tightening supply and poor seasons heavy increases. Add to this variation in lambing percentages and on the same starting flock we have in the past seen variation of 10-15% in lamb supply.

Regardless of all this, ABARES have come out with what seems to be a reasonable number for 2017-18 lamb slaughter, pegging it at 23.03 million head (figure 1). The slaughter forecast is 3% higher than slaughter for 2016-17, and the five year average. The higher slaughter numbers are a result of growth in the flock, driven by lower lamb turnoff last year.

ABARES are forecasting the national sheep flock to finish 2017-18 at 72.6 million head. This is also 3% higher than June 2017, and will take the flock to a four year high, which, we would think, will drive lamb slaughter in coming years.

In the more immediate term, we can make some rough estimates of how lamb slaughter might play out for the next six months based on the ABARES forecast, and what has been slaughtered to date.

Figure 2 shows lamb slaughter for the year to date, based on Australian Bureau of Statistics (ABS) figures to October, and our estimates for November and December, based on MLA’s weekly numbers. Slaughter for the year to date has run around 3% higher than last year. This means that some of the forecast higher supply has already exited the market.

For the second half of the year we have deducted slaughter to date from ABARES forecast 23.03 million head. This leaves 11.22 million head, to which we have applied average seasonality to come up with monthly slaughter estimates.

Key points:

  • ABARES December Agricultural Commodities Report pegged 17-18 lamb slaughter 3% higher than last year.
  • To date lamb slaughter has been running 3% higher than last year, with remaining lambs to lift second half slaughter rates.
  • Strong demand for lamb has driven record spring prices so far, but strong supply will temper further rises.

What does this mean?

There are a couple of things to take from this analysis. Firstly, lambs slaughter for the coming six months is likely to be higher than last year. This should temper price rises to an extent. If demand was at the same level as last year, we’d expect lamb prices to be lower than last year.

However, the second thing we can see in figure 2 is that lamb supply is also likely to be much weaker than it was from October to December. We have been banging on about stronger demand driving prices higher during spring. If demand remains strong, prices are likely to better than last year even with stronger supply.

Lotfeeders feeling the squeeze.

December wasn’t a great month for cattle feeders. After a brief reprieve at the start of the month, rising input costs coincided with falling finished cattle prices to see another intense squeeze on margins. Tightening lotfeeder margins are not good news for those producing young cattle either, and for this, the first cattle article of 2018, we’ll see if we can find any respite in the coming months.

Figure 1 shows the main problem for cattle lotfeeders and the cattle market in general. After a small, and short-lived, bounce back to the 520¢ level in late November, the Queensland 100 day Grainfed Steer price has resumed its downward trend, finishing the 2017 at 507¢/kg cwt.
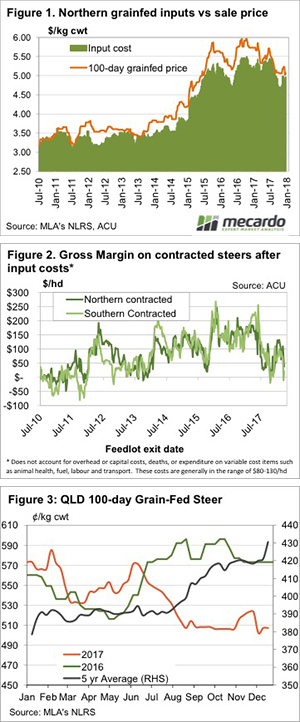
The Grainfed Cattle price is not only close to a 3 year low, it’s 7.5%, or 40¢ lower than this time last year.  For a 340kg lwt steer, the lower price means lotfeeders are receiving $136/hd less than this time last year.  The quarterly feedlot survey gives a pretty good idea as to why grainfed cattle prices are weaker. With still over 1 million head of cattle on feed at the end of September, supply is strong and consistent. There is little scope for lotfeeders to hold back supply in order to support prices.

On the input side, lotfeeders are seeing little in the way of positive news. The spike in fed cattle values in late November saw feeder values also jump. The shortfed feeder lifted 19¢ from October lows, to hit 302¢/kg lwt. It has since lost 6¢, but remains relatively strong.

Medium fed feeders have performed similarly, but have held their price at the top, finishing 2017 at 320¢/kg lwt. This, along with the falling grainfed prices, pushed margins for Riverina lotfeeders into negative territory in early December. A fall in feed grain prices due to some harvest pressure saw gross margins back at $20 per head (figure 2) late in December, but this is still a long way from turning a profit after overheads.

There might be a little positive news on the horizon for lotfeeders. On average Grainfed Steer prices rally 4% in January (figure 3) as Japanese demand ramps up. We haven’t really seen this in the last two years, as prices have eased from highs, but given we’re starting at a 3 year low, there is some scope for higher values.

Key points:

  • Lotfeeder margins finished 2017 at weak levels as Grainfed cattle prices were close to a 3 year low.
  • Feeder values held on to their early December levels, but will come under pressure.
  • There is some scope for a price rally in January, but grainfed cattle supplies will remain strong.

What does this mean?

Weak lotfeeder margins are not great news for the weaners which are about to be sold in Victoria.  Lotfeeders often place a floor in the market for heavier weaners, and this year their prices are likely to sway some way from last year’s values.

Low grainfed cattle prices are similarly depressing for grassfed cattle values. While there might be some sort of lift with tightening grassfed supplies in January, its likely prices will remain well below last year’s levels, unless we see a strong lift in export prices.
The best time to buy store lambs is….

Last week we looked at some long term trends in lamb and sheep trading enterprises. We identified that lamb trading margins were more reliable, but merino wether trading had the potential to offer very good margins, or on the rare occasion, losses. Price seasonality has a strong impact on trading margins so this week we delve deeper into the data looking for the best buy and sell months.

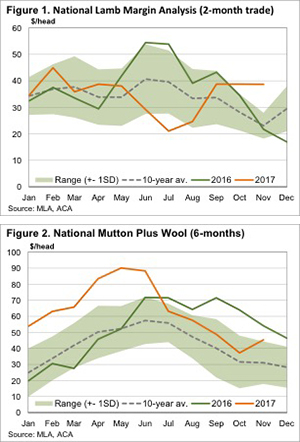
Our trade scenario is buying a 35kg lamb, holding for two months, and selling at 48kgs. No costs are accounted for, and as such the only variables are the store and trade lamb prices, and how these change over the two month term of the trade.

Figure 1 shows how the gross margins for the lamb trade have behaved over the last two years, and on average. The green shaded area shows the range of results two one standard deviation. The data points are for the sell months, so lamb purchases were made two months earlier.
It would come as no surprise that on average November is the worst month to complete a lamb trade. The average gross margin for lambs bought in September and sold in November is $23/head, with a narrow range of $18-28/head.

The strongest months for trades would also give few surprises. June and July both average around $40/head thanks to strong seasonal price rises from April and May into the winter months. The ranges are wider for winter trades from $28-53/head, however, showing the price movements have less consistency than the spring falls.

This year abnormal seasons, and as such abnormal price trends have seen somewhat of a reversal in gross margins on lamb trades. There wouldn’t be many growers out there who would turn down a lamb trade paying $39/head for lambs sold in November, and those who took the punt have been well rewarded.

We can run the same seasonal analysis for our six month mutton trade, where merino wethers are taken from 50-62kgs, cutting 2kgs of clean 19 micron wool. Figure 2 shows that on average the best results are for wethers shorn and sold from April to July, but there is plenty of variation.

Key points:

  • Gross margins on trading lambs and merino wethers shows strong seasonality.
  • The best margins are on lambs and sheep sold in the winter, but these are also the most expensive to produce.
  • Lamb and merino wethers bought now historically deliver strong margins, if costs can be kept under control.

What does this mean?

Sheep producers are likely to look at these charts and realise that the best gross margins are made at times when it’s hardest to turn off good sheep or lambs. Prices rise during times of shorter supply, due to the fact that grass has been hard to grow. These charts can be used when buying or holding sheep or lambs to quickly and easily assess upside and downside in any proposed trade, before some more in depth analysis is done.

For those looking at buying sheep or lambs, historical seasonality tells us that it’s a pretty good time to do it. Even the lower end of the historical range should provide a profitable trade for lambs and sheep, as long as feed costs are not too high.

Buyers enter the Christmas spirit

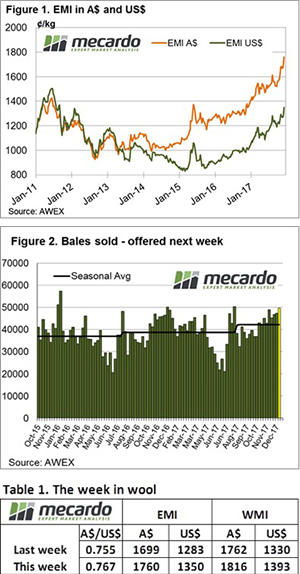
The Christmas spirit continued this week in wool sales with buyers bidding strongly from the Tuesday opening, before becoming slightly more subdued on Thursday. This resulted in strong week-on-week increases across the board, with the 32 MPG in Melbourne the only one to miss out.
This pushed the EMI to a new high of 1760 cents, adding 405 cents for the year – an outstanding 29.9% improvement.

Despite a slightly stronger Au$, the market improved 67 US cents for the week underpinning the strong market sentiment. W.A. didn’t miss out either with the WMI lifting 54 cents, closing the year at 1816 cents.

The total value of wool sold in the calendar year surpassed the $3.0 billion mark, this being the first time since 1995 when AWEX records started.

The increases year-on-year are impressive and worth noting, the EMI lifted 30% in Au$, while in US$ it was up 34%. To select a couple of other star performers, the 16.5 MPG rose 48%, 18 MPG plus 35% and the median wool clip 19 MPG was up 29% on the year ago levels.

Cardings have continued to “outperform”, posting a 32% gain for the year to end at almost 1500 cents.

The outlook for 2018 is positive, as brokers report that some wool growers have already shorn and sold wool that would have usually only came to the market in the January to March period. It seems a combination of more frequent shearing patterns and the attraction of higher prices has pulled wool deliveries forward. While the full extent of this is unclear, any reduction will have a tightening effect on supply in the New Year which will keep buyers keen.

The week ahead

The market now takes a 3-week break with sales resuming in the week beginning the 8th of January.

There will be wool growers who have delivered wool to store for sale in the New Year eagerly looking forward to the opening sales.

It is a time for optimism with returns from Merino sheep at levels rarely seen, giving the industry a timely boost that hopefully sees an increase in wool production.

Do they know it’s Christmas?

We are just on the brink of silly season, where the majority of the western world will effectively stop. There will be skeleton staff in most organisations (including Mecardo), and there will likely be little new activity. In this week’s comment, we have a look to see if the market has provided any pre-break cheer and joy.

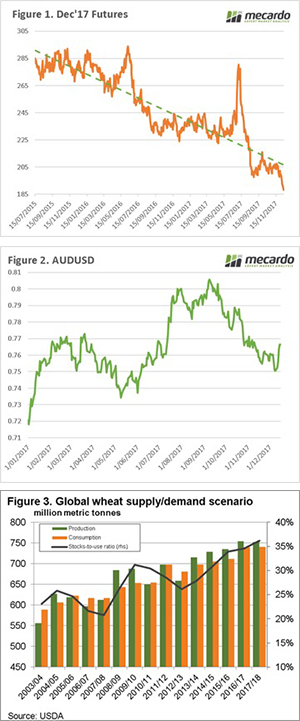
This week saw the end of trade in the December 2017 CBOT futures contract, and we thought it was worthwhile highlighting the performance of this contract. In figure 1, we can see the price from the start of trading in July 2015 to present. Apart from some northern hemisphere jumps mid-year in both 2016 & 2017 the market has been on a downward tradgetory.

In Australian dollars the December contract closed at $188, $90 below the peak achieved in July 2017. Growers who participated in a swap at this level, will be rewarded with a substantial return due to the swap profit and strong basis levels.

The Australian dollar regained strength this week (figure 2), on the back of stronger than expected jobs data. The Fed reserve also increased rates however have pointed to three rate rises in the coming year, a more gradual increase than expected.

The USDA released their December WASDE, which was as expected. The December report typically offers little in the way of surprises and is largely an adjustment exercise. In reality, if you want an update on the December WASDE, just read about the November one (click here).

The report pointed towards continued high stocks (figure 3), which unless something goes wrong in the northern hemisphere will lead to continued depressed pricing. The USDA interestingly maintained production in Australia at 21.5mmt, which will have to be adjusted in future reports.

So overall, this week there hasn’t been much data to provide joy this Christmas, but all it takes is an issue in the north to get improvements in price.

Next week

An interesting place to keep an eye on is Ukraine, which has very cold weather approaching but with little in the way of snow cover.