Tag: Articles

Export substitution effect

The percentage price spread premium between the Eastern States Trade Lamb Indicator (ESTLI) and the National Mutton Indicator (NMI) has been narrowing in recent months. It is not unusual to see this occur during the middle of the season. However, the Mecardo team were wondering how much of an impact the price differential has on Australia’s export volumes of lamb and mutton. Is there any substitution effect at play as the relative price of the two sheep meat exports varies?

The percentage price spread premium between the ESTLI and NMI has been broadly following its normal seasonal pattern of narrowing throughout the first half of the year, drifting from a high of 43% in January to a low of 28% over April (Figure 1).
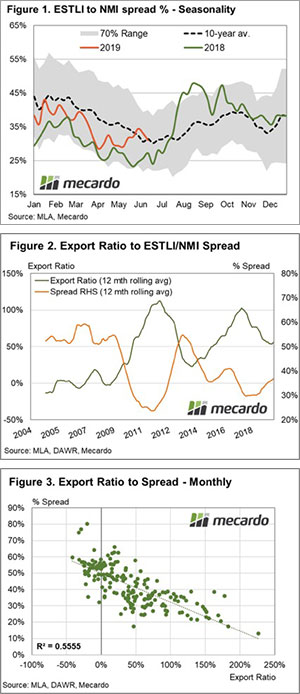
As the seasonal pattern demonstrates, it is not uncommon to see the spread premium at its narrowest during winter and it can dip towards the 20-25% spread region. Conversely, peaks toward 50-55% are achievable at the start and end of the season.

We have noted that occasionally month to month export flows to countries like China, that takes both lamb and mutton from Australia, show some signs of substitution. Export trade figures from April to May show that for China lamb volumes increased 10.6% while mutton exports declined 31%.

Indeed, across all trade destinations for the April to May period the total volume of lamb exports increased by 1,999 tonnes swt while mutton exports declined by 2,291 tonnes swt. It begged the question – Is there a relationship between the price differential between lamb and mutton and relative trade volumes?

Analysis of the 12-month rolling average of the percentage spread premium and the export ratio between lamb and mutton volumes shows there is a link. Since 2004, when the percentage spread premium exceeded 50%, lamb export volumes could not get beyond 50% more than mutton export volumes. Similarly, when the percentage spread premium dipped below 30% lamb export volumes expanded to close to double mutton export volumes (Figure 2).

What does it mean?

Monthly correlation analysis between the percentage spread premium and export ratio shows a moderately strong inverse relationship between the two data series, with an R2 of 0.5555 (Figure 3). When the price spread is high, signalling relatively expensive lamb, the trade flows favour mutton and in relative terms, lamb exports weaken. Conversely, when the spread is lower (relatively cheaper lamb) the trade flows favour lamb and lamb export volumes are relatively higher.

Given the low flock numbers presently and historically high prices encouraging increased production/flock rebuilding as soon as climatic conditions allow, there is a reasonable chance that we will see price spreads between the ESTLI and NMI remain toward the lower end of the normal range in the coming seasons. This will be particularly evident when the flock rebuild is able to get underway in earnest and it provides a promising outlook for lamb exporters and producers with lambs that meet the export specifications as the trade flows will favour lamb.

Key points:

  • The percentage price spread premium between the ESTLI and NMI has narrowed from January to June, broadly following the normal seasonal trend.
  • Historic trends show that when the percentage price spread premium dips below 30% trade flows favour lamb and when the spread extends above 50% they favour mutton.
  • Correlation analysis on a monthly basis confirms a moderately strong relationship between price spreads and trade flows.

Southern markets drag EYCI higher

With a full week of sales returning, yardings were up, yet prices managed to hold ground and in some cases rise. Markets appear to be in a holding pattern, waiting for either a break, or lack thereof, before makings another move.

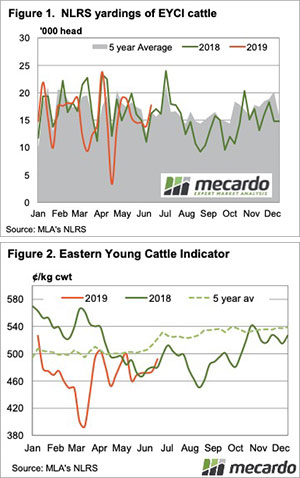
As producers made up for the short week, yardings in the Eastern Young Cattle Indicator (EYCI) lifted to a five week high (Figure 1). The main supply yards were in the north, with Roma and Dalby topping the yardings. Wagga was not far behind, and prices there were strong, helping the EYCI post a gain for the week.

Young cattle at Wagga made 570¢/kg cwt, while at the Roma Store sale they were 475¢. The north/south winter divide has come in strong.

The EYCI itself gained 17.7¢, helped by southern markets, and hit a six week high of 492¢/kg cwt.  Figure 2 shows the EYCI has only been higher in three weeks this year. Demand must be improved on recent weeks, with more cattle selling for higher prices. A bit of rain in the south seems to be helping.

The most expensive cattle in the country this week were Export Feeders from the paddock. At 330¢/kg cwt, export feeders are quoted 47¢ higher than domestic feeders, which weigh about 100kgs less. The dollar per head differential comes in at nearly $500. The grass or hay to put on the extra weight is obviously still hard to come by.

After a few down weeks, the 90CL Frozen Cow indicator has found it’s momentum again.  This week the 90CL gained 21¢ to almost get back to recent highs, at 687¢/kg swt. Demand for our beef on export markets remains strong.

Next week?:

The only areas that will see significant rainfall over the coming week are in WA.  As such we expect the holding pattern to continue in the cattle market, with tight supply being met by muted demand. 

More dry weather concern surrounding the new cereal crop is starting to grow. No cattle producers want to see another year of $400 grain and tight hay supplies, but every week it doesn’t rain the nervousness grows.

WA prospects on the rise

Improving prospects in WA contrast the continued dry weather in the east. Markets are reacting as would be expected, with confidence in the NSW crop starting to wane. Internationally, last week’s gains have been given back and east coast markets are still taking some notice.

WA’s rain for the month to date, combined with next week’s forecast, will see many cropping areas hit their June average.  While APW Multigrade prices in the west are not far off the highs seen at the start of the month, the improving prospects in the West have seen basis to CBOT weaken.

WA port prices for new crop wheat are currently in the $310-320/t range, and it’s not far off being priced into northern NSW and Queensland markets.

ASX wheat weakened a little this week, falling back to $334 from a high of $350/t earlier this week.  The fall has been largely in line with an easing CBOT, which yesterday settled at $285/t for Dec-19.

CBOT wheat bumped up against a ceiling at 550¢/bu. Figure 1 shows that 550¢ has been a solid resistance level since 2015. It is going to be hard for CBOT to move much higher without some issues with the Black Sea spring crop, or a serious push from corn.

New crop Canola prices have shown some more strength this week. The Geelong quote is at a new high of $587/t, which is a solid premium to old crop. Export demand seems to be holding new crop Canola at levels higher than old crop. It’s an odd conundrum that this years’ supply falling below an exportable surplus saw prices fall. We might see it again if ABARES forecasts are to be believed.

next week?:

Local wheat markets seem to be comfortable with southern states producing an exportable surplus of cereals. This is keeping a lid on ASX basis for the time being. Grain prices are still high in northern NSW and Queensland, with southern states simply at the freight difference.

If and when it does rain in NSW, it might be more a case of the north/south spread narrowing rather than ASX prices, which are currently priced in the south, moving lower.

Is this the bottom?

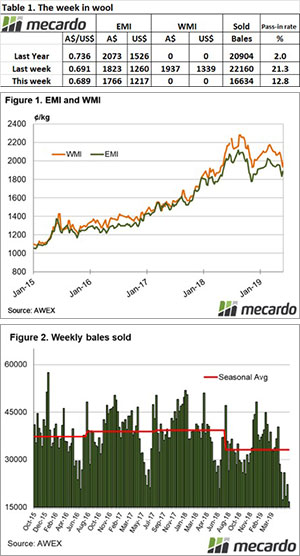
While the market again suffered a significant fall, the AWI commentary on the market noted that almost all of the damage occurred on day one of selling, with a more measured response from exporters on Thursday.

Since the peak of March, in four months the EMI has lost 261 cents, or 14%; while in US$ terms it has fallen 233 cents or 16%. Bales sold is also down, 84,500 or 15% less than over the corresponding period.

The Eastern Market Indicator (EMI) fell back a further 57 cents this week on top of the 41 cents fall of last week and closed at 1,766 cents. The Au$ was also weaker slipping below US $0.69 mark and as a result, the EMI in US$ terms fell 42 cents, ending the week at 1,218 US cents (Table 1).

The AWI market commentator lists exporter finance issues, trade & tarrif wars and Brexit as all factors impacting negatively on the market over the past four months.

On the positive side, the EMI has not been as low in US$ terms since October 2017, so for the processors who have stood back from the market the price now should be more attractive.

 Supply is well back, both in seasonal and year-on year comparisons causing exporters to run down inventories; so along with the fact that over the next 2 months Australia is the only market with any volume, if there is any move to replace stocks we will see stronger demand. These are all factors leading to the suggestion that we may see the market find support at these levels.

Only 19,072 bales were offered at Sydney & Melbourne, 9,068 fewer than last week with Fremantle again not participating. The pass in rate across the selling centres was 12.8% for the week, Although well down on last week’s 21.3% the low offering meant that 16,634 bales were cleared to the trade, 4,270 fewer than the corresponding week last year.

We looked back to 2015 and could not find a lower week of wool bale clearance, this could well be the lowest for 50 years or more!  In the auction weeks since the winter recess, 1,390,315 bales have been cleared to the trade, 278,830 fewer than the same period last year.

The dollar value for the week was $30.38 million, for a combined value so far this season of $3.150 billion.

The week ahead

Next week a combined offering of just over 30,800 bales is rostered across all selling centres. For the following weeks 35,200 and 35,500 bales are currently forecast.

It cannot be ignored that the wool market is weak. If we compare when the market was at 1750 cents in early 2018, the outlook is far less optimistic despite lower supply. Back then the thought was “the market can only go up”. 16 months later after running through 2,000 cents we are back where we started at 1766 cents, but with a far less optimistic outlook.

Winter tightening pushes prices northward… in the East

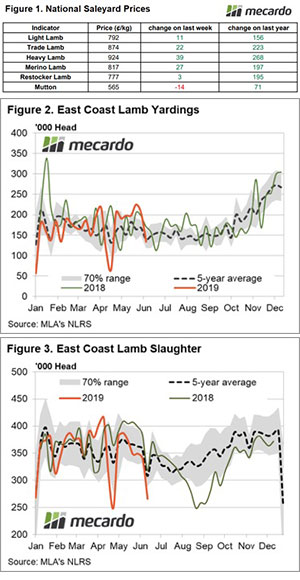
Declining sale yard throughput and slaughter levels for lamb and sheep markets are making their presence felt on price movements this week. Across the national market indicators prices were up for all categories of stock except for mutton.

East coast lamb markets leading the charge higher with reports of heavy lambs in Wagga fetching record prices of over $350 a head. The Eastern States Trade Lamb Indicator (ESTLI) reflecting the buoyancy across the eastern markets with a 42¢ gain to close yesterday at 885¢/kg cwt.

The National Trade Lamb Indicator (NTLI) climbing too, although not as robustly as the ESTLI, posting a gain of 22¢ to hit 874¢ – Figure 1. West Australian lamb markets dragging on the national lamb indicator figures with all reported lamb categories in the west posting falls between 40¢-110¢. The West Australian Trade Lamb Indicator (WATLI) off 65¢ to finish yesterday at 815¢.

East coast lamb yarding levels have taken a 34% dive in recent weeks to see it trending below the five-year seasonal pattern for the first time since April – Figure 2. Last season we saw a dip toward 120,000 head for east coast lamb yardings during late June, so we may not be out of the woods yet for the tight winter conditions.

Lamb slaughter levels in the east are reflecting the tight conditions too with the most recent figures dipping below the normal seasonal range to record the second lowest weekly figure since the start of 2019 at a whisker under 266,000 head – Figure 3. Bearing in mind that the lowest weekly figure this year was during the Easter/ANZAC shortened trading week for meat processors it’s a sign that margins are likely tight, at least for sheep and lamb processing lines.

What does it mean/next week?

The weekly rainfall forecast points to some decent falls scheduled for the west, up to 100mm for some south west coastal regions which could relieve the recent price pressure experienced in WA.

Across much of the rest of the sheep rearing regions across the nation there isn’t much rain on the horizon to support prices so producers will have to rely on the tight winter supply to keep some price buoyancy present.

Hopefully the live sheep export hiatus currently underway won’t continue to act as a drag on WA prices throughout the remainder of Winter.

Weekly Wool Forwards for week ending 21st June 2019

A quiet week in the forwards market with only two trades, reflecting the falling auction markets of recent weeks.

One trade was dealt in 19 micron wool for August and agreed at 2,050¢  One trade was dealt in 28 micron wool for August and agreed at 1,040¢.

It’s been a few weeks since we’ve seen the forwards market this reserved but it is to be expected in a falling auction market. Growers don’t generally lower their prices to suit a weak market, but hold for when it will eventually rise again. Until then, as prices fall in search for a base and the outlook looks less optimistic as explained earlier, we will likely see quieter forwards for some time.

WA lamb catch the east

WA lamb producers have joined the party, with their lambs almost the same price as those on the east. For the east coast, it was either steady or lower for most sheep and lamb indicators.

Trade Lamb prices retreated further this week, but mutton managed to hold on. Some confidence seems to have come out of the restocker and feeder lamb market, but heavy lambs moved to a higher premium.

Of the eastern states indicators, it was only the Eastern States Trade Lamb Indicator (ESTLI) and the Restocker indicator which lost ground. Light lambs were already relatively cheap.

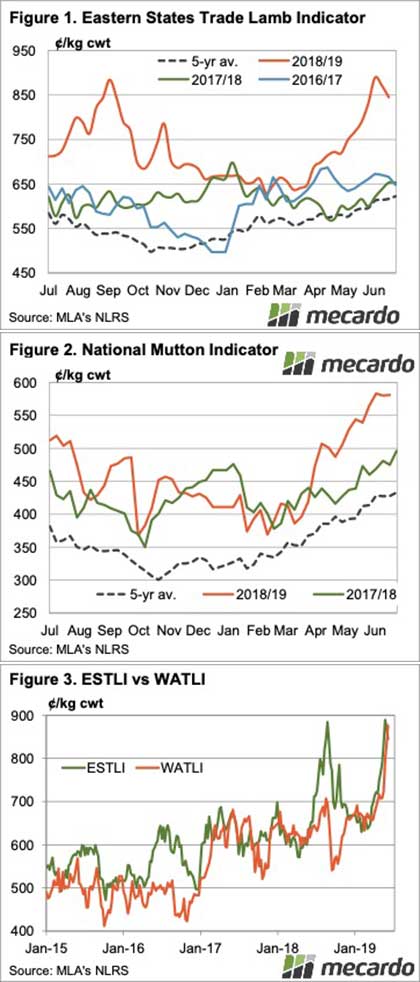
The last fortnight has seen the only real check in the rising market (Figure 1). The ESTLI has lost 44¢, mainly due to weakening prices in Victoria and South Australia. The price fall is a little reminiscent of the check the market had in August last year, before it went on to set new highs. We know supply is going to get tighter, the question might be whether processors are better off closing for a period, or to keep on killing.

Restocker lambs have also eased from highs, but have taken it a bit further. While 800¢ is still a great price for lambs, it’s not 900¢. Not surprisingly, the hardest lambs to produce are priced the highest.  Heavy lambs held steady this week, the east coast indicator at 885¢/kg cwt.

Mutton has managed to hold its ground, suggesting it might be the smallest loser for processors at the moment (Figure 2).

In an indication that the export market is coming to terms with lamb prices over 800¢, WA markets have caught up to those on the east coast. The WA Trade Lamb Indicator hit a new high of 862¢ this week, a lazy 310¢ above the same time last year.

Next week?:

We need to remember it is still only June, and while sheep and lamb supplies are tighter, they are nowhere near winter lows.  As such prices should find a base soon, and possibly take another leg higher.

There doesn’t appear to be a lot of downside for sheep and lamb markets, with lambs likely to hit the market as they come ready, but supply won’t be enough to see it fall too far.

Rain pressures ASX basis

Have you heard the one about the rain on the US Plains? Thought so. It might seem like déjà vu but the story remains the same, with a few twists thrown in this week.

More rain is falling or is forecast to fall across US cropping areas. Northern areas are being most affected, with soft red winter wheat quality now coming into question.  This concern, along with further rises in corn, managed to push CBOT back to recent highs last night.

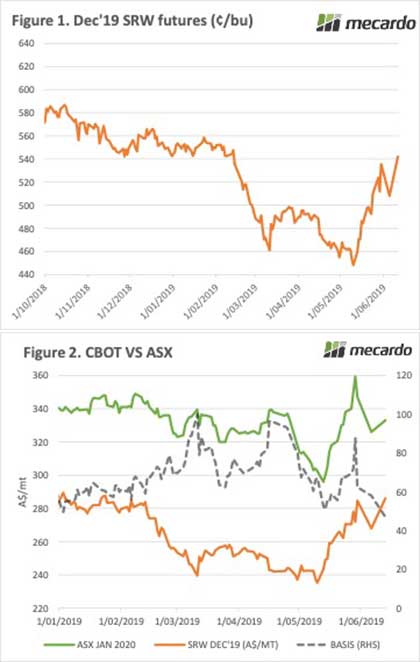
Figure 1 shows the bounce CBOT experienced in US terms, just making a new three month high.  With the Aussie dollar relatively steady for the week, CBOT is also back to a three month high in our terms, at $287/t.

Jan-20 ASX Wheat traded at $333/t yesterday, with the rain across the cropping areas of SA and Victoria helping depress basis.  ASX basis is now down back under $50 per tonne (Figure 2) as the southern cereal crop now has enough moisture for the next month.  There is a long way to go though.

ASX Feed Barley traded at $278.50/t, and is now at a $55 discount to the wheat contract.  Barley rarely gets to such a discount, and this suggests it might be good buying for consumers.  World feed prices have been on the rise, with CBOT Corn now at $250/t in our terms, so further downside might be limited.

What does it mean/next week?:

It is now just NSW which needs the rain in a hurry. There is little prospect for the next 8 days, so we’ll have to wait a bit longer. Internationally the heavy supplies of wheat are being offset by tighter supplies of corn.  There could be further issues for corn, with the target for many the magic $300/t wheat swap, within reach.

No good news for the wool market

Another week of low offerings, high pass-in rates and price falls.The retracement from the February peak is well and truly happening.

All categories were impacted with the exception of the better prepared crossbred lots, although these were in scarce supply.

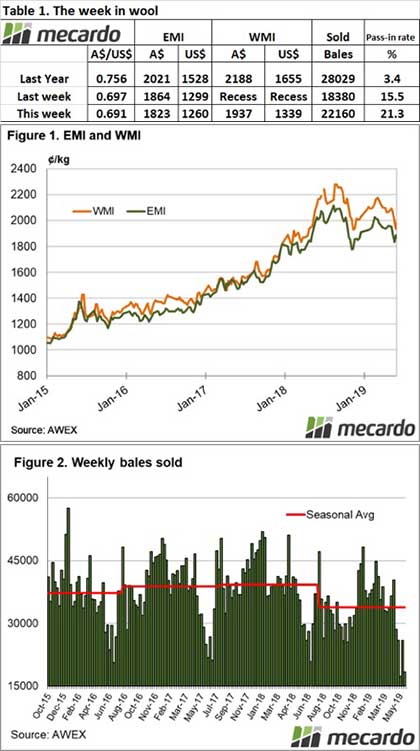
The Eastern Market Indicator (EMI) fell back a further 41 cents this week on top of the 23 cents of last week and closed at 1,823 cents. The Au$ held steady for the week at US $0.691 and as a result, the EMI in US$ terms fell 39 cents in line with the Au$ movement, ending the week at 1,260 US cents (Table 1).

AWEX report the EMI is now 293 cents below the record of 2,116 cents it achieved in August last year and 198 cents lower than the same time last year, a fall of 9.8%.

Fremantle had to catch up to the East coast following its one week recess. This realignment hit hard on Wednesday with a generally lesser continuing fall on Thursday. It was a very small offering of just under 6,000 bales in W.A., however growers passed in 2,400 bales or 40% of the offering. This could be a record pass in rate, even for Fremantle.

An offering of just 28,140 bales came forward nationally, 6,300 more than last week with Fremantle returning. The pass in rate across the selling centres again was high, at 21.3% for the week, up on last week’s 15.5%. This meant that 22,160 bales were cleared to the trade, 11,300 below the corresponding week last year. In the auction weeks since the winter recess, 1,351,521 bales have been cleared to the trade, 274,560 fewer than the same period last year.

The dollar value for the week was $42.20 million, for a combined value so far this season of $3.119 billion. A simple calculation of $ value divided by bales sold gives us $1,904 per bale across all types for the week.

Crossbred wools also fell on both days with the exception of some of the better prepared fine crossbreds which were slightly stronger. Oddments were cheaper, although some lots with low VM attracted stronger interest, again these lots were few and far between.

The week ahead

Next week a combined offering of just over 19,000 bales was rostered across all selling centres. For the coming weeks 31,000 and 34,000 bales are currently forecast.

The past 5 weeks has seen almost 40,000 fewer bales cleared to the trade compared to the same time last year. It is with interest we await the usual Spring flush of wool to get a feel for the full extent of the supply levels that will be available for the rest of the year.

Lack of rain hampering EYCI

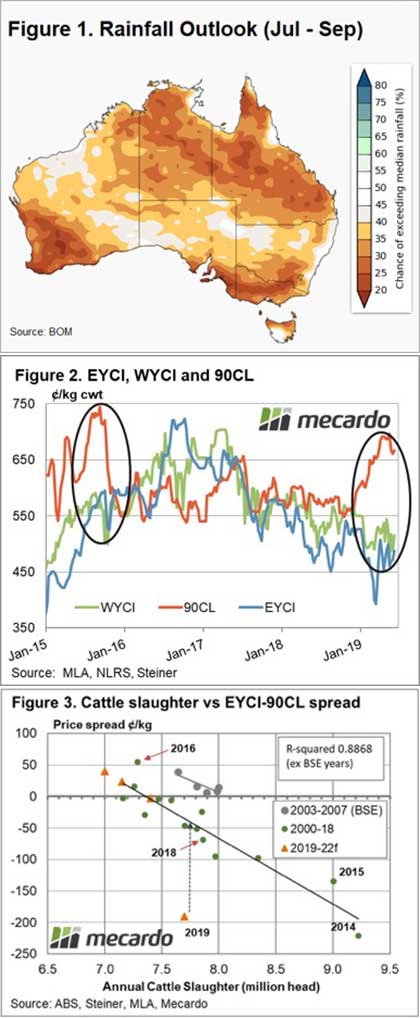
Softer cattle prices this week were noted, and impacts were felt most heavily on the younger cattle in the northern markets as the updated Bureau of Meteorology rainfall forecast for the next three months shows a troubling lead into Spring.

The Eastern Young Cattle Indicator (EYCI) closed 2.6% softer to finish the week at 474.5¢/kg cwt. Finished cattle were weaker too across the east coast with the Heavy Steer indicator shaving off 1.8% to close at 289.75¢/kg lwt.

Restocker Steer prices between Victoria and NSW showing the impact of the recent Victoria rains with Victorian Restocker Steers commanding a 30¢ premium over NSW to record a 38¢ gain on the week to close at 258.4¢/kg lwt. Despite the rainfall in Victoria in recent weeks the longer-term outlook is worrying.

The mid-month rainfall outlook released yesterday shows low chances of exceeding median rainfall for much of the country as Winter comes to an end. Delving into the month by month rainfall summary shows that August is the best chance for rain in the northern NSW and southern Queensland region. However, across the entire three-month window chances of a drier than average finish to Winter across the southeast and south west of the country exceeds 75% – Figure 1.

Looking back to the final stages of the 2014/15 herd liquidation it was the dry conditions keeping young cattle prices subdued across Australia, despite offshore leading indicators like the 90CL rallying strongly. As the two circles demonstrate on Figure 2, a similar picture is emerging at present with the EYCI to 90CL spread moving to a significant discount like what transpired at the end of the 2014/15 liquidation.

Next week

Based on the current annual cattle slaughter projections and the historic relationship between slaughter levels and the EYCI to 90CL spread the EYCI should be around 150¢ higher – Figure 3. However, the lack of rain and the poor forecast for the remainder of Winter is weighing on young cattle prices.

The short-term outlook points to sideways price consolidation as limited rainfall will act as a significant headwind. In contrast, strong offshore prices, robust export demand and healthy processor margins continue to support the cattle market on any price dips.