Tag: Business

High throughput across the country weighs market

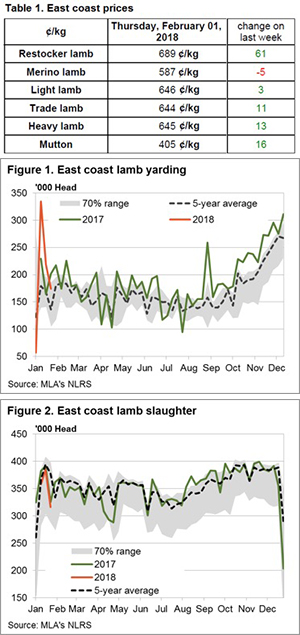
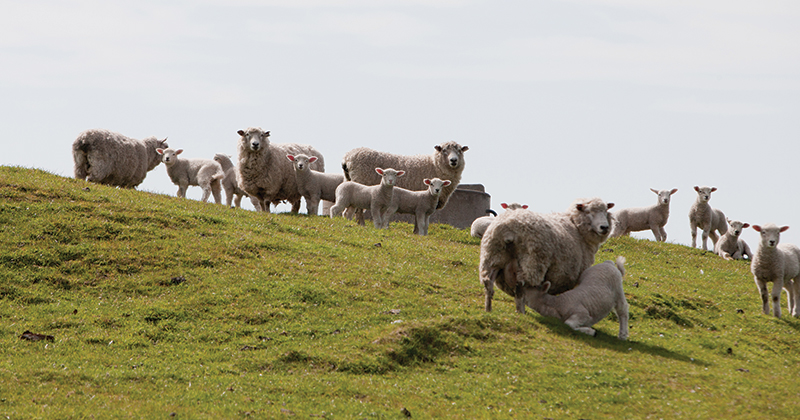
Strong throughput numbers for both lamb and mutton across the nation this week saw falls recorded in all national sale yard indicators, ranging between 3$ to 9 %.  The headline Eastern States Trade Lamb Indicator (ESTLI) dropping 9.4% to close at 601/kg, while mutton was equally weak, off 8.8% to 385¢.

The East coast sale yard indicators mostly mirroring the national falls, with many categories posting declines between 2% to 12%. In Victoria, Merino Lambs the weakest, falling 9% to 558¢, while in NSW Restockers took the heat with a 12% drop to 598¢.

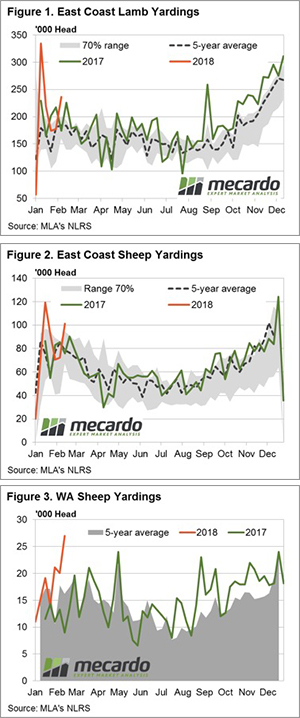
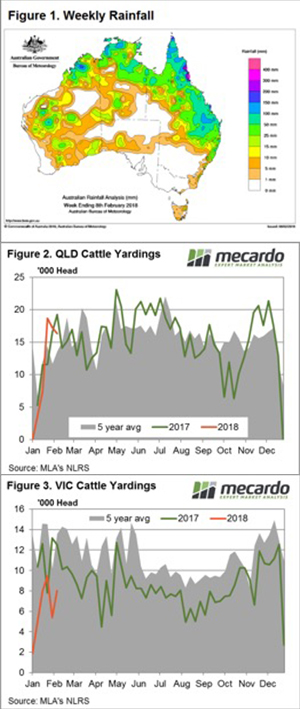
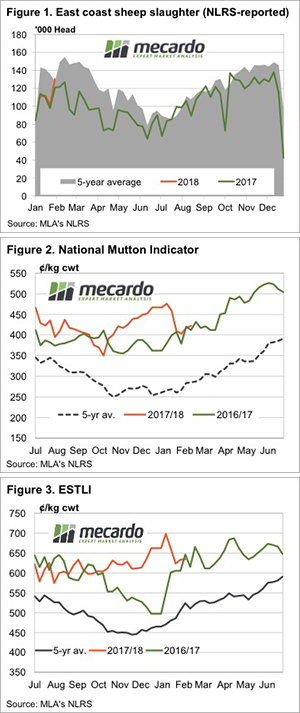
Victorian and NSW lamb yardings shown to be running above average for this time of the year and this saw East coast throughput lift 33% on the week to sit 28% higher than the seasonal average for this time in the year – Figure 1.

Higher NSW mutton yarding the key behind the elevated East coast figures too this week – figure 2. NSW sheep thoughput currently 34.7% over the seasonal average level for this week in the year and the added numbers of mutton has pushed the East coast levels over 100,000 head this week, an 18.7% gain on the seasonal average.

Western Australian indicators for Merino Lamb and Mutton were particularly soft, both off 19% to 509¢ and 370¢, respectively. High throughput the likely culprit there too with WA mutton yarding levels showing a solid surge this week with 27,000 head recorded – an increase over the seasonal average of 66.3% – Figure 3.

What does it mean/next week?:

A wetter week is anticipated, particularly in the West, and this should stem some of the price declines experienced by producers this week. The BOM have forecast a higher chance for a wetter than average February and there hasn’t been much for the East coast for the first few weeks of the month – perhaps that means the second half of the month we will be some decent falls… fingers crossed.

Take a little bit, give a little bit

This was a week of “toing & froing”; in early sales buyers tested the market to see if some of the gains from last week could be taken back. However, by the end of the week, buyers were forced to re-engage to secure volume.

A small catalogue of Merino fleece wool (AWEX reported the smallest Merino fleece offering since March 2016), and growers preparedness to pass-in around 8% of the offering eventually forced the hand of buyers.

Of the 42,500 bales originally offered, only 39,201 sold. The Pass-in rate was 7.8% or 3,318 bales.

The A$ was quoted up for the week to sit above US$0.79 at the close of selling. This contributed to the Eastern Market Indicator (EMI) falling by $0.06 for the week to close at 1812¢. After last week’s massive 102cents lift, The Western Market Indicator (WMI) gave back 42 cents to finish at 1879 cents.

The underlying strength in the market was evidenced by the EMI rising US$0.14 for the week due to currency movements.

Again, we have seen evidence that by passing-in lots, sellers are able to exert influence in the market to support wool prices when the market softens. Buyers have little option but to bid the market up to fill orders as there are scarce supplies of wool floating around the system.

In general, Cardings and Crossbred types had a good week, posting gains in all centres except for W.A., although in the West any types finer than 17 microns experienced “extreme” demand with up to 100 cent increases.

Growers need to take care with “off-type” wool; lines with low staple strength, high mid-breaks or excessive VM levels are the most effected in the current market. When the market rallies and buyers are scrambling to fill orders, faults are over-looked and prices for lesser quality wools are excellent.

However, when the market eases, these types are the most effected. Conversely, wool exhibiting good measurement holds value in an easing market due to the shortage of these types to fill existing orders.

The week ahead

Sales are scheduled for all three centres next week, with Melbourne selling on Tuesday, Wednesday & Thursday while Sydney & Fremantle will only offer on Wed & Thur.

A total of 41,815 bales is rostered, only 1,000 bales less than this week’s offering but more than the clearance of 39,000.

It’s a topsy turvy market

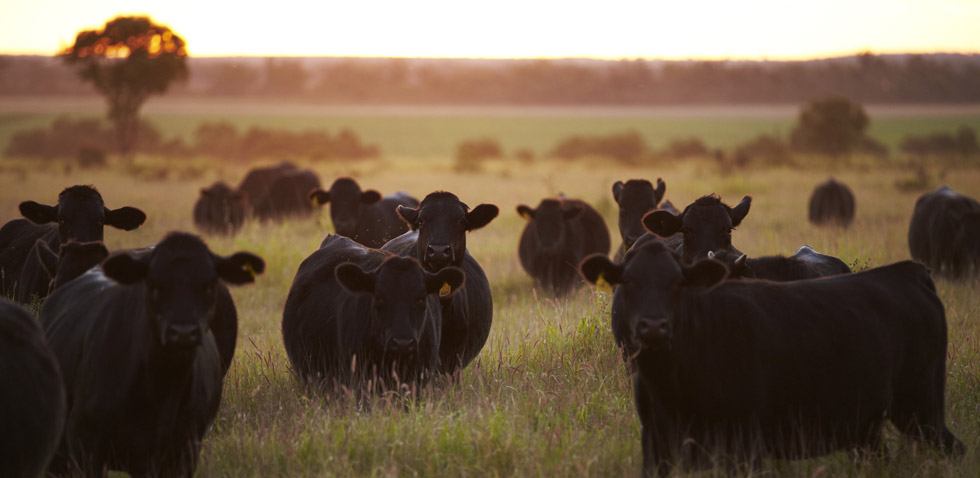
Some very solid rainfall in Queensland this week, yet this was unable to inspire trade cattle prices there as high throughput weighs on the market. In contrast, NSW and Victoria broadly missed out on any rain yet surprisingly throughput was below average and trade cattle prices firmed.  

Figure 1 highlights the rainfall pattern for the past week, showing good tracts of central Queensland recorded falls in excess of 50mm, but not much in the way for central to southern NSW nor Victoria. NLRS reported state sale yard figures during the week were a bit of a mixed bag, although the Trade Steer category showed some peculiar divergences along the East coast.

Queensland Trade Steers softening 4.6% on the week to sit at 269¢/kg lwt, the worst performing category across the state. While in NSW Trade Steers lifted 5% to 287¢/kg lwt, nearly the best performing category there, only pipped by NSW Restocker Steers – up 5.9% to 309¢/kg lwt.

Further south Victorian Trade Steers fared even better with a 6.3% gain to see them fetching 287¢/kg lwt. Mirroring the NSW experience by only being outdone by Vic Restocker Steers up 8% to 285¢/kg lwt. Given the lack of rain in the south and the expectation that pasture in this area at this time of year not generally at its best you would expect less robust Restocker activity.

Figures 2 and 3 suggest the reasoning behind the opposite price reactions is a question of sale yard throughput with Queensland yardings trekking above average for this time in the year, while Victorian figures are un-seasonally low.

Young cattle prices across the nation a little uninspiring on the with the benchmark Eastern Young Cattle Indicator (EYCI) trekking sideways, up a mere 0.7% to 538¢/kg cwt. Out West the WYCI similarly unresponsive with a meagre 0.5% decline to 570¢/kg cwt.

What does it mean/next week?:

The 90CL frozen cow continue to grind higher (pun intended) with a 1.1% gain to 575¢/kg CIF and reports out of the USA continue to point to robust domestic demand and strong export buying. This should be enough to continue to see the EYCI reasonably well supported in the coming week.

No clear sign of the anticipated wetter February for the South East of the nation at this stage although fingers are crossed Victoria and NSW for a bit of respite as we head towards the end of February as a bit of rain will give cattle prices a further boost.

Cattle producers have best year ever…again

  • South West Victorian Cattle Producers had their best year in 47 years of the Livestock Farm Monitor Project.
  • The top 20% of cattle producers in the South West and Gippsland made huge margins.
  • Lower prices are likely to see gross margins weaken this year, slowing herd rebuilding.

A couple of weeks ago we took a look at some Victorian benchmarking data outlining the profitability of sheep and wool enterprises.  Cattle producers were also included in the data, and given the high prices we shouldn’t be surprised that they had their best year in the last 47. That makes it two years in a row.

Figure one shows the long term data for South West Victoria, with strong prices seeing 2016-17 eclipsing the 2015-16 numbers by $38/ha.  The extraordinary gross margins of $668/ha were up 6% on last year in real terms, and miles ahead of any other year except for 2010-11.

Other regions showed similar strong performance.  Figure 2 shows that Northern Victoria had a slightly lower cattle gross margin per 100mm of rainfall than the south west, while Gippsland was the best performed, with $90/ha/100mm.

The most striking bar in figure 2 is the performance of the top 20% of cattle producers in Gippsland, they achieved gross margins of $261/ha/100mm.  The top 20% of Western Victorian Cattle producers were no slouches, but were nearly $100 behind Gippsland, at $164/ha/100mm.

Figure 2 also shows us the ‘average’ cattle producers did a bit better than lamb producers in the South West and Gippsland, but marginally worse in Northern Victoria.  The top 20% of cattle producers were streaks ahead of their lamb counterparts in Western Victoria and Gippsland, but in Northern Victoria, they made just $1 more.

Along with high prices, the season was also favourable as it all came together for cattle producers.  However, figure 3 shows that cattle gross margins were maybe not as strong as prices might suggest.  The 2016-17 point is above the trend line, which suggests gross margins should be somewhere near the top 20% in Gippsland.

Cattle producers are likely to have taken the opportunity to spend some money on ‘repairs and maintenance’, increasing variable costs and pulling gross margins lower than where they might be under normal spending patterns.

What does it mean/next week?:

With the fall in cattle prices since last winter, cattle producers are unlikely to continue the run of higher gross margins in 2017-18.  With weaner cattle prices back around the $1000/head mark, gross margins might fall back to $500/ha in South West Victoria.  Still a great margin, just not as good as the last two years.

Expected weakening in cattle margins, and continued strong sheep, lamb and wool prices, will halt any shift back towards cattle which might have been brought on by recent high prices.  At least in the south the herd rebuilt might slow.

Steady as she goes for lamb but mutton finding a lift

It was another unusually steady week for lamb prices, as supply seems to be closely matching demand.  Mutton prices found some strength however, especially in NSW, but regular readers will know this was not unexpected.

The thing about writing market analysis weekly is that no one really remembers the predictions you made unless they are particularly bold.  This is both good and bad.  Good when you get it wrong, bad when you get it right.  At least we have the opportunity to remind readers when we were right.

A couple of weeks back we surmised that after Australia Day demand for lamb wanes, more kill space might open up for mutton, boosting prices from what were three month lows.  Figures 1 and 2 show that we actually got this one right.

East Coast Mutton Sheep Slaughter rose to levels not seen in two years, and the extra demand has dragged the National Mutton Indicator 20¢ higher over the last two weeks to sit at 422¢/kg cwt.

Most of the mutton action was in NSW, where the indicator is at 430¢, and WA which has the highest prices sheep at 456¢/kg cwt.  Sheep in WA are 45% above the same time last year.

Lamb prices tracked sideways this week, with the ESTLI stalled at 634¢/kg cwt (figure 3).  Lambs are more expensive in Victoria, at 659¢, and cheaper in NSW at 630¢.  SA prices have recovered following the summer flush, and the decline in slaughter capacity, now sitting at 596¢/kg cwt.

The week ahead

Figure 3 shows that on average lamb prices are likely to track sideways to slightly higher at this time of year.  There is a risk prices could fall if the dry weather continues, especially in the parts of NSW where they might expect rain at this time of year.  On the other hand, a good widespread rain might see enough tightening to rally values back above 650¢.  There is nothing on the map for the next week, so expect steady lamb and mutton prices for the next week or so.


Stunning recovery for wool

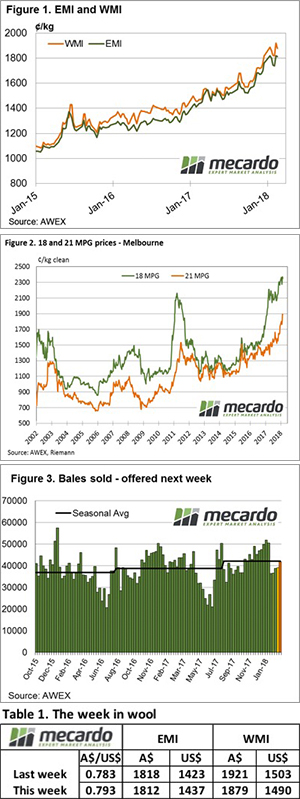
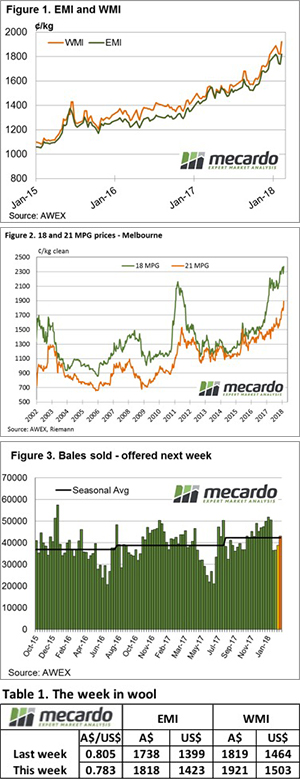
This AWEX report probably summed up the sentiment of the wool market this week – “The recent wool market decline halted in stunning fashion”. Every one of the AWEX reported indices posted an improvement, some of the increases had to be seen to be believed.

The A$ also contributed and was quoted down 2.25 cents to US$0.7825 at the close of selling, helping the Eastern Market Indicator (EMI) to rise by $0.80 for the week to close at 1818¢. The Western Market Indicator (WMI) rose a massive 102cents to 1921¢ – figure 1.

To put this in context, the previous peaks were reached in the first sales of this year, then the EMI hit 1818 for the first time, while the WMI was quoted at 1888. To underline this recovery, the EMI in US$ terms is just shy of its 1434 peak in January at 1423. This has been an unprecedented reversal of the price declines of the last couple of weeks and reinforces the volatility of the market.

There are some interesting factors with the various indices; if we take Melbourne quotes as an example the 18 MPG on the opening sale week in January was quoted at 2363, it fell to 2225 over the following 2 weeks, and this week it sits at 2363; all this movement occurring over 4 selling weeks.

The 21 MPG over the same period started at 1800, fell to 1765 and now sits at 1891.

Cardings turned around their downward trend also, posting strong gains in all centres however of note was Melbourne and Fremantle, where gains of 100 & 120 cents respectively were recorded. Crossbred also joined in with 40 – 70 cent gains common.

Growers passed in only 2.1% of the offering in a positive response to the market.

This is a time for sellers to act in the wool market, fresh shorn stocks need to be baled and trucked to store for testing as soon as possible, and wool in store should be sold, either at auction or on Wool Trade.

Growers then should discuss forward sales with their broker representative. It’s not a question of whether sales should occur or not, these prices are unprecedented. The discussion needs to be around how much to lock in, and what is the best contract to use; these are questions that will have unique answers for each wool producing business.

The week ahead

Tasmania will eagerly look toward their traditional February special sale next week; while growers and brokers may have been nervous over the past couple of weeks, as it turns out the timing could not have been better.

Sales are scheduled for all three centres with Melbourne selling on Tuesday, Wednesday & Thursday while Sydney & Fremantle will only offer on Wed & Thur. A total of 43,000 bales on offer, almost 5,000 bales more than the clearance of 38,700 of this week.

WASDE the matter now?

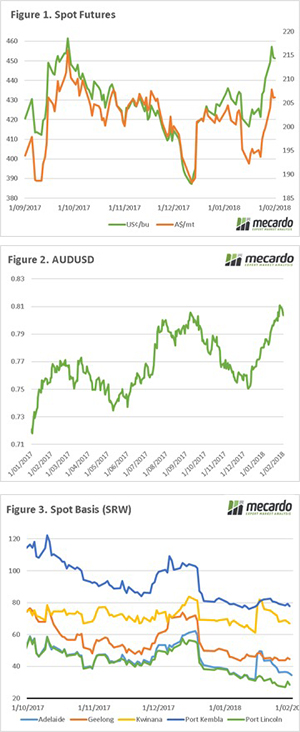
An exciting week in markets, with volatility across equities and currency. In the past week wheat futures have performed well, but has the benefit been passed onto local growers? Overnight the WASDE was released, and it provides some data that is good for Australian grain in the long term.

The WASDE report was released overnight. The report was largely bereft of much in the way of surprises, with tinkering around the edges. The summary of the report is provided in table 1. On a month on month basis, the end stocks for wheat, corn and oilseeds were all reduced. This has to be tempered by the fact that season on season, end stocks are still strongly up, with the exception of corn.

An interesting piece of data in the report, was the imports of wheat. Egypt has traditionally been the largest importer of wheat; this year Indonesia is expected to take the crown. As we can see in figure 1, there has been a rapid increase in imports in the past five years. Increased Indonesian imports are of benefit to Australian farmers, as we have a geographic advantage into this destination. The question remains on whether imports have been higher due to low pricing, or whether this will continue to be a long-term trend when prices rise.

The futures market overnight took a tumble (figure 2), nonetheless futures when converted into A$ remain $15 higher than the same time last week. At a local level the full benefit of the futures rally has not been passed onto local growers, with basis levels (figure 3) falling between $5 and $11 dependent upon zone.

One thing to keep in mind is that although basis levels have fallen since harvest, they have fallen from close to record levels. In our articles prior to harvest, we recommended selling basis, as it was very top heavy.

I recommend re-reading the article ‘3 elements that need to be considered when selling grain’, this will gives some indication on how we can improve our risk management strategies.


What does it mean/next week?:

The A$ is currently falling, which if it continues this trend will add additional value to export pricing, and make it more attractive to buy in Australia.

The key focus will be on the US weather, with drought seemingly spreading further their productive potential will be constrained, if no rain is received in the next six weeks.


Tentative recovery for wool

This week the wool market appeared to draw breathe after the sharp falls of the previous two weeks. It was the fine end that fared the best, and of note was the strong competition for sound wool with low mid-breaks.

The higher A$ saw only a 1 cent fall in US $ terms, while the Eastern Market Indicator (EMI) ended the week down 6¢ to close at 1738¢. The Western Market Indicator (WMI) also eased marginally to register a 2¢ decline to 1819¢ – figure 1.

While the early sales for the week had buyers again showing caution causing the market to open weaker, by the end of the week a more positive tone had emerged. This was especially noted in the fine wool types (17MPG +21 in Sydney & +14 cents in Melbourne), as well as the mid micron categories. The 21 MPG in Melbourne improved 33 cents for the week while in Fremantle AWEX quoted the 21 MPG up 10 cents.

Since the market peak in the first sale of this year, the EMI is down 4.4% although in US$ terms it is only 2.2% of the peak. The 17 MPG is in fact higher, up 1.4% %, while 19 MPG is 3.5% weaker.

Cardings again were out of favour losing 30 – 40 cents, now having accumulated a drop over the last 3 weeks of 280 cents, a massive 21% down from the first January sale.

Growers passed in 7.6% of the offering. 42,000 bales were rostered, however only 39,500 were offered with 36,584 bales sold. The past 2 weeks sales of 36,500 bales have been the lowest auction clearances since last September.

A review of export destinations for the year to date reinforces the reliance the wool market has on China. 74% of all wool exported has been to China, with India taking 6% and Italy and the Czech Republic taking 5% each.

The week ahead

The weaker market has seen the numbers cleared to the trade fall to the lowest weekly total since September last year, well below the season average of 42,300 per week.

Sales are scheduled for Wednesday and Thursday next week in all three centres with a total of 40,000 bales on offer. Sydney has a dedicated Superfine sale.

A review of the past month.

Time flows like water down the river rapids, we are now into February and the holiday season is now but a distant memory. January has come to an end, and it’s worth examining how the start of the year has gone.

The futures market has risen sharply in the past three weeks (figure 1), this has been as a result of a depreciating US dollar (discussed here) and weather concerns. The market is concerned about weather patterns in the US (see map), which show abnormally dry conditions across much of the country. Although still early in the season, the speculative short in the market as at close to record levels, which can lead to sudden swings in the market. Time will tell whether the weather risks, are enough to warrant a sustained rally or whether the large global stocks are enough to constrain pricing.

The A$ has been like a steamroller since the beginning of December (figure 2), with 81¢ being achieved last week. Whilst there has been

a modest fall, it has remained stubbornly above 80¢. The RBA have their first meeting of the year next week, and it is expected by most that rate will remain at current levels (1.5%). However, currency analysts are having divergent views on when rates will rise, with the following forecasts:

  • ANZ forecast two rises in 2018, with the first possible in Q2
  • Credit Suisse believe that there is the potential for a rate cut in 2018
  • UBS forecast no rate hike in 2018
  • Morgan Stanley forecast no rate hike in 2018, but a rise in 2019

I was asked this week why local prices have not moved in line with futures. The futures prices have rallied, at the same time as the A$. This takes some shine off when converting to a local value. However, the basis level has slid downwards since harvest. It has to be remembered that basis levels are still very strong, and technically we are actually receiving very strong prices compared to the rest of the world.

In recent months, we have discussed the reality of high basis prices and provided some advice on ways to lock in basis through a physical sale, and keeping exposure to the futures market. Those who followed this advice, have now benefitted from locking in a historically strong premium, and can now also benefit from futures rises.

I recommend reading the following article on, which briefly explains a number of strategies:

How to defer grain pricing

What does it mean/next week?:

As always at this time of year the market will be looking towards the weather, what does it have in store for the northern hemisphere crop. It is currently a balancing act between potential depleted production in 18/19 against record global stocks.

The RBA interest rate announcement will be made, it is likely to remain the unchanged and remain at record low levels.


Supply normal, prices stable, watching the sky.

After a significant spike to throughput for sheep and lamb at the start of January yardings figures have returned back within the normal seasonal range, combined with cool temperatures and a bit rain, prices have managed to hold firm for most categories of sheep and lamb this week.

The ESTLI barely changed, rising a slight 4¢ on the week to close at 637¢/kg cwt, similarly National mutton gained 4¢ to close at 407¢/kg. Table 1 highlights the Eastern States closing prices yesterday for a range of lamb and sheep categories with all but Merino lamb posting an increase.

East coast Restocker lambs staged a late rally jumping 30¢ yesterday to close the week up 9.7%, the best performer in the group. East coast Merino lamb the laggard, but only off 5¢ to register a 0.8% decline. A bit of a tussle between Victorian and NSW Merino prices this week, with Victorian Merino back above 600¢ after a 9.5% gain while NSW lost 4.3% to close at 582¢/kg cwt. In the West Trade Lambs the strongest category this week up 2.8% to 627¢, but still 10¢ shy of the ESTLI.

Figure 1 demonstrating that East coast lamb throughput has returned to more normal ranges, albeit it 27% above the seasonal average for this time in the year with just over 173,000 head yarded. A similar pattern displayed this week by East coast sheep with yarding levels sitting 20% above the seasonal average, but also within the 70% range, with around 70,000 head changing hands at the sale yard.

East coast lamb slaughter showing no signs of capacity issued despite the TFI disaster at Murray Bridge. SA lamb slaughter trekking well below average for this time of the season and sitting 38% under the seasonal average, understandably. However, some of the supply being taken up by Victorian and NSW meat works with the total East coast lamb slaughter running just 16% under the seasonal average – figure 2.

What does it mean/next week?:

A mixed bag for forecast rainfall into next week with the Western sheep rearing regions getting some good falls but most of the South-east missing out. However, BOM modelling for February shows a good chance of above average rain over the whole month for the South East and a very high change for continued rain in the West which is likely to provide further pricing support into the coming few weeks.