 In the past week there has been significant posturing from both the Donald, and North Korea threatening to bring ‘fire and fury’ upon one another. It looks like the USDA might have fired the first salvo, with the release of the August WASDE report. In this week’s comment, we will look at what the fallout has been.
The World Agriculture Supply and Demand Estimates were released overnight. The reports in the middle of the year can provide some surprises, this is due to the fact that this period of time clarity is being achieved on the northern hemisphere market. This month’s report did not disappoint in that respect.
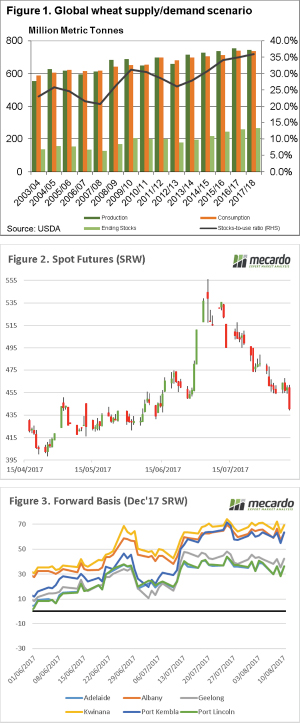
In articles in recent weeks, and presentations around the country I have commented that wheat quantity is not the biggest issue in the world. The main concern faced is quality, there are tightening stocks of high protein wheat around the world. This is reflected in the USDA report, which shows that wheat ending stocks for this year are to increase by 2% to 264.69mmt (Figure 1).
This is the highest world stock levels in history. Many may discount this number by the fact that China hold 48% of the world’s stocks. When we remove Chinese stocks, world stocks are still high. Since 1960, world stocks excluding China have only been higher in 8 seasons.
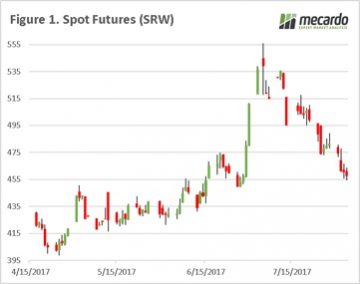
The report was more bearish than many commentators had expected, this has resulted in overnight prices diving (figure 2). In A$, the Chicago futures spot contract fell around $7, and have fallen A$55 since they mushroomed in late June/early July.
At a local level basis levels have remained somewhat stable over the past few weeks (figure 3) as buyers become reluctant to purchase at higher levels, and recent rains increase a small amount of confidence. Although there is still quite a way to go until harvest, and the crop could easily go either way.
Next Week/What does this mean?
The trade will be continuing to assess the impact of issues on the northern hemisphere, but as each week progresses more clarity is achieved and if nothing major happens upside (on low protein) is limited.
The key factor will be if Australia can achieve high protein wheat this harvest, and the rest of the world has a deficit then we are looking down the barrel of strong premiums. If the rain continues, and low proteins emerge from our crop then our prices and local basis will largely be driven by the domestic market.
 Last week we wrote about how the increasing tariffs on US Beef entering Japan is expected to have a small positive impact on export beef, and cattle prices. Obviously the support hasn’t been strong enough to stop price falling, but is the China import ban causing the fall?
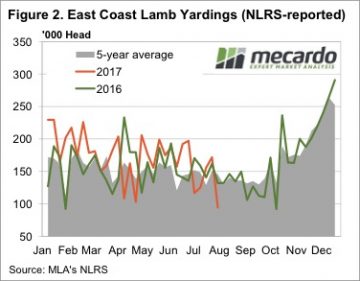
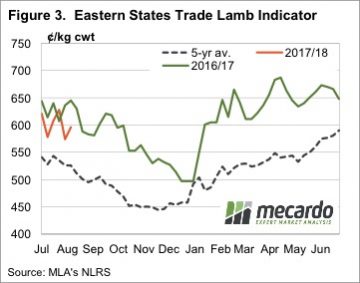
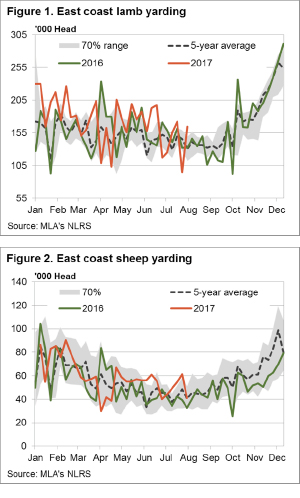 Some big moves again in East coast lamb and sheep yardings this week, heavily influenced by NSW flows, but for the most part prices around the country finished firmer. The headline, Eastern States Trade Lamb Indicator rising 1.3% to break back above 600¢ – although stronger gains were noted across other categories of lamb across the country.
 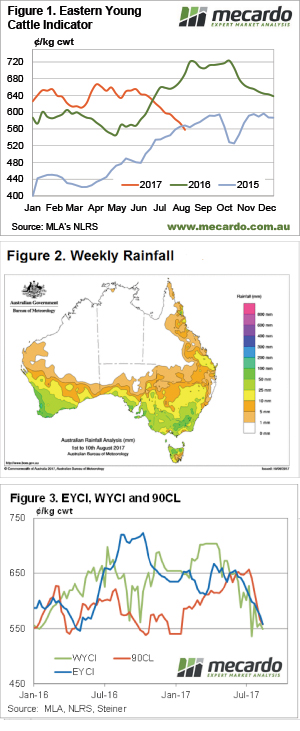 The slide in cattle prices continued this week, with more help from lower export prices, pushing the EYCI back to two year lows for this time of year. Rainfall across NSW and Victoria doesn’t seem to have helped the cause yet, as supply continues to outweigh demand.
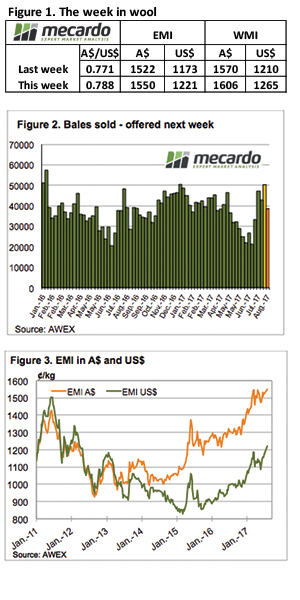 The three-week recess seemed to create pent up demand from the processors, with the larger offering and stronger A$ unable to dampen competition – the wool market had a good week. AWEX reported that buyers were bidding strongly from the outset to fill orders secured over the break.
 The first week in August. This month is one of the most important in the cropping year, as we will have increased certainty on the rest of the world’s crop, and start to gain greater clarity on how good (or bad) Australia is going to be come December. It is the knife edge time of year.
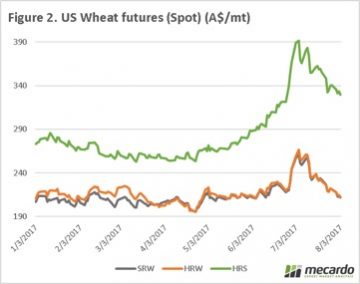 At a local level flat price around the country have fallen since a peak on the 11th of July (figure 3). During the first week of July all port zones were able to achieve historically competitive prices, however few growers have taken advantage of the prices available. Since the 11th, across all ports in figure 3, the price has dropped by $32 per mt.
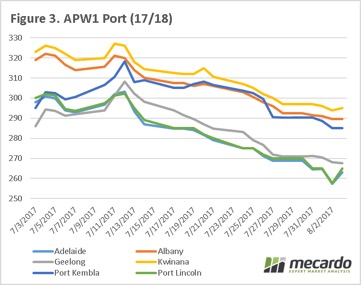

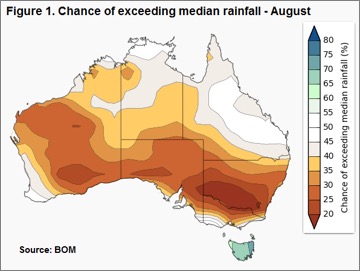 Figure 1 highlights the chance of rainfall exceeding the median levels for this time of year, and it looks particularly unfriendly to southern NSW. Despite much of Queensland enjoying a rosier picture, cattle prices here were among the softest this week with QLD Heavy and Feeder steers bearing the brunt of the negative sentiment – off 6.6% (260¢/kg lwt) and 6.2% (308¢/kg lwt) respectively. Meanwhile, Victorian saleyards registered Feeder steers and Trade steers as their weakest two categories, down 6.2% (301¢/kg lwt) and 4.2% (302¢/kg lwt) between them. In defiance of the BOM outlook the NSW markets were reasonably flat on the week, apart from Medium Cows, marked down 4.3% to 208¢/kg lwt.
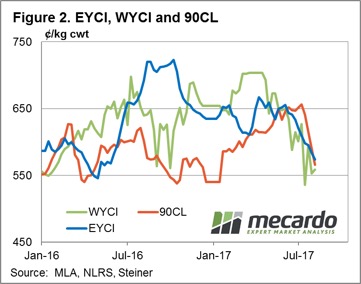 Some reasonable rainfall is noted for much of WA and Victoria next week, but much of the rest of the country is expected to miss out again. A key factor for the EYCI to find a bit of a base in the next few weeks will be the movement in the 90CL and the A$.
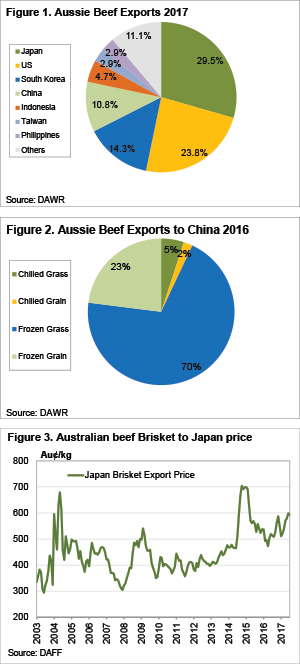
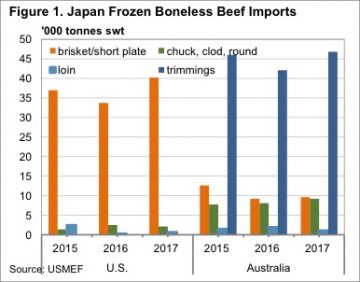 According to the US Meat Export Federation (USMEF), who have produced an excellent fact sheet, a vast majority of US frozen beef exports to Japan are grainfed brisket and short plate cuts. These cuts are used in gyudon beef bowl chain restaurants.
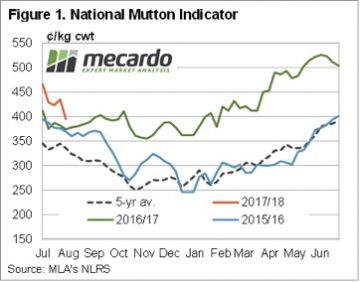 While mutton markets have participated in the decline in ovine markets since mid-June, unlike lamb markets, mutton values have managed to remain strong relative to last year’s levels. Figure 1 shows the National Mutton Indicator (NMI), which last week fell to a six month low of 395¢/kg cwt.
 In 2016 the mutton market eased a little, but found solid support at 350¢ as the good season and flock rebuild supported prices. From 2012-2015 the NMI averaged 230¢/kg cwt in October, so it’s the exception for mutton to be valued at better than 300¢ in the spring.
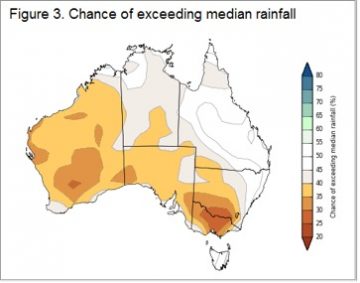 Obviously there is no guarantee that Australian sheep areas will have a dry spring. The BOM have been in pretty good form this year, and their latest forecast doesn’t paint a rosy picture (figure 3). Simply based on historical mutton prices during strong supply, we would put the NMI in the 200-250¢/kg cwt range.
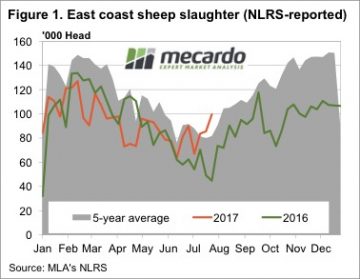 Figure 1 shows the rapid increase in sheep slaughter over the past month. This is a sure sign of moisture stress for sheep growers. Lambs can’t be offloaded as they are not ready, so it is sheep which are hitting the market, most likely wethers. Sheep slaughter for the week ending the 28th July was the more than double the same week in 2016, and the highest level since 2013, but only marginally beating 2014.