
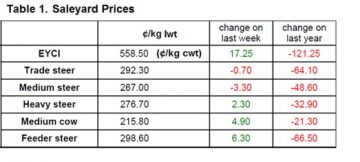
 The Eastern Young Cattle Indicator (EYCI) lifted again this week, recovering a further 3% to see it close at 558.50¢/kg cwt with some good rainfall to much of Queensland providing a bit of a boost. Gains noted too across the East coast for Heavy and Feeder Steers, up 1-2% to round out a reasonably firm performance for cattle markets.
Table 1 outlines the week on week and year on year performance for a selection of cattle prices as at this weeks close, with marginal weekly falls noted for Trade and Medium Steers. Interestingly, a comparison of young cattle prices to finished steers from this time last year shows that the EYCI currently sits 17.8% below where is was last season, while Heavy Steers are just 10.6% softer.
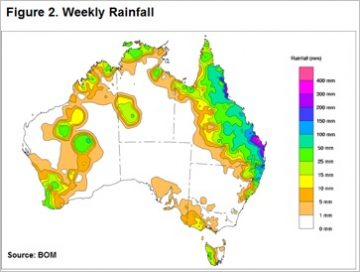 It points to how much optimism was sapped out of restocker buying activity during the Winter dry spell, but that may change if the northern rains continue and NSW starts to get a bit of decent rainfall too. Figure 2 shows the national rain tally over the last week with Queensland the clear beneficiary and next week’s forecast calls for a continuation across much of the north and spreading into NSW which should continue to support demand for young cattle by restockers.
Indeed, our analysis piece released earlier this week took a look at how the October rains may assist prices for the remainder of the year, in a similar fashion to the 2011 season. Click here to recap on the report.
Additional support for young cattle prices is likely to come from a narrowing of the current discount spread of the EYCI to the 90CL beef export price. Given the tightness of supply experienced this year the spread discount wouldn’t be expected to widen much further from current levels – figure 3.
The week ahead
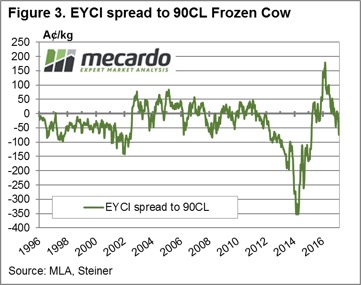 After a recent lift the 90CL is knocking on the door of 600¢/kg CIF again and with the Bureau forecast of a fairly normal November rainfall pattern and a good chance of a slightly wetter than average December all indications are for continued support for young cattle prices in the coming weeks.
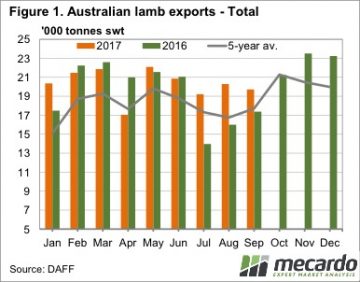 Last week we spent a couple of articles looking at the interesting price phenomenon that we are currently seeing in lamb markets. Strong prices continued last week, in the face of strong supplies, so today we take a look at the export data to see where the extra lamb is going.
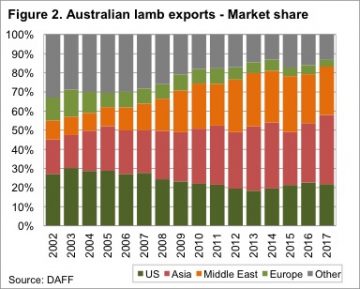 A simple indication of increased demand is the fact that in 2014 the Eastern States Trade Lamb Indicator (ESTLI) averaged 459¢/kg cwt from July to October. This year the ESTLI has averaged 604¢/kg, 31% higher.
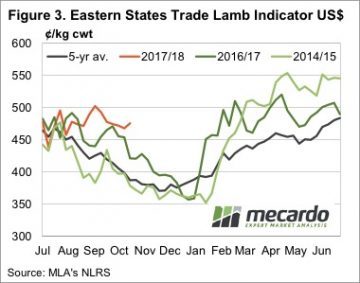 We have in the past seen significant jumps in lamb demand from exports markets, and we might now be seeing early indications of the next one. Significantly larger export volumes, coinciding with similar or stronger prices suggests that consumers in the US, Middle East and Asia have become comfortable with the higher lamb prices seen over the past nine months.
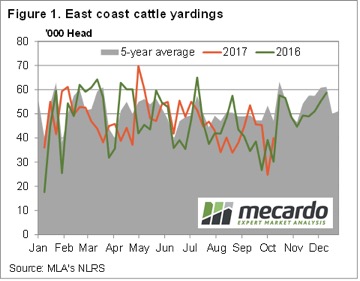 There was a significant jump in yardings this week, but this failed to dampen cattle prices, which continued to rally. In fact, it seems to be rain that is doing the opposite of dampening prices, with prices finding strength, almost across the board.
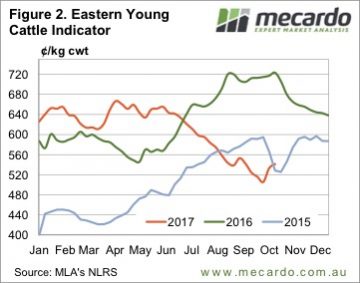 The Eastern Young Cattle Indicator (EYCI) continued to rally, but the pace slowed. The EYCI gained 8¢ this week, to lift it to the levels of five weeks ago, at 541.25¢/kg cwt (Figure 2).
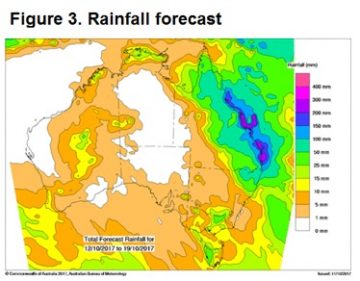 The forecast says there is more to come for at least half of Queensland (figure 3), and this suggests that there is only one way for cattle prices to go next week, especially young cattle prices.
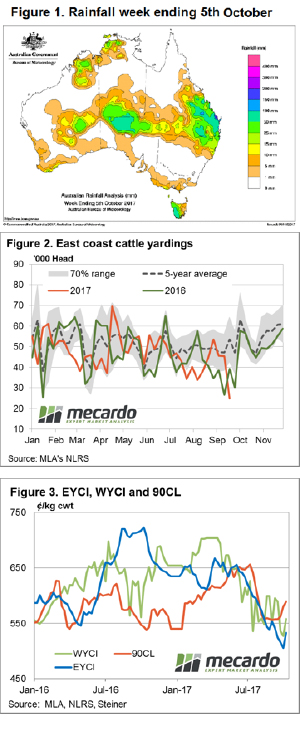 The Mecardo team have been suggesting a price bounce was imminent for the last few weeks given the rainfall forecast, recovery in export prices and falling supply at the saleyards. But as the old trading adage goes, “even a broken clock gets it right twice a day” so we won’t puff out our chests too much on this one.
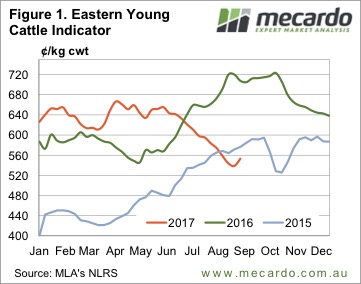 Young cattle prices gained some ground this week, for the first time in some while. The Eastern Young Cattle Indicator (EYCI) has fallen for 12 weeks without any real break. This week the break came, with the EYCI gaining 14¢ to move back to 553¢/kg cwt. Is it a dead cat bounce or a sustainable rally?
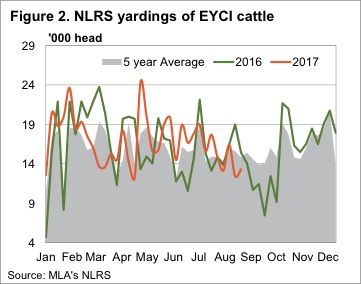 The 90CL Frozen Cow price has tracked sideways for the fourth week in a row and both the EYCI and Western Young Cattle Indicator (WYCI) have met it at around 555¢. Figure 3 suggests it’s hard to argue that falling beef export prices aren’t driving the cattle price.
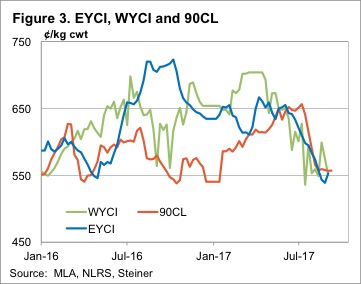
 At Mecardo we regularly refer to the 90CL frozen cow indicator as a key beef export price benchmark when undertaking analysis of the domestic market prices in relation to overseas markets. This is because a strong long-term correlation exists between indices like the Eastern Young Cattle Indicator (EYCI) and the 90CL. We often get asked to explain what the 90CL actually is and what influences its movement – this will be addressed in this piece.
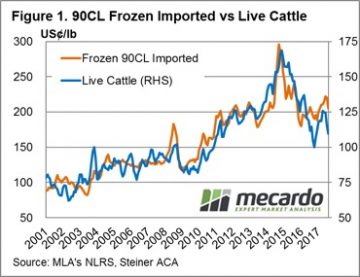
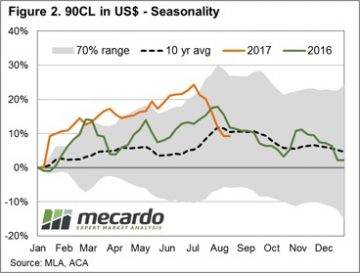 Therefore, it should come as no surprise that the influence of the broader US cattle market on the price of the 90CL is fairly strong. Indeed, as highlighted in figure 1, the movement of US Live Cattle futures is closely mirrored by the movement in the 90CL. Analysis of the monthly average price of US Live Cattle to the 90CL since 2001 shows a correlation measure of 0.9139 which suggests that nearly all of the movement in the 90CL can be explained by the fluctuations of the US Live Cattle market.
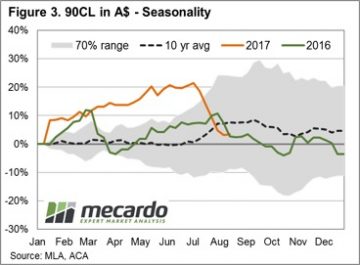 Compared to current US Live Cattle levels the 90CL in US terms seems a little overvalued, and the normal annual pattern heading into the remainder of the season shows that the 90CL usually begins to decline beyond the US grilling season peak around July/August.
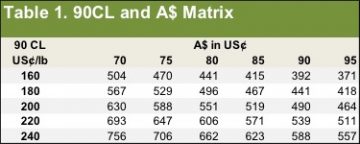
 Technical analysis isn’t a strongpoint, but we do know that when the pace of a rally, or a decline, slows, the market is usually getting close to changing direction. Over the 12 weeks to last Friday the EYCI has fallen 112¢ at a rate of 9.3¢ per week (figure 1).
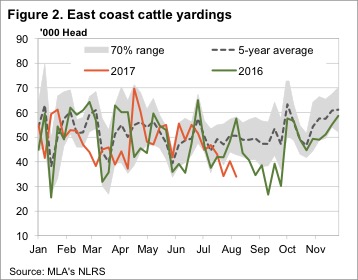 Weakening prices amid weakening supply is a pretty good indicator of weaker demand. For young cattle we can blame restockers, who have pulled back after driving the market for two years. For finished cattle the abundance of cattle on feed is helping to keep a lid on finished cattle values.
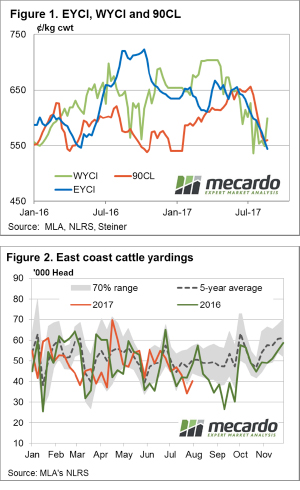 National Trade Steers holding up reasonably well this week, supported by price lifts in Queensland, as most other categories of cattle take the lead of the Eastern Young Cattle Indicator (EYCI) and continue to probe lower. Although, prices out West and in Victoria buck the trend as continued rain provides a bit of support.
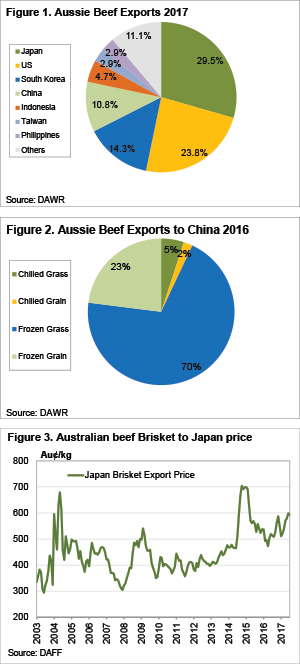 Last week we wrote about how the increasing tariffs on US Beef entering Japan is expected to have a small positive impact on export beef, and cattle prices. Obviously the support hasn’t been strong enough to stop price falling, but is the China import ban causing the fall?
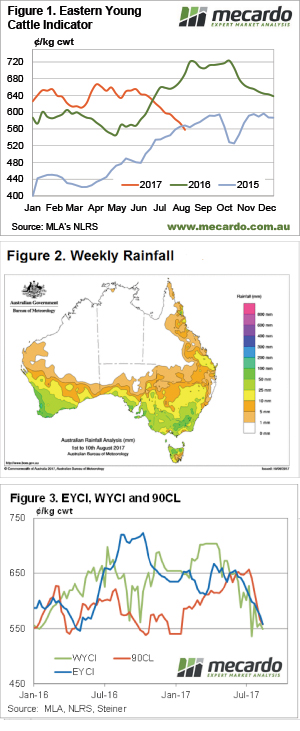 The slide in cattle prices continued this week, with more help from lower export prices, pushing the EYCI back to two year lows for this time of year. Rainfall across NSW and Victoria doesn’t seem to have helped the cause yet, as supply continues to outweigh demand.