Weekly east coast cattle slaughter draws closer to this seasons peaks and throughput eases as producers respond to lower cattle prices with all national cattle indicators and the Eastern Young Cattle Indicator (EYCI) all registering declines this week.
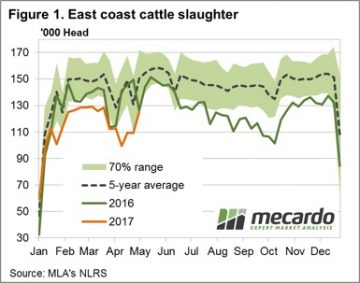 In contrast to the declining throughput and price movements, weekly East coast slaughter for the period ending 5th May still managing an increase from the previous week’s numbers as processors increase activity post the shortened Easter and ANZAC holiday periods – Figure 1. Weekly cattle slaughter rising 14.5% to just over 125,000 head, not far off the peak slaughter levels experienced during March.
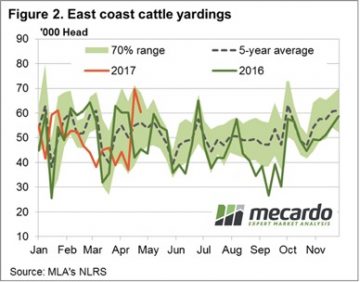
After the spike in throughput along East coast saleyards last week producers respond to the softer price pattern with an 13.5% fall in yardings noted to see 60,332 head change hands. Despite the decline yardings reported this week still the second highest weekly figure so far this season and at the higher end of the normal seasonal range for this time of the year, suggesting that demand remains relatively firm as the price declines haven’t been excessive – figure 2.
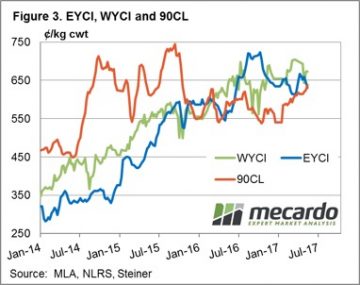
 Indeed, the Western cattle markets were broadly stable, while only marginal declines cited in the East for young/store cattle. The EYCI down a mere 1.5% on the week to 634¢/kg cwt – figure 3. In national markets, trade steers less than 1% softer (345¢/kg lwt), feeder steers declined 1.8% (342¢/kg lwt), while medium cow shed a mere 2.1% (216¢/kg lwt). The more moderate falls reserved for the heavier end with medium steers leading the charge recording a 5% fall at 292¢/kg lwt, while heavy steers (not so heavy it seems) posting a 2.6% drop to 293¢/kg lwt.
The week ahead
As figure 3 outlines, a firmer 90CL beef export price as the US market demand begins to fire up should lend some support to cattle prices into next week. The 90CL another 2% higher to close at 637.6¢/kg CIF should start to provide some enthusiasm to processors. The 90CL posting a fourth successive week on week gain and has lifted 3.9% since mid-April.

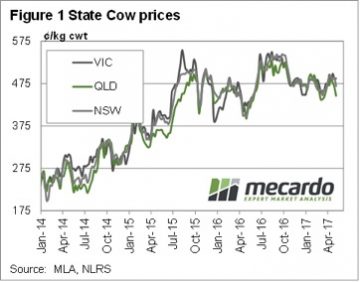 The current margin on cows for processors comes in at negative $34 per head. The margin model is based on a cow weighing 500kgs liveweight, or 260kgs carcase weight. Basically the loss being worn by processors at the moment equates to 13¢/kg cwt.
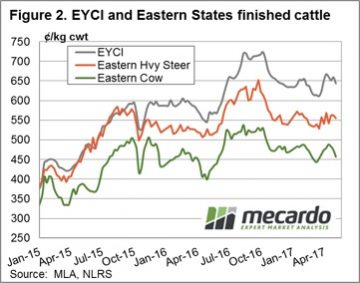 In fact, prices in Queensland are nearly there, sitting at 446¢/kg cwt last week (figure 1). There is still upside potential for cow prices over the coming months, with the prospect of tight supply sending processor margins toward the $150 losses seen last year. To reach these deeply negative margins under current beef prices, cows would have to make 520¢/kg cwt. Last winter and spring cows were making 540¢, so this is not out of the question.
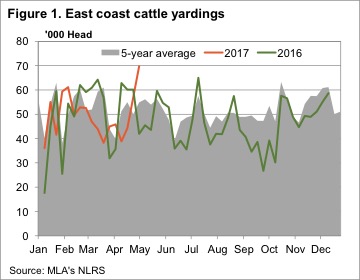 Figure 1 shows east coast cattle yardings rallied an enormous 87% on last week, and 52% on the last full week of sales. With yardings this week hitting 69,737 head, we had to go back to the second week in December 2015 to find larger supply.
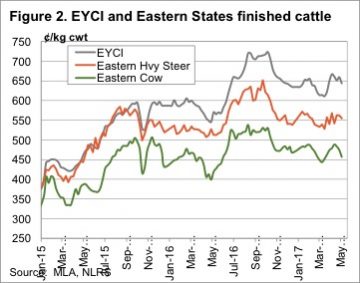 There were no issues with supply hitting prices in WA, where the Western Young Cattle Indicator rallied 30¢ to 673¢/kg cwt. Supply tends to only get tighter in WA at this time of year, which should keep prices at the upper end of the range.
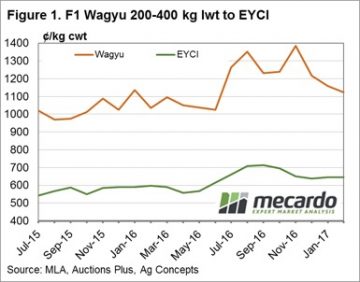 As it is international Star Wars day (May the fourth be with you) and the Australian Wagyu Association’s conference being held in Albury this week we couldn’t resist both the pun and the focus on Wagyu premiums over comparable young cattle, based off the Eastern Young Cattle Indicator (EYCI) underlying data.
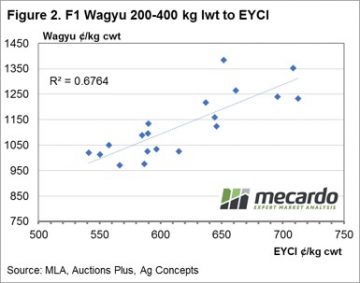 An analysis of the percentage spread that has been achieved by F1 Wagyu cattle within the same weight range of EYCI cattle shows an average premium of 83% has been attained since July of 2015 – figure 3. Although the percentage spread can vary at any given time the 70% range between a premium spread of 72%-94% (green band) highlights where the series has fluctuated for 70% of the time. The two red dotted lines between 61% to 104% give an indication of the 95% range (two standard deviations away from the average for the statistically minded reader) and gives an indication of when the spread is nearing historically extreme levels.
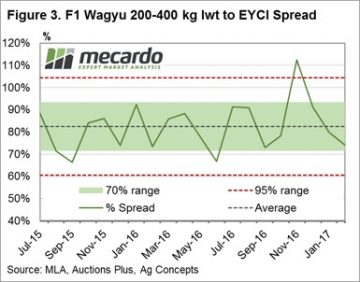 On average, the F1 Wagyu producer can expect to receive a premium spread between 75-95% above the EYCI most of the time. Recent discussions with Wagyu F1 producers indicated that forward basis agreements had been under negotiation with processors to determine an EYCI plus an agreed percentage spread as a settlement price when cattle were due for delivery. This historical spread analysis will give an idea of what type of premium for F1 Wagyu cattle above the EYCI is within a fair and reasonable range.
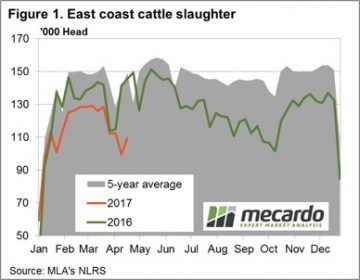 Figure 1 shows the seasonal pattern for East coast slaughter for the week ending 21st April. While the numbers don’t yet represent the shortened ANZAC week it is still clear to see the recovery in supply after the Easter dip. East coast slaughter for the week rising to 109,500 head, a 10% increase from the previous release.
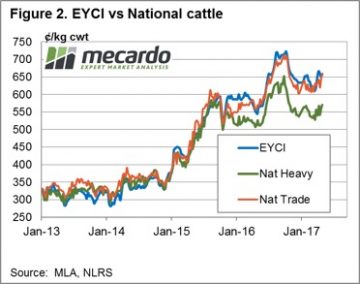 A forecast for some light rainfall for parts of Queensland and Victoria over the next week shouldn’t be enough to hamper transport so supply of cattle should continue to improve post Easter. Meanwhile, reduced beef cold storage levels for April in the US as they head into their “grilling season” should see the beef export prices supported in the coming weeks and will provide some encouragement to local processors on any price dips. These two factors set the stage for some price consolidation around the 650¢ level for the EYCI in the short term.
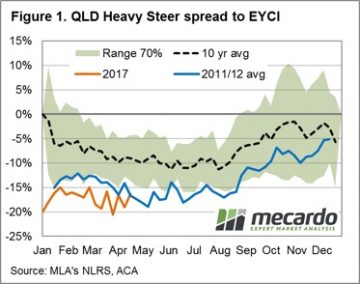 During a favourable season optimism runs high among restockers and opportunistic cattle traders supporting demand and prices for store/young cattle. The added buying competition between the three main purchasing groups (restockers, lot feeders and processors) will often see the Eastern Young Cattle Indicator (EYCI) outperform the price patterns for finished lines, as there is really only one buyer type for fat cattle – the processor. This piece will take a look at what can be expected for the spread pattern between heavy steers and the EYCI along the East coast for the next six months.
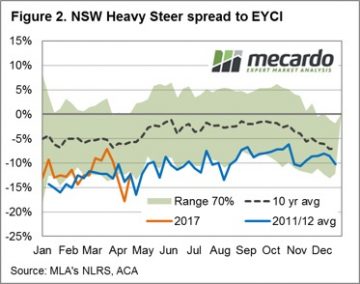 Interestingly, so far for the 2017 season the spread pattern in all three states has been following a similar trajectory to the 2011/12 average pattern. In addition, each state’s spread pattern for this season is trending close to the lower end of the 70% banding, reflecting that the favourable conditions have supported young cattle prices more than the price for finished cattle. Perhaps somewhat unsurprisingly the state that was hit hardest by the most recent cattle turnoff, Queensland, is experiencing the widest spread between young and finished cattle as the requirement to rebuild the herd is likely to be most evident in that region.
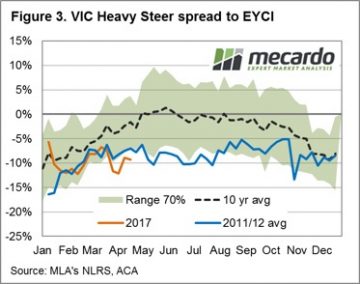 It is likely the spread patterns for each state will continue to trek along the lower end of the 70% band for much of the second half of the year. However, as the confidence level on longer term climate predictions for the 2018 season grows into the later stages of 2017 spreads may begin to return to more normal levels, particularly if the transition from a wetter to drier climate cycle becomes more evident.
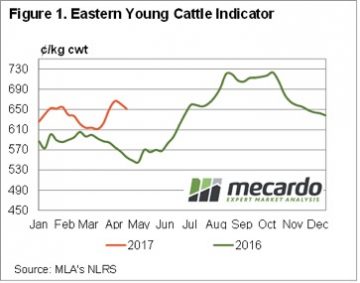
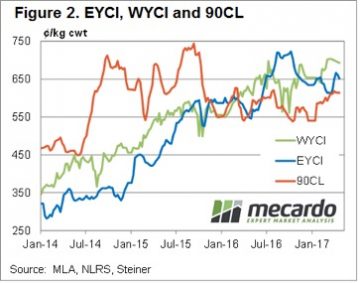 Figure 2 also shows the 90CL export beef indicator holding onto a price around 20 month highs. This week the 90CL sits at 614¢/kg swt, supported by tight supply from Australia and New Zealand.
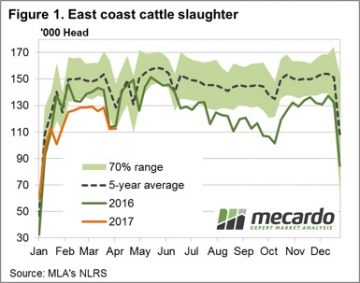 Figure 1 shows the pattern for East coast slaughter, with marginal week on week change as just over 112,000 head processed. The Easter dip in slaughter levels seeing numbers processed that were not too dissimilar to this time last season. Although for most of this season slaughter figures have been trending around 10% below the 2016 levels.
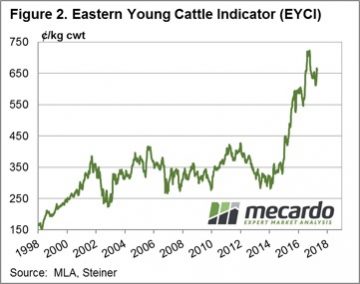 February. The increased yardings resulting in a slightly softer EYCI this week – figure 2.
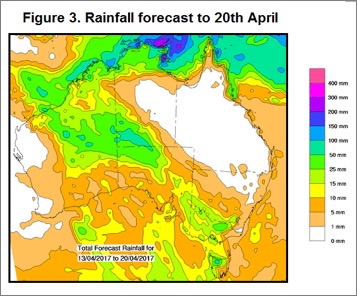
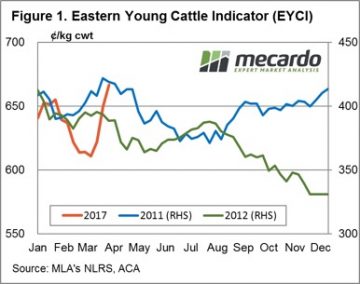 The 2016 season was without doubt the wettest for the nation since the 2010/11 deluge and has been the underlying cause of optimism among restockers, encouraging a rebuild of the herd and supporting young cattle prices to record highs. The recent rains have provided a boost to cattle prices over March – but could the prospect of a dry second quarter in 2017 and 50/50 chance of El Nino developing later in the season signal the beginning of the end for further increasing cattle prices?
 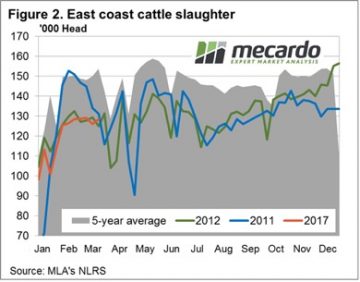 Figures 1 and 2 highlight the price and slaughter patterns comparing the current season to the 2011 and 2012 years. Interestingly, all three seasons have seen price increases for the Eastern Young Cattle Indicator (EYCI) over February/March. While the 2017 rally looks impressive, in percentage terms it is not too dissimilar to the gains recorded during 2011. The EYCI rose 8.2% over February/March 2011 compared to the 8.6% gain seen this year, albeit over a shorter timeframe. In terms of the weekly slaughter pattern there was a bit more volatility in the series during the first half of the year in 2011, although the 2012 pattern has been a reasonably good template for the current season, so far.
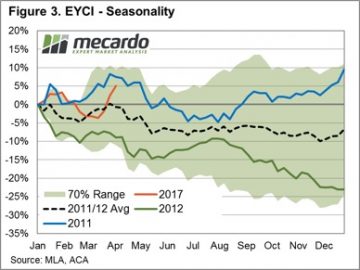 Figure 3 focuses on data from the last two transitions from a wet to dry period and how the percentage price movement of the EYCI responded over the season. Overlaid on the chart is the percentage price patterns for 2017, 2011, 2012, an average of the 2011 and 2012 pattern and a potential seasonal range (calculated from the most recent five seasons that experienced a shift from wet to dry conditions).
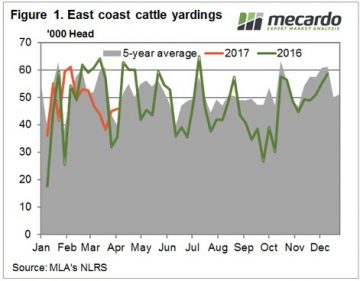 Figure 1 shows that the strong prices failed to draw out more cattle this week, with East Coast cattle yardings increasing just 1,300 head. Cattle yardings were down 28% on the same week last year. In fact almost every week of autumn (except for Easter) 2016 saw yardings above 60,000 head. Over the last 8 weeks cattle yardings haven’t managed to crack 52,000 head.
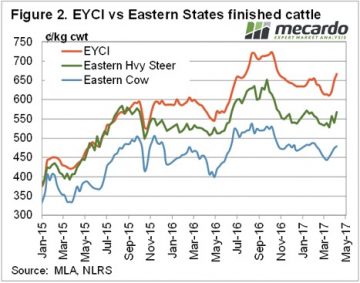 Slaughter cattle prices haven’t managed to hit new 2017 highs yet. Heavy steers bounced back this week, gaining 27¢ on the east coast to sit just below the opening price of 2017, at 568¢/kg cwt. It’s s similar story for Cows, with prices sitting a few cents below the February high.