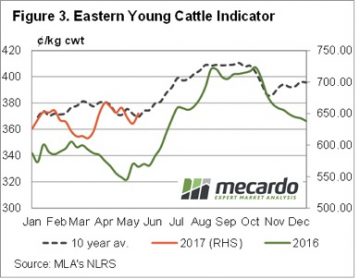
 Here’s a quiz question. When was the last time the Eastern Young Cattle Indicator (EYCI) finished June lower than it started? You’ll have to read the article to find out….
Young cattle markets continued to slide this week, the EYCI dropped another 12¢ to finish the week, and the month at 621¢/kg cwt. Dry weather and historically high prices appear to be driving cattle to market as a time when supply is usually tightening.
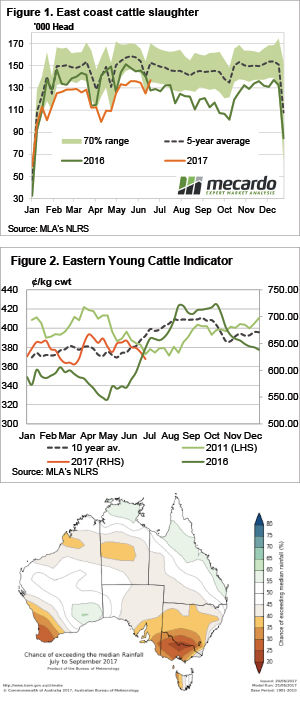
Nothing exceptional is happening with cattle yardings, they were down a touch this week, and largely in line with the same week of the last two years. Cattle slaughter is doing strange things however. In the week ending last Friday, east coast cattle slaughter reached a peak for 2017, setting a 7 month high.
Figure 1 shows MLA’s weekly cattle slaughter figures hitting 137,019 head, 7% higher than the same week last year. It was also the first time weekly slaughter had been higher than the previous year since this exact week back in 2015.
If something sounds familiar, but backwards, it’s because we have been banging on in recent weeks about prices falling below the same time last year for the first time. It was the EYCI’s turn this week (figure 2), posting a lower price than the same week in the previous year for the first time since March 2014.
It’s always a nice fit to see stronger supply than last year equating to weaker prices. It tells us demand is relatively steady, with price being governed by supply.
The week ahead
The answer to the question is given away in figure 2. In 2011 the EYCI finished June lower than it started, by 24¢. This year it was 34¢. It also happened in 2003, so that’s 3 out of 18 years cattle prices have fallen in June. It’s not a regular occurrence. The good news for cattle producers is that in 2011 prices levelled out, but figure 3 shows this might just be the start of the slide.
 A good recovery staged by Queensland across the board, while NSW disappoints… no I’m not talking about the State of Origin – although the phrase fits there too! Actually, it’s the cattle market this week. Despite the national market indicators posting largely flat results, with weekly moves of less than 2% either way some state based indicators saw more substantial action.
 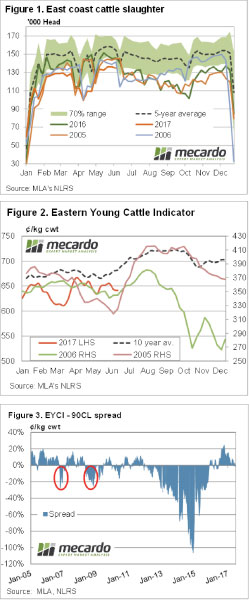 Whether or not you believe the Bureau of Meteorology (BOM) three month forecast, there is always the chance the current dry spell could continue. Dry winter’s and springs are not great for cattle prices, but given the current historically strong values, how bad could it get?
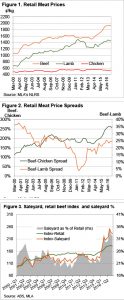 It doesn’t matter how tight cattle supply is, beef still lies on a demand curve, where consumers will eat less beef as prices rise. While Australian beef prices are largely governed by export markets, the domestic consumer is still our largest single market for beef. This week we take a look at the latest retail meat values, and what this might mean for cattle prices.
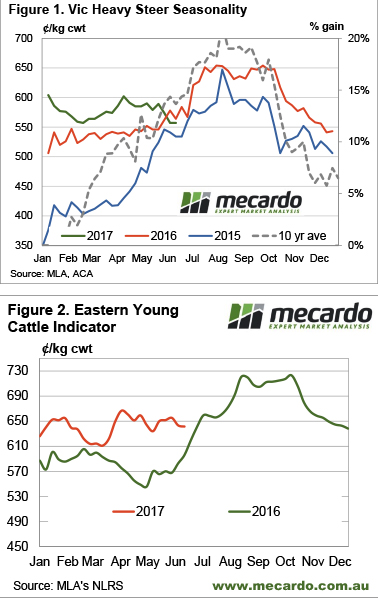 It hasn’t happened to the Eastern Young Cattle Indicator (EYCI) yet, but we have a few slaughter categories which have moved below year ago levels. It’s been a while since producers were getting less money than the year before, in fact it’s been three years, but is anyone complaining?
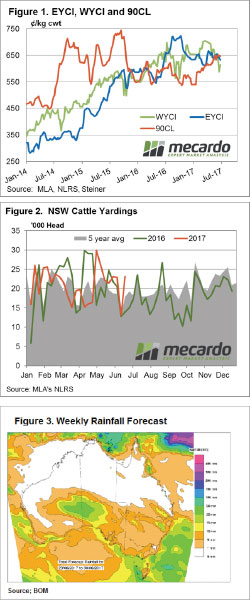
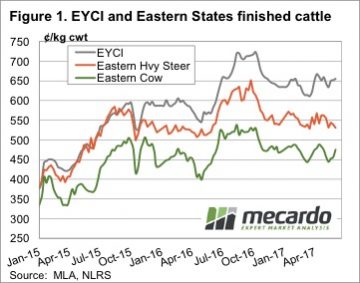
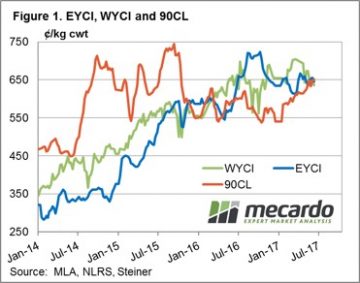 The Eastern Young Cattle Indicator (EYCI) just 1.8% softer to close at 643.25¢/kg cwt. It’s Western cousin a touch heavier with a 2.3% fall to 635¢, while the key beef export benchmark 90CL frozen cow managed a slight 0.9% gain to 652¢/kg CIF – figure 1.
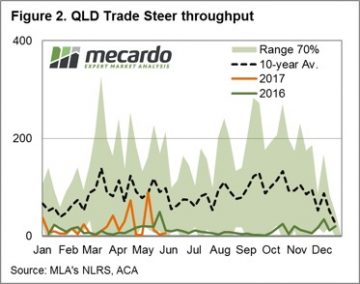 The sideways price action demonstrated by most cattle categories somewhat unsurprising given the broadly unchanged weekly slaughter and yardings numbers. East coast slaughter for the week ending 2nd June only 83 lower than the prior period and just shy of 136,000 head. East coast yarding posting a 1.8% gain on the week to see 54,940 head change hands – figure 3.
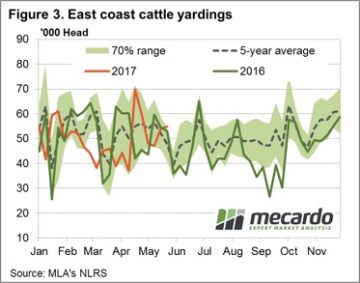
 The fundamental international market news was bullish this week, but markets seemed to focus more on local issues. Broader indicators managed hold their ground, or even rally a bit, but at the state level there were some heavy price declines.
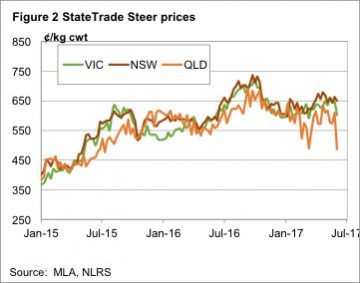 Restockers pushed the EYCI higher, as shown in figure 1, it gained 4¢ for the week to hit 655.25¢ a five week high. Cows also rallied, while heavy steers fell.
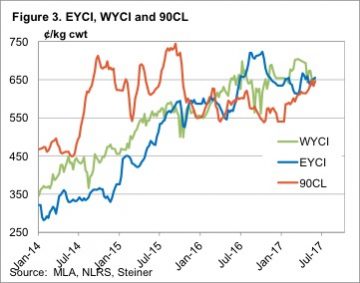 In WA the Western Young Cattle Indicator (WYCI) gained a couple of cents to sit at 650¢/kg cwt. Figure 3 shows an interesting convergence. The EYCI, WYCI and 90CL indicator all sitting between 645 and 655¢. The last time we saw this was in March 2016.
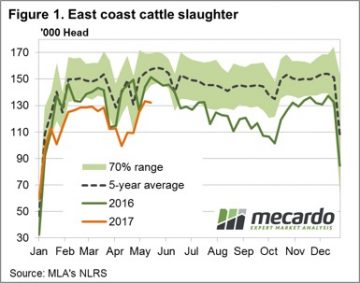 East coast slaughter, for the week ending 19th May, recording a marginally softer result for the week at 132,392 head – figure 1. Most of the East coast states registering a decline in slaughter, although as figure 2 shows NSW slaughter still peaking for the season with 32,268 head recorded. NSW slaughter likely to start the seasonal decline from here though as supply tightens into the Winter period.
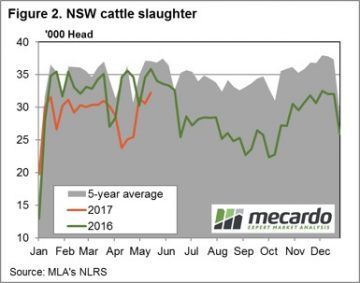 Most national categories of cattle price movements were pretty uneventful this week, although Medium Steers dragged down by SA figures. The National Medium Steer closing the week 4.6% softer to 292¢/kg lwt, Queensland Medium Steers unchanged at 286¢ and NSW/Victorian Medium Steers only 2-3% softer. The killer punch for the national figures coming from SA Medium Steers, down 14.9% to 294¢/kg lwt.
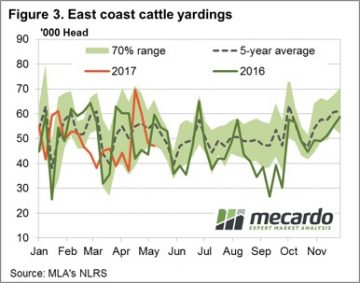
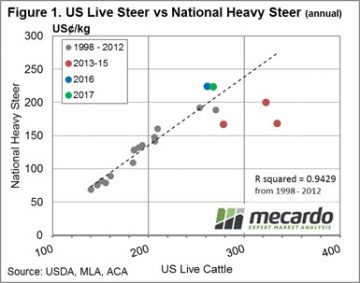 Just as there is a reasonably strong correlation between the annual average EYCI price and the annual average 90CL beef export price, the same holds for annual average prices for US Live Cattle and National Heavy Steer prices. Indeed, as highlighted in figure 1, annual price data for both series converted into US¢/kg from 1998 to 2012 demonstrates a very close relationship. Clearly, the poor seasonal conditions and high turnoff locally for cattle during 2013-15 had an impact on local Heavy Steers prices, remaining in undervalued territory for much of the period (red dots below the line of best fit).
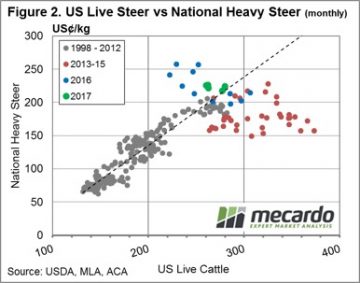 This situation can be seen more clearly by taking a look at the monthly average price comparisons between US Live Cattle and Heavy Steers – figure 2. Interestingly, recent improvements in US Live Cattle prices during March/April 2017 have meant that local Heavy Steer prices are much more in line with what could be considered normal long term levels, as identified by the green dots for the 2017 season moving closer toward the line of best fit.
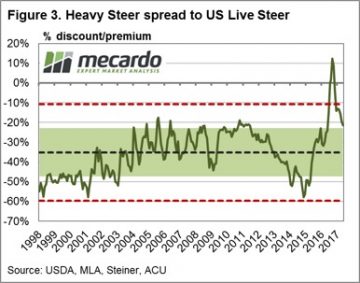 Currently the rebound in US Live Cattle Futures has seen the discount spread return to just above the top of the “normal” range at around 21% discount. While still some way off from the longer-term average spread discount of 35%, it has taken some of the topside pressure off local Heavy Steer prices that would have been evident when the spread was sitting at a premium during late 2016.
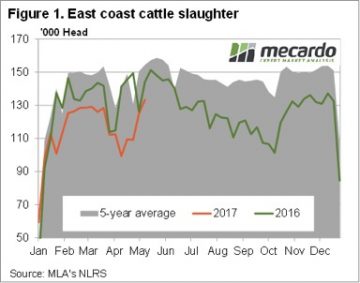 Figure 1 shows that east coast cattle slaughter reached its strongest level since December in the week ending the 12th of May. It’s interesting that this is around the time cattle slaughter traditionally peaks, as cattle out of Queensland bolster stocks.
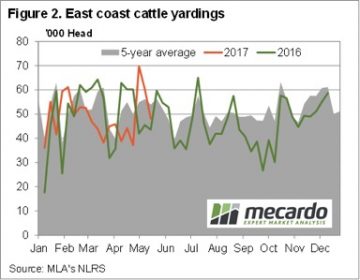 While it is difficult to envision the EYCI getting back to 700¢ this winter, the 90CL export price is doing the right thing, having rallied to 650¢/kg cwt. In fact, the EYCI and 90CL are back at level pegging for the first time since this around this last year.