Tag: Cattle

That sort of increase in supply will do that

Strong cattle prices have seen more cattle drawn out. With Meat and Livestock Australia’s (MLA’s) weekly slaughter data for last week showing a 2017 high. It seems things settled a bit this week, but rising export meat prices are at least supporting cattle prices.


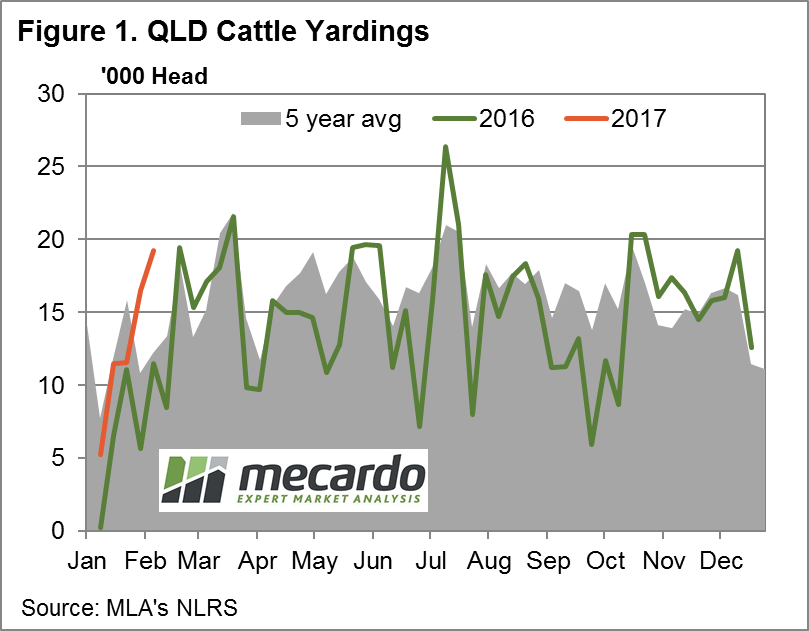
In last week’s cattle commentary Matt noted the strong yarding’s in Queensland, which resulted in the Eastern Young Cattle Indicator (EYCI) losing 19¢. MLA’s slaughter figures for last week, released on Monday show that the increased supply in the yards was also reflected at processors works.

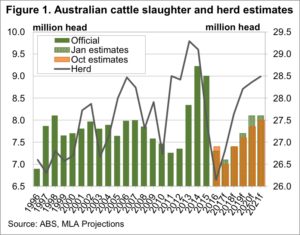
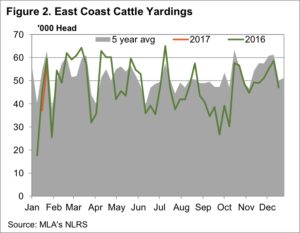
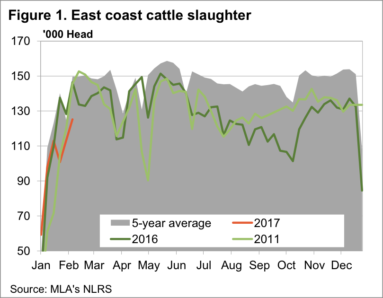
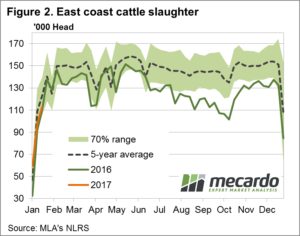
Cattle slaughter on the East Coast for the week was up 11% (figure 1), and just 6% below the same week last year. In Queensland slaughter was up 22% on the previous week, and 10% on last year. Dragging the chain was Victoria and SA, and to a lesser extent, NSW, which were down 29, 27 and 6% on last year respectively.

It remains a bit confounding that the supply dearth is concentrated in the southern states, given that the herd liquidation, and subsequent rebuild, should be concentrated in the north.
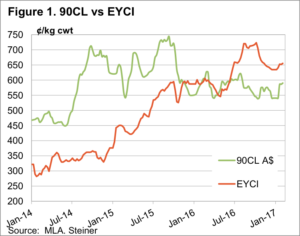
There is some good news on the export front. Frozen Cow 90CL export prices managed to gain some ground this week, hitting a six month high of 591¢/kg swt, (figure 2) despite a rising exchange rate. The EYCI premium to the 90CL has hit an 8 month low of 44¢. Strong support for the EYCI is only 50¢ away.

The week ahead
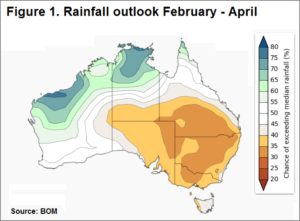
Key cattle areas in Queensland and Northern NSW are expected to get good rain over the coming week. This should reduce yarding’s and provide some support for young cattle prices in the short term.

Finished cattle prices usually rise at this time of year as supply wanes. This usually lasts until mid-April, when prices ease. This will be the first test of the market, but strong export prices will limit downside.

Export prices to Japan finding support for now

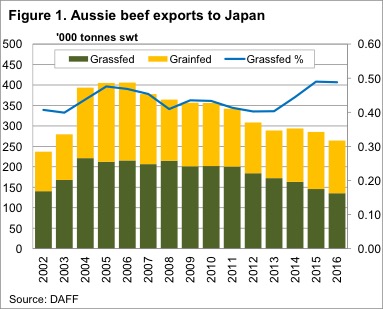
Prices for beef exported to Japan has been easing of late, which is a bit of a concern, given Japan is our major high value export market. With Japanese beef export prices sitting on a key support level, we take a look at what might happen to markets if prices break lower.

In 2016 just under 26% of Australia’s beef exports went to Japan, totalling 264,325 tonnes. Figure 1 shows that Australia’s beef export to Japan have been on the decline for the last 10 years. Declining export volumes to Japan have been largely due to the US increasing market share after being locked out of Japan from 2004 to 2006.
Not surprisingly there has been more grainfed beef displaced in Japan, than grassfed beef. The US export exclusively grainfed beef to Japan, and as such Australia is still the main source for grassfed beef.

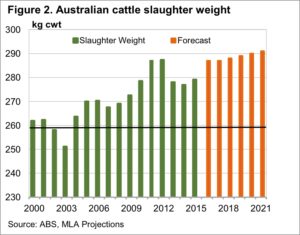
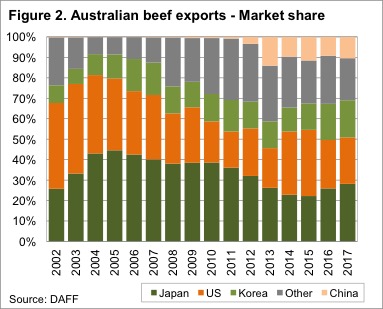
Australian beef has also found markets other than Japan, where the value is similar. The ‘other’ markets, mainly South East Asian Countries, and China, have increased their share of Australian beef exports to 31% in 2016, up from 12% in 2007 (figure 2).
Regardless of the shift in export destinations, Japan still remains a very important market for Australian beef, and changing prices there will impact cattle prices in Australia, eventually.

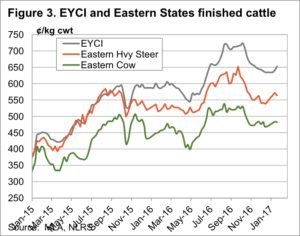
Figure 3 shows the price of Grassfed Fullsets exported to Japan, along with the 90CL Frozen Cow exported to the US, and the monthly average National Heavy Steer Indicator. Since November the Grassfed Fullset has fallen nearly 9%.

A majority of the price fall occurred in December, as US beef imports increased 9% on November, and a massive 31% on the previous December. Australian beef supply was also larger in December, up 3% on November, and 17% on December 2015.

The Grassfed Fullset price currently sits at 834¢/kg swt, which as shown in figure 3, is still 27% stronger than 2014, and 48% above the 2010-2013 average. Despite the fall in US cattle prices, and further shrinking of our market in Japan, beef export prices to that destination are finding solid support at 800¢/kg cwt.

Key points:

  • Australian Beef exports to Japan have been shrinking, with grassfed beef gaining a larger proportion.
  • Beef export prices to Japan have eased in recent month, now sitting on key support levels.
  • Tight supply of grassfed beef should continue to support prices in the short term, but there is medium term downside.

What does this mean?
Heavy steer prices fell in line with export values in late 2016, and currently sit in the 540-550¢/kg cwt range. If export prices can hold at current levels, heavy steers should find support at 500¢/kg cwt if and when supply increases in the autumn.

Over the medium terms the risk is that increases in cattle and beef supply, both on a global and national scale, pushes Grassfed beef export prices to Japan back to around the 700¢ level. This would be more in line with where the 90CL Indicator is currently sitting.
A move of this sort would see Heavy Steers making more like 400-450¢/kg cwt, than the 500-600¢ we have seen in recent times.


Increased northern throughput takes a toll

Picture1Surging weekly Queensland throughput and above average NSW throughput weighed on cattle prices in these regions dragging down the east coast figures this week with the Eastern Young Cattle Indicator (EYCI) dropping to levels not seen since the start of the season.

Figure 1 highlights the yarding pattern so far this year in Queensland with the large jump in throughput evident for this week compared to the 2016 trend and the five-year average pattern. The 19,246 head recorded a 57.8% increase on the average for this time of year. Queensland the only state to see price falls in all NLRS reported saleyard categories of cattle with QLD Feeder Steers leading the decline posting a 4% drop to 353¢/kg lwt.

Picture2
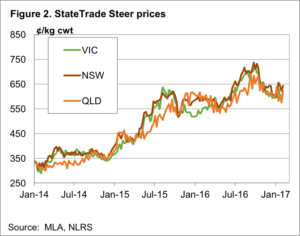
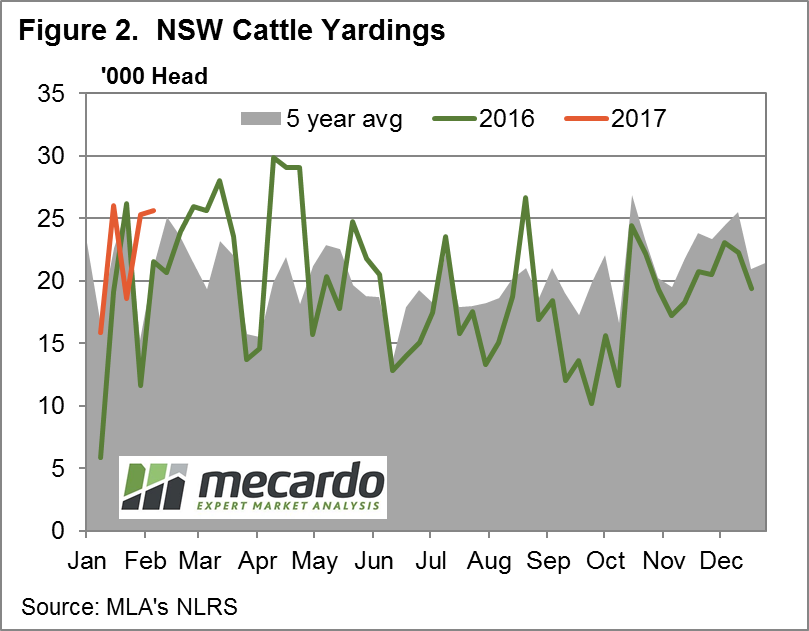
NSW experiencing price declines in all NLRS saleyard categories, apart from Medium and Heavy Steers, with Trade Steers headlining with the biggest percentage decrease, down 6% to 332¢/kg lwt with elevated NSW throughput appearing to contributing to the price pressure – figure 2.
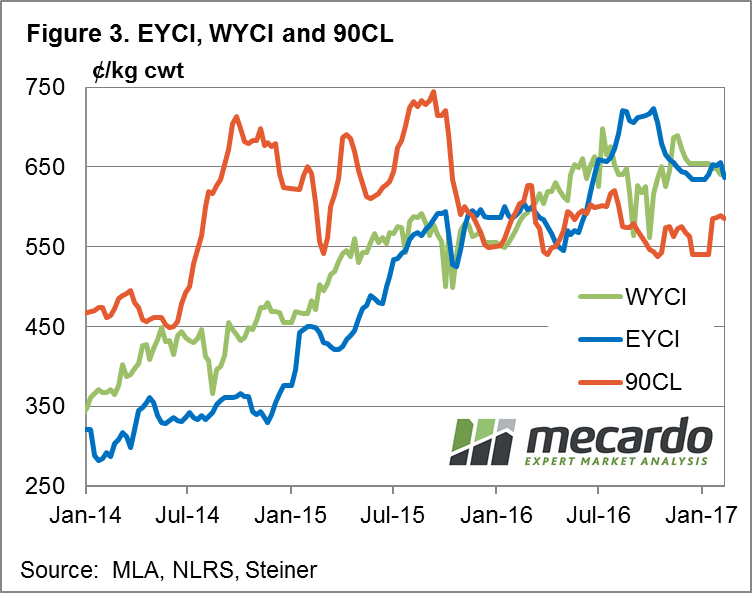
The EYCI dropping 3% on the week to close at 636.5¢/kg cwt despite beef export prices managing to hold onto the recent gains with the 90CL frozen cow tracking sideways to finish the session off at 585.5¢/kg CIF – figure 3. Softening US cattle futures creating some headwinds for the 90CL and providing a barrier to local cattle prices extending their gains achieved since the start of the season.

Picture3Register here for the MLA/Mecardo Cattle Market Webinar scheduled for the 16th February at 1pm AEST. Registered participants will be able to view a copy of the webinar at a time that suits them if unable to view it live.

The week ahead
While it is not uncommon to see weekly throughput in Queensland test toward the low 20,000 head vicinity during March/April the surge reported this week comes a little earlier than anticipated. Perhaps brought forward by the attractive price levels and the prospect of a drier than normal February – April period as forecast by the Bureau.
If you haven’t already done so, please consider signing up for the cattle market webinar we are running in conjunction with MLA on the 16th February – see link above for further details.

Global cattle in A$ terms

Key Points 

  • Diverging price trends between the US and Australia during much of 2016 saw the usual EYCI discount spread to US Feeder Steers move into extreme positive spread territory.
  • A lift in US cattle prices in the last quarter of 2016 saw the spread return to a discount.
  • Current US Feeder Steer prices at 122US¢/lb translates to around 351A¢/kg lwt while the EYCI is trading at around 342A¢/kg lwt

Picture1
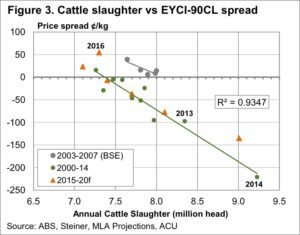
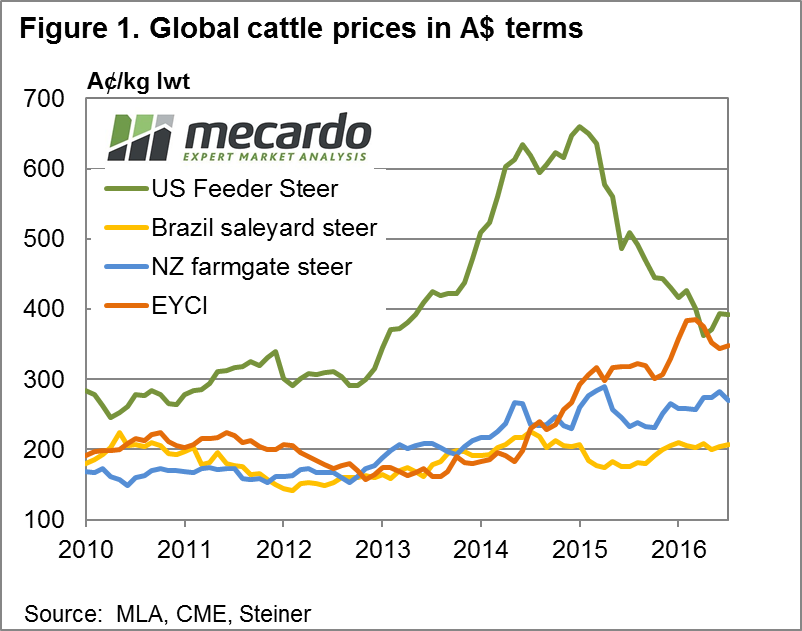
Often at Mecardo we look at local and global cattle price relationships in US$ terms as the US cattle market is one of the key drivers of Australian cattle prices over the longer term. However, in this analysis we flip the magnifying glass to take a look at global prices in our terms.

Figure 1 shows a handful of global cattle prices compared to the Eastern Young Cattle Indicator (EYCI) expressed in A$ terms on a live weight basis. Clearly, we can see for much of the period between 2010 to 2013 US Feeder Steers held a reasonable premium to comparable cattle prices in Brazil, NZ and Australia. However, during 2013 to 2015 the US market took off and the prices there doubled from 300¢ to over 600¢/kg lwt. During much of the 2013 to 2015 period prices in Australia remained subdued due the very high drought induced turnoff and Brazilian prices were kept under wraps due to a rapidly devaluing currency, while prices in NZ showed some modest gains.

Australian cattle prices started to rally into 2015 as seasonal conditions improved and for much of the 2015/16 seasons continued to probe higher as restocker demand buoyed the market and an optimistic outlook encouraged the beginning of a herd rebuild. In contrast, being further along the rebuild phase, US cattle prices began to ease during this time frame as production here increased.

The divergence between US and Australian prices can be seen by the sharp narrowing of the percentage discount spread between the EYCI and US Feeder cattle as highlighted in figure 2. Indeed, the spread narrowed so much that it went to positive territory for much of the 2016 season. Overlaid on the chart for figure 2 is the green band showing where the spread has fluctuated for 70% of the time, the 95% range as indicated by the two red dotted lines and the long-term average spread, which sits at a 43% discount of the EYCI to US Feeder Steers, when comparing priced expressed in A$ terms.

Picture2
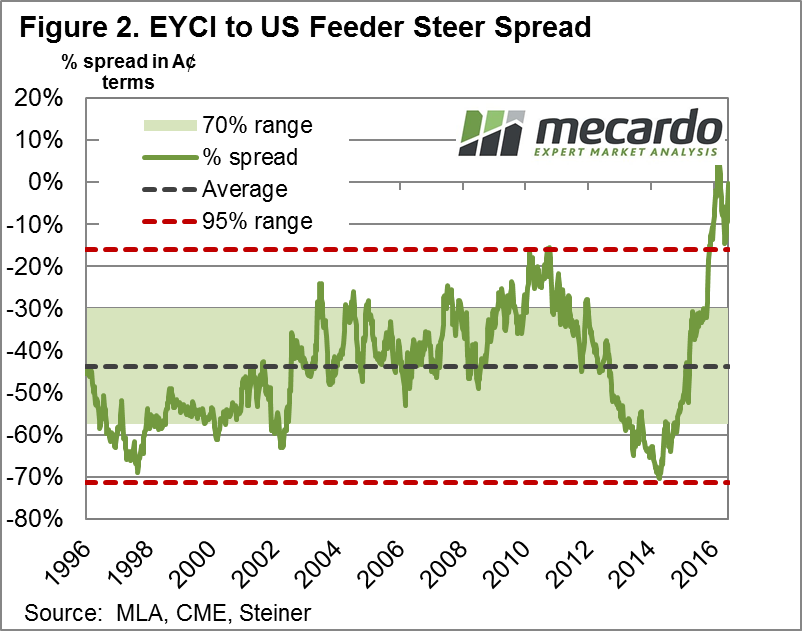
Taking a look at the correlation between US Feeder Steers and the EYCI we can see a moderately strong relationship between the two series when looking at annual average prices expressed in A$ terms – figure 3. Although, as previous Mecardo analysis has shown, the correlations between Australian and US prices are stronger when comparing annual average prices in US¢/kg.

Click on the links above and below to read past analysis on correlations between US and local prices in US$ terms.

EYCI and 90CL beef export price
US Live cattle futures and National Heavy Steers

What does this mean?
Picture3
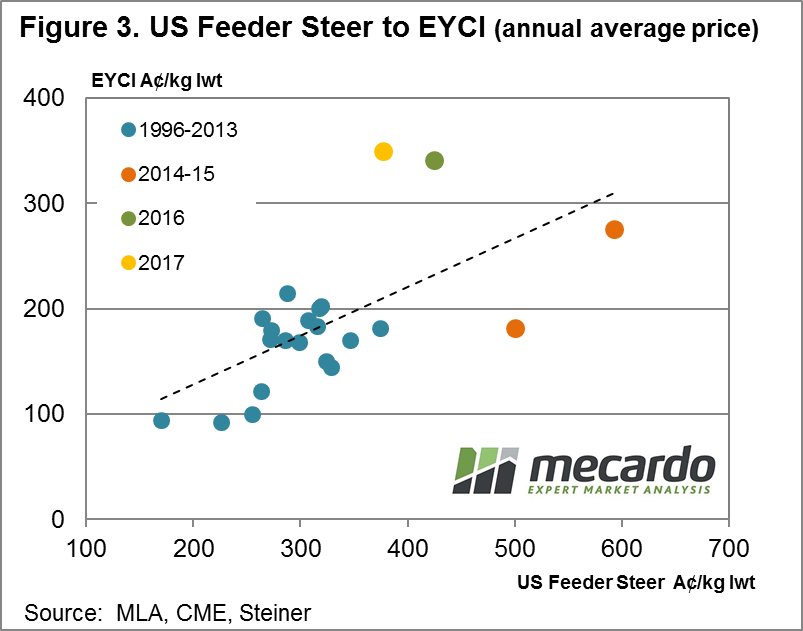
The lift in US prices since October has taken some of the downward pressure off local prices. Although from a longer term historical perspective local prices remain in overvalued territory and have not been helped by a stronger A$ during January.
A continuation of the downtrend in US prices or a significantly higher A$ (above 85US¢) would see some pressure return on local prices. However, on the flipside, tight local supply, a continuation of the herd rebuild and the remnants of a very favourable weather pattern during 2016 should be enough to see local cattle price remain buoyant for the first half of the year.

Southern cattle should start to get (more) expensive

The last week in January, or the first week in February, is usually the time when southern cattle reach their annual price low-point, relative to northern markets and the Eastern Young Cattle Indicator (EYCI).  Recent price movFigure1
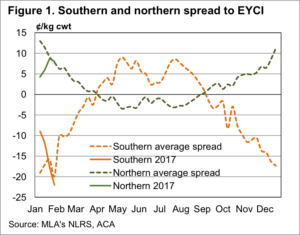
ements suggest this will again be the case, so what does this mean for pricing over the coming months.

Figure 1 shows that since early January we have seen a sharp correction in the relative prices of young cattle in EYCI saleyards south of Dubbo.  The discount for young cattle in the south has widened from 10¢ in early January, to just move past the 10 year average, and sit at 22¢.

Young cattle prices in yards south of Dubbo haven’t actually changed, but the EYCI has gained 15¢, driven by a 19¢ appreciation in yards north of Dubbo, hence those in the south have become relatively ‘cheap’.  This is despite absolute prices being at record levels of 633¢/kg cwt, for this time of year.

Figure2
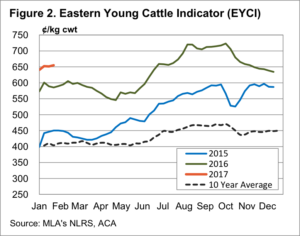
More interesting is what happens from there with the southern spread to the EYCI.  Over February, March and April, the southern discount becomes a premium, as the supply of grass finished cattle tightens, as grass supply wanes.

In the north the supply of finished cattle starts to improve in January, with the result being a weakening premium to the EYCI, bottoming out in May.

Figure 2 shows that the EYCI generally tracks sideways to slightly higher, in February and March.  With the southern discount to the EYCI narrowing, to a steady or higher EYCI, this suggests we might see 20-30¢/kg cwt upside in southern young cattle prices in the coming month or two.

Picture3
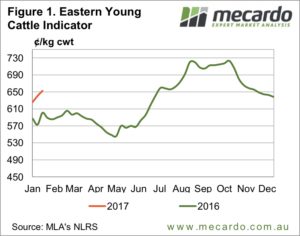
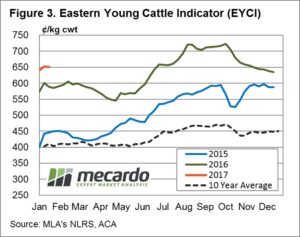
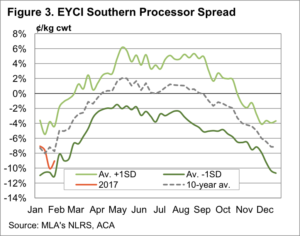
It young cattle destined for slaughter, or trade steers and heifers, which are set to benefit the most over the coming months.  Figure 3 shows that young cattle sold to processors improve 8% over the late summer and autumn.  From the current level of 595¢/kg cwt, a narrowing of the discount to parity, would see the price reach 630-640¢/kg cwt.  Prices haven’t been this good since October.


Key points:

  • The southern cattle prices discount to the EYCI has fallen to its annual low point for the year.
  • From the start of February southern young cattle prices generally improve 20-30¢ relative to the EYCI.
  • Finished cattle have further to improve than restocker or feeder prices, and prices are unlikely to fall in the short term.

What does this mean?

Seasonality in cattle markets is driven by cattle supply, and the case of the southern discount to the EYCI is no different.  Seasonality in this case is reliable, which suggests that young cattle in general, and trade steers and heifers in particular, are likely to improve in price over the coming month or two.

Whether it’s worth holding cattle to profit from this upside depends on the costs of carrying cattle through, and the direction of the EYCI.

In the north the decreasing premium to the EYCI is usually counteracted by a small improvement in the EYCI itself, and as such there it only the risk of cattle prices falling in general to discourage putting more weight on cattle.


Buyers take a pause as dry weather outlook released

The Eastern Young Cattle Indicator (EYCI) was FIGURE 1
marginally softer this week as the Australia Day
holiday and a release from the Bureau of Meteorology
(BOM) showing dryer conditions expected for
February through to April gave buyers reason to pause.

Figure 1 highlights the anticipated rainfall outlook
released from BOM which highlights a reduced
likelihood for rainfall to exceed the seasonal averages
for much of the central and south-eastern region of the
nation. The Bureau is also forecasting a hotter than
average minimum and maximum temperature range
for the same areas of the country anticipated to Figure 2
experience the dry spell. The dry and hot forecast
appearing to take some of the “heat” out for the cattle
market this week.

East coast cattle slaughter figures for the week ending
20th January coming in 2.8% higher than for the same
time in 2016 at 112,995 head boosted by Queensland
weekly slaughter figures. Indeed, Queensland was the
only state in the nation to record weekly slaughter
figures above the 2016 levels and above the five-year
average for this time of the year. Despite the boost from
the “Sunshine state” total east coast slaughter is still Figure 3
tracking 8.2% below the five-year average trend – figure 2.

Figure 3 outlines this week’s sideways movement in
EYCI closing just 0.75¢ softer at 651.5¢/kg cwt as
restockers pause to think about the weather implications.
This time last year the MLA released an article looking
at the relationship between movements in the EYCI
over January compared the overall performance over
the season. Interestingly they discovered that 78% of
the time the January performance was mirrored in the
rest of the year’s performance.

The week ahead

The MLA article would seem to suggest that based on this
January’s price movements we are in for a positive price
pattern this year, although not as strong price gains as those
that occurred during 2015 and 2016 – figure 3. As we head
into February eyes will be on the skies, temperature gauges
and the condition of the pasture as this will influence how
aggressive restocker demand will be for cattle and if they
will continue to drive the price direction as much as they
did last season.

Support coming from US export market

Cattle prices edged higher this week, as markets remain in a holding pattern, seemingly across all levels.  Export beef prices have started the year relatively steady, putting a base in the market.  Slaughter cattle are maybe a little too expensive for processors, but tight supply and restocker demand is supporting prices.

Figure2 State Trader Steer Prices

Regular readers will know we often quote the 90CL Frozen Cow indicator as a benchmark for export beef prices.  Historically the 90CL has had a good relationship with cattle prices here, and it is reported weekly, hence we like to use it.

This week the 90CL edged a little higher, hitting 590¢/kg cwt, almost exactly the same level as this time last year (figure 1).  In fact, the 90CL indicator has tracked in a historically narrow range for much of the last 12 months, bouncing between 550 and 600¢/kg swt.  Tight supply out of Australia and New Zealand has been somewhat counteracted by weakening demand from the US.

According to the weekly Steiner report, beef demand in the US has improved recently.  This has been on the back of cheaper domestic beef, and improving margins for retailers, therefore they have been pushing beef in their marketing campaigns.  For us it’s strange to think retail or fast food marketing campaigns could have any impact on cattle prices, but apparently it’s gFigure1 90CL vs EYCIood for us if McDonalds sell more burgers in the US.

Locally it was Queensland where the action was this week.  The Qld trade steer indicator rallied 50¢ to 625¢/kg cwt (figure 2).  The saleyards in Queensland are a full dollar higher than the Over the Hooks quote.


The week ahead

Figure 2 shows there is little difference between state trade steer indicators, which is normal for this time of year, as markets move into a holding pattern.  The next major market move is usually lower in autumn, as northern weaner cattle and cull cows hit the market.  How much impact this has this year will depend on rainfall, obviously.

Cattle projections forecasting lower slaughter but demand will drive prices

Meat and Livestock Australia (MLA) have hit the target
with their recent cattle projections, and as such not much
has changed in their January update. It is, however, Figure 1
worthwhile taking a look at what the peak body see is
going to be the supply situation for the coming year
and beyond.

Figure 1 shows MLA’s slaughter and herd projections,
and how slaughter has changed from the October
estimates. The herd is still expected to have bottomed
out last year, at 26.14 million head, a 20 year low.

A relatively quick herd rebuild is expected, on the
back of 20 year low slaughter rates next year. The herdFigure 2
isn’t expected to reach the highs of 2013 in the next five years,
but is expected to move back above 28 million head by 2019.

MLA have made some slight revisions to slaughter
numbers. For 2016 slaughter was down 100,000 head,
and this has been shifted into 2017, lifting the estimate
by 1.4% to 7.1 million head. Further down the track
slaughter estimates have been lifted marginally,
basically due to the herd being slightly larger than previously estimated.

The projections of 8 million head slaughtered in 2020 Figure 3
and 2021 are high relative to historical levels, but remain
well behind the peaks of 2014 and 2015. Obviously MLA’s projections are based on ‘normal’ seasonal conditions, with the growth in the herd driven by current strong prices, and the fact many regions are currently understocked.

Some interesting figures from this week’s projections
comes from the average carcase weights of cattle
slaughtered. Figure 2 shows a jump in slaughter weights
in 2016, from the lows of the drought where heavy female
young cattle slaughter saw weights at 278-279kgs. In 2016
slaughter weights increased 3% to 287kgs per head, and
are expected to start a slow ascent to 291kgs by 2021.

Interestingly the 2016 slaughter weights couldn’t quite
eclipse those seen in 2012, which suggests that the good
season wasn’t enough to see cattle held to heavier weights.
Rather producers took the good money when cattle
were ready.

Key points:

  • MLA have released their updated cattle projections,
    with little change to herd or slaughter forecasts.
  • The cattle herd is expected to have bottomed out in 2016,
    with the slaughter low coming this year.
  • Continued tight cattle supply should ensure prices
    remain relatively strong for the coming year.

What does this mean?

Regular readers will be familiar with figure 3, which plots
the spread between the 90CL export price and the EYCI,
against annual cattle slaughter. The fact that the 2016
point sits well above the trend suggests local demand
was very strong in 2016.

As that restocker demand wanes as the herd grows we
would expect the EYCI’s premium over the 90CL to fall
back to the trend line. This means that even though slaughter
is expected to be lower this year, we may see lower prices as
well, with the current 90CL price, and the historical trend
suggesting the EYCI should average around 600¢ in 2017.

Demand driving cattle prices higher

Cattle markets have opened 2017 with a bit of a bang,
with extraordinary restocker demand, and very good
feeder demand driving prices higher. Cattle supply in
saleyards has been similar to last year, so it would
seem demand is the driver.

The Eastern Young Cattle Indicator (EYCI) has
rallied back above 650¢/kg cwt this week, hitting a
six week high (figure 1). With the dearth of quotes for
the cattle market last week, it’s hard to pinpoint who
is driving the stronger prices. However, with the east
coast trade steer sitting at 632¢, and feeder cattle
around 10¢ higher, it would seem restockers are
dragging the EYCI higher.

East Coast cattle yardings rallied higher this week,
which is not unusual as normal sales resume. Usually
the pent up supply from the break sees prices move
sideways in January, but it appears it is pent up
demand pushing prices higher.

Some recent rain in Queensland has no doubt helped
push demand in the north, but large parts of
southern Queensland and NSW are still 25-100mm
below the January average.

After opening up much stronger, heavy steers eased
marginally this week (figure 3) as the strong price
drew out supply, while cows were also a little lower.
Despite the wide spread between finished and store
cattle prices, the numbers seem to still be working for
those purchasing expensive young cattle.

The Week Ahead

There has been a few positives for the cattle market of late,
and this has resulted in higher prices early this year.
Add to this the widespread rain which is forecast
for the next week and we could see a little more
upside for prices in the short term.

However, unless we see a strong rally in export values,
it’s hard to see cattle getting back to the levels of last
spring, with 5% upside probably the limit.


Input update: Fertilizer and Fuel (Jan 2017)

Key Points

  • The August-November average diesel price at port was $106/l
    versus $116 for the past month.
  • There is a global glut of fertilizers on the market which is unlikely to rectify anytime soon.

The harvest is all but done, now is the time to start looking towards next year. There will be changes in planting, a little more of this and a little less of that. However, regardless of what you plant you will be burning diesel and spreading fertilizer. In this report, we look at these two important inputs.

In the last two months’ millions of litres of diesel
will have been burnt across the grain growing regions
of Australia, and in reality, we are only a few months
away from starting all over again with seeding and
the diesel bills will start flowing in. In figure 1,
the average port diesel price for Australia is
displayed since the start of 2015. Assuming that
most farmers purchased their fuel well in advance
of harvest as recommended by Mecardo early in 2016,
the input costs for fuel for the 2016/17 harvest
will be considerably lower than current levels.

The average diesel price for Aug/Nov was A$106/l,
versus A$116/l for the past month. Although diesel is
creeping back up diesel prices have spent a lot of the
last ten years above current levels (figure 2). In late
December OPEC agreed for the first time in eight
years to cut oil production, which alongside improving
economic conditions has led to an increase in crude
oil prices and therefore diesel. The market for oil is
hard to predict and in coming months it is important
to keep a close eye on the market with a view to
locking in fuel for the coming season either through
swaps or fuel contracts.

The picture is rosier when it comes to fertilizer. In
figure 3, we can see that both DAP and Urea are both
pricing at good levels since the start of the decade.
Although Urea has seen an uptick in past months, the
outlook for fertilizer supply still points to a surplus for
at least the next two to three years. The supply issue
aside the real risk is a fall in the A$ increasing the
cost of imports.

What does it mean?

The fertilizer market remains at low levels; however,
the market outlook remains bearish to neutral reducing
the impetus to go out straight away and stock up.

In terms of fuel the outlook is less certain, and looking in
a proportion of fuel requirements in advance could be an
advisable risk management strategy.