Tag: Commodity

Getting by with a little help from… the rain.

The trend in lamb and sheep slaughter figures this season show pretty clearly that the neighbouring states are picking up the added workload stemming from the Murray Bridge fire out of South Australia. Victorian and NSW lamb and sheep slaughter is trekking well above seasonal average levels and those recorded last season for the week ending 23rd February, while the opposite is true for South Australia.

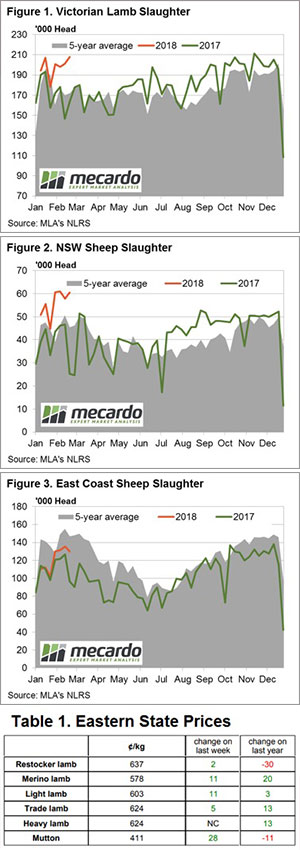
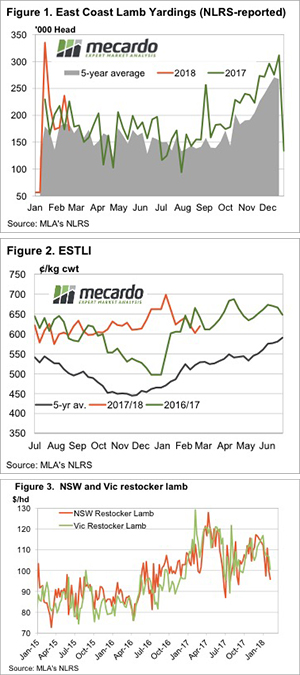
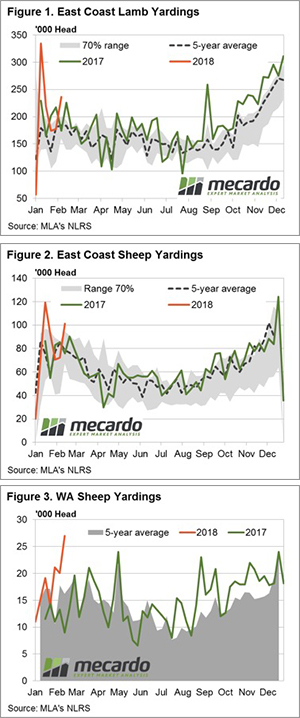
Despite Victorian lamb slaughter sitting 21% above the five-year seasonal average, as shown in Figure 1, the total east coast slaughter is only 3% higher for the season with nearly 376,000 head processed in the previous week. In contrast, current SA lamb slaughter is trekking 29% under the seasonal average level for this time of the year.

A similar story for mutton, with NSW slaughter volumes 33% above the seasonal average – Figure 2, while SA mutton slaughter is currently 44% below the average seasonal pattern. The broader East coast mutton slaughter somewhat reflective of the flock rebuild phase with levels trending 11% under the longer-term average but 35% higher than this time last year – Figure 3. East coast slaughter moved slightly higher over February compared to the 2016 pattern as the forecast wetter February period failed to fully materialise.

There was some relief for the last week of February with some reasonable falls across much of the eastern side of NSW and in WA. This provided a bit of a lift to East coast mutton prices, up 7% on the week to close back above 410¢/kg cwt. East coast lamb categories ended the week with flat to small gains (see Table 1.), the benchmark Eastern States Trade Lamb Indicator (ESTLI) up a fraction to close at 624¢/kg cwt.

What does it mean/next week?:

Some very solid rainfall is forecast for Queensland in the coming seven days, but not a lot will make its way further south. Indeed, much of the nation’s prime sheep rearing country will miss out. As Table 1. highlights, most categories of lamb and sheep prices are not too far away from levels seen this time last year. With prices this robust from a historical perspective and nothing much in the way of rain on the horizon as we head into Autumn prices are likely to ease slightly into the coming week.

Wool market stronger ….. or is it?

Across the board the Australian wool market Micron Price Guides (MPG’s) were all quoted higher, the only exception on the AWEX Wool Market Report was the Cardings indicators.

The MPG Indicators however failed to provide the whole picture; underneath the headline report is a more complex story.

The most significant factor in this week’s market was the Au$; by the end of the week it was quoted down US$0.013, sitting below US$0.78 for the first time in 2018. As a consequence, the Eastern Market Indicator (EMI) rallied by $0.08 for the week to close at 1820¢. This picked up all the fall of last week. As well, the Western Market Indicator (WMI) improved 16 cents to finish at 1895 cents.

To complete the currency story and its influence on this week’s market, the EMI in US$ terms fell 17 cents, this meant a cheaper week on week for buyers, and better prices for wool sellers thanks to an easing Au$.

There is another underlying story, at this time of the year there is more “faulty” wool on offer. Lots with higher VM have been steadily increasing, which results in these types receiving erratic competition. There is another side to this story, and that is that FNF types (wool with less than 1% VM), are increasingly difficult for buyers to source and at times extreme prices are bid for particular lots.

The issue of quality has also permeated into the X Bred section of the market. In the past couple of years, it has been the trend to spend less time preparing X Bred wool in the wool shed, with some producers electing to either not skirt or minimal skirt in their wool preparation. When the market is buoyant or under tight supply this preparation model has little impact on prices, however, when the demand softens or supply increases (both currently the situation with X Bred wool), buyers can overlook less prepared types. This is the case now. Buyers can fil orders with “traditionally” prepared wool; poorly prepared lots are then used as bargain buys to cheapen orders.

Of the 41,815 bales originally offered, 39,429 sold with a Pass-in rate of 5.4% or just 2,240 bales.

The week ahead

Sales are scheduled for all three centres next week on Wednesday & Thursday.

A total of 44,506 bales are rostered for next week, slightly more than this week’s offering; the roster drops away over the following 2 weeks with 41,500 and 39,100 anticipated.

High northern throughput has little impact.

A surge in cattle yardings in Queensland and NSW this week failed to make a huge impact upon prices with markets ending the week fairly mixed. The Eastern Young Cattle Indicator (EYCI) only marginally softer, down a mere 3.25¢ to close at 521.25¢/kg cwt.

Table 1 highlights the mixed fortunes for the week, with lighter East coast steer categories mirroring the EYCI, posting marginal falls. East coast Trade Steers were the weakest, off 3% to close at 273.2¢/kg lwt. In contrast, East coast steers remained reasonably flat at 260.7¢, while 
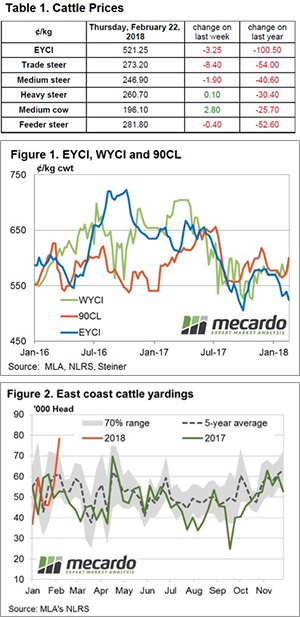
Medium cows managed to lift 1.4% to 196.1¢/kg lwt.

In the West, young cattle were given a bit of a shake up, dropping 3% to 574¢/kg cwt, although still sitting relatively comfortable running 10% higher than Eastern states young cattle. In offshore markets, the 90CL frozen cow was steady above 600¢/kg – Figure 1.

Figure 2 demonstrates the surge in East coast cattle throughput on the week with a 42% gain recorded to just of 78,000 head. This pushes weekly yarding levels to well outside the normal variation than can be expected for this time in the season, and places it 28% higher than the five-year seasonal average.

The surge in East coast yarding levels this week was supported by increased throughput in Queensland and NSW. Indeed, Queensland cattle yardings of over 32,500 head represent a doubling of the numbers seen at the saleyards last week and NSW posted a 26% lift in numbers to over 31,600 head.

What does it mean/next week?:

Compared to the five-year seasonal average throughput pattern, the Queensland yarding figures posted this week are 73% higher, while the NSW throughput is elevated by 30%. It’s likely that this elevated yarding is a reaction to the muted wet season, although there was some reasonable rainfall recorded along the Eastern regions of both NSW and Queensland this week.

Given the increased numbers at the sale yard, it’s a reasonably good sign that prices didn’t soften too much across the East coast, a signal that demand is robust enough to soak up the added volume. More rain is forecast for much of the north east of the nation this week and this could see throughput levels return to more normal conditions, particularly in Queensland and NSW. If demand can be sustained, the reduced throughput could see cattle prices gain towards the end of February.

A lot of poleaxing for little result

In a good week for grain growers the Aussie dollar is a bit lower, and international oilseed prices have found a bit of strength.   CBOT Wheat steadied after a down week, which didn’t impact locally.  All this translated into higher physical canola prices yesterday, and there might even be a bit more upside today.

In looking for some commentary on the AUD exchange rate we found an article saying the Aussie had been ‘poleaxed’.  Sounds promising for export orientated markets, but on further investigation ‘poleaxed’ translates into a 1% fall, with the Aussie at 78.4 US¢ this morning (figure 1).

If we were to use some of the terms we see in the financial press to describe grain prices this week we could say canola is rocketing higher, and wheat smashed lower.  In reality ICE Canola has finished the week 1% higher at $508CAD/t (figure 2), and CBOT wheat 3% lower at 450¢/bu.  We’d hate to see what financial reporters would make of the volatile commodity markets.

Locally there has been a bit of rain about, which usually loosens growers grip on grain, but we’ve seen a relatively flat week.  Canola has returned to the ‘highs’ seen two weeks ago, but at around $500 port we are still a long way from December values, and at weak basis.

For those in the south, who have held onto canola, there is a bit of hope.  Boats coming into Geelong and Portland might see some demand, and hopefully, basis improvement.

The week ahead

CBOT wheat came off on the back of a better rain forecast for key wheat areas, but this rain is yet to eventuate so there might be a bit of upside yet.  As we keep saying, however, world wheat supplies are abundant.

Locally rain in NSW might encourage a bit of a sell off of cereal, but in reality there is not much grain up there so we can expect wheat and barley prices to remain steady.

Growers not happy with 600¢

Sheep and lamb markets made a bit of a comeback this week. Lower prices had the usual impact, seeing more growers keep their sheep at home, forcing processors to pay a bit more for lambs and sheep. 

The spectre of rain, and of course lower prices put a fair drag on supply this week. Producers baulked at lower prices, with lamb yardings falling 27% to their lowest full week level since mid-September (figure 1).  Sheep yardings took a similar fall, but have been weaker at times this year.

It’s nice when economics work the way they are supposed to. The lower supply saw prices move higher, the Eastern States Trade Lamb Indicator (ESTLI) gained 19¢ to close Thursday at 619¢/kg cwt (figure 2).

Lamb prices are in fact, very similar to last year. However, last year they had jumped 100¢ from December and any lamb that was ready was coming to market, there just wasn’t many finished lambs. This year prices have tanked from December, and growers don’t like lambs at 600¢. It interesting how price expectations can change in a year.

Restocker lamb prices have fallen in line with the ESTLI (figure 3). Lower prices now don’t necessarily mean prices will be steady through autumn, but the market always reacts the same way. If we have indeed seen the price low, it might be a good time to buy store lambs.

Over in the West sheep are the most expensive in Australia, the indicator at 400¢/kg cwt, while Merino lambs had an extraordinary jump, gaining 126¢ to 635¢/kg cwt.

The week ahead

Again it is forecast to rain in Queensland, but some key parts of Northern NSW might get some too this time.  After a dry summer this might be the trigger for a supply pull back, with the ripple effect flowing south.

We don’t expect a strong jump in lamb prices this week, but it’s also hard to see supply ramping up far enough to see values fall back below 600¢.

Has the destocking in Queensland really began?

  • The annual average ratio of female cattle culled in Queensland as a proportion of the total slaughter for 2017 was 40.4%, a fraction below the 2016 figure and well below the slaughter measure reached during the 2014 herd liquidation of 46.5%.
  • Price spread behaviour of Queensland restockers suggests the buyer activity for this group is relatively normal for this time in the season, compared to the historical data set.
  • Northern restockers have been active in greater volumes, compared to the south, buying well above the weekly average volume for young cattle since the start of the season.

The recent Australian Bureau of Statistics (ABS) cattle slaughter data for December 2017 shows a spike in the proportion of females as a percentage of total slaughter for Queensland and suggests the delayed start to the wet season is leading to a herd destock in the north. However, the ABS data is lagged so its unclear yet if this trend has carried into 2018 – fortunately the underlying EYCI data may provide a clue as to what northern restockers are doing at the moment.

Figure 1 highlights the increased female slaughter pattern in Queensland, showing that since Spring the kill levels for females as a proportion of the total slaughter has been somewhat elevated from a historic perspective, trekking above the upper end of the normal range.

However, it is yet to reach the very high levels consistent with the herd liquidation experienced during the 2014 season, when the annual average percent of females slaughtered as a proportion of the total kill reached 46.5%. Indeed, the annual average for 2017 came in at 40.4%, a fraction lower than the 2016 level of 40.5%.

This seems to suggest that while the increase in Queensland female slaughter ratio in December was a little alarming, it’s not panic stations just yet. Taking a look at the underlying EYCI data for restocker activity in the north we are able to assess what the impact to the delayed wet season has been on herd intentions by looking at both price and volume behaviour of the northern restockers.

Figure 2 shows that northern restockers (sale yard restocker young cattle buyers north of Dubbo) were paying higher than average premiums for their young cattle purchases compared to the broader EYCI, suggesting that optimism is still reasonably healthy amongst this group of buyers.

Furthermore, filtering the underlying EYCI data to just restockers in Queensland (from the four southern Queensland sale yards that contribute to the EYCI) shows that there was a rise in the premium spread to the EYCI during February toward the top of the normal seasonal range. Although it is noted that Queensland restockers, as of last weeks closing prices, were now paying slightly under the seasonal average premium to the EYCI for this time in the year – figure 3.

What is really interesting though are the volumes of young cattle being bought by northern restockers compared to their southern counterparts at the sale yard, compared to the normal seasonal averages. Figure 4 shows that northern restockers have been pretty active so far this season with average weekly volumes of young cattle being bought by northern restockers trending well above the seasonal average, particularly compared to the southern restocker pattern, which is trending slightly below the average.

What does it mean?:

The lag on the ABS data makes it difficult to give a clear answer as to whether the herd is being liquidated in Queensland so we will have to wait to see what develops there as the 2018 monthly data becomes available.

However, its fairly certain that despite the spike in the female slaughter ratio that occurred in December for Queensland, it is nothing like the 2014 season. Furthermore, the underlying EYCI data on both price spread relationships and volumes suggest that we don’t need to sound the alarm on a herd liquidation in the north – just yet.

No cattle supply decline yet.

Key Points

  • Rainfall in Queensland was weaker than forecast, but we have seen supply tighten in a relative sense in Queensland.
  • Victorian and NSW cattle slaughter has been stronger, pushing total east coast slaughter higher than last year.
  • There is potential for cattle slaughter to fall with good rain, putting upward pressure on prices.

We’ve seen some rain in Queensland, and it has had an impact on slaughter in the north at least.  It’s in the south however where finished cattle supply has ramped up, with lower capacity in South Australia being made up further east.

The rainfall which fell in Queensland a couple of weeks ago was not quite as widespread as expected. Much of the precipitation was in the far north and within 200kms of the east coast.  Figure 1 shows that most of Queensland is yet to hit 60% of average wet season rainfalls, with two and a half months to go.

There appears to have been some impact on cattle supplies, at least in Queensland. Figure 2 shows that Queensland weekly slaughter looks like it might dip under last year’s levels if it remains around the 65,000 head mark.

South Australian slaughter is well down on last year. The fire at TFI has slaughter down 28% in South Australia, but stronger slaughter in NSW and Victoria has total east coast levels stronger than last year.

Victoria killed 17% more cattle than the same week last year, while NSW is up 8%. This has east coast slaughter last week sitting 5.2% above the same time last year (figure 3). In fact, last week’s slaughter was higher than any week before the middle of May in 2017.

In late January and early February, east coast cattle slaughter was 14% above last year’s levels, and the ‘relative’ tightening in supply is likely to be behind the steady to slightly higher prices last week.

On average east coast cattle slaughter tracks sideways from now until the public holidays come again at the end of March.  However, we have seen slaughter levels rise or fall sharply at this time of year with rainfall, or lack of, usually the driver.

What does it mean/next week?:

While the rain hasn’t seen slaughter fall, the rise seems to have slowed. Additionally, in their projections MLA forecast 2018 slaughter to be up 3% this year. So far in 2018 slaughter has been up 8% according to MLA’s weekly numbers.

If MLA’s numbers are to be correct, slaughter levels will have to track closer to last year’s levels for the remainder of the year. While export demand will be the main driver of prices, tightening slaughter should see some improvement in prices relative to export values.  If slaughter remains better than 5% stronger than last year, we can expect a more pronounced supply contraction somewhere down the track, likely in the winter.

A lot of young cattle on the market

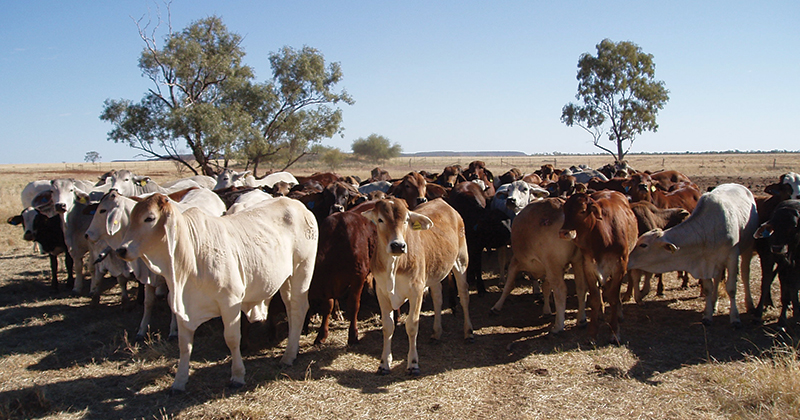
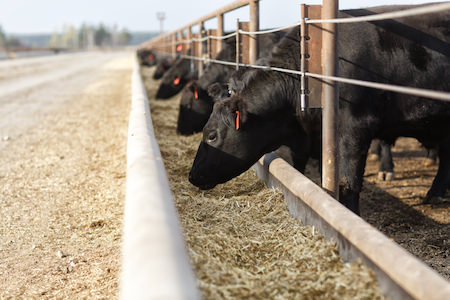
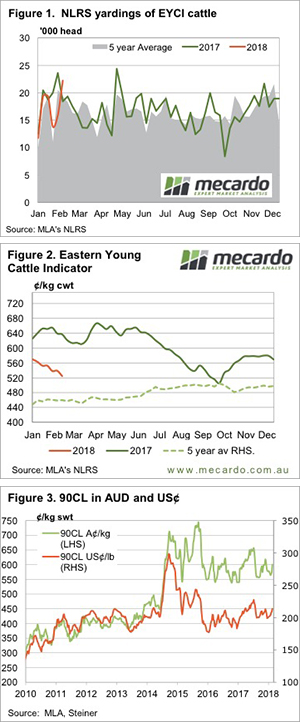
Young cattle yardings are building. This week Eastern Young Cattle Indicator (EYCI) yardings hit an 8 month high, and prices reacted accordingly, drifting lower, and heading back towards the low set in the spring.

Figure 1 shows EYCI yardings hitting 22,218 head on Thursday, up 6,312 head for the week. It was the highest EYCI yarding since May last year, and only the second time it’s been above 20,000 head in that time.

The major culprits causing the higher yarding were the EYCI’s biggest yards. The Roma store sale had 284% more cattle yarded, Dalby was up 50%, Wagga 41% and Dubbo 52%. These 4 yards contributed 50% of the EYCI cattle this week, and all except Dubbo saw price falls. Roma was the biggest, losing 39¢/kg cwt as its premium fell to just 4¢ over the general EYCI.

With prices at the biggest yard falling so dramatically, it’s little wonder the EYCI hit a four month low of 524¢/kg cwt (figure 2). The downward trend in prices is a little concerning, but it tends to reflect the lack of rain over a lot of NSW cattle country this summer.

Export markets should have provided some support this week. The 90CL prices in US terms were up 4.5¢ as wet weather in NZ of all place is expected to dampen trim supply. The 90CL indicator in our terms was up 25¢, moving back to 600¢/kg swt for the first time this year (figure 3).

The week ahead

The cyclone forming off the Kimberly could provide a bit of precipitation for some key cattle areas next week, but it doesn’t look widespread enough to cause a serious rally. Probably more consolidation and maybe a return to recent levels.

The creeping dry, and seeping ships.

The grain market stands at a cross roads. In the past two years, we have seen concerns in the market which have led to short rallies. Will conditions provide the opportunity for a sustained rally, or will it fizzle out?

After a strong January & early February, the past week has seen the futures market trade in a narrow band (figure 1). The futures currently rest at A$213/mt, up A$21 from the same time last month. The futures have been rising due to ongoing weather concerns in the US. Abnormally conditions persist across much of the country (see below), with many areas receiving next to no rainfall since the onset of winter.

Coming back down under, BOM have signaled that the next four months are liable to be drier than average. This is not good for farmers struggling with already limited subsoil moisture. Although, as an eternal optimist, I must point to the fact that BOM themselves admit to only having a moderate level of accuracy, and only low to very low in SW WA and SA.

When we look at flat prices of APW1 in Australia (figure 2), although futures have risen the follow through locally has been more tempered. In Port Kembla & Kwinana the rise has been more restained at +$2 and +$8 month on month. In SA & Vic the ascension has been stronger with +$12 added to the flat price in the past month. It is not surprising that Port Kembla pricing was more lackluster in experiencing the benefit of the futures rally, as basis levels were already at very strong levels.

There were a number of reports in recent days about the lack of competitiveness of Australian wheat versus Black Sea region supplies. This is something we have been discussing for the past two or more years, and its likely to continue into the future. At present pricing levels, Russian and Ukrainian farmers are profitable, and with freight rates continuing to be depressed (figure 3), their supplies can compete into our traditional markets.

Although the Black Sea is likely to be the powerhouse of international wheat in the coming decade, we only have to look back to 2010, when drought ravaged their crop. As the world becomes reliant on this producer, and with US acreage dropping – at some point Russia will get its bad year.

See previous discussion of this topic:

Has Australia lost its geographic advantage for grain?

A slump in shipping rates is eating away competitive advantage

What does it mean/next week?:

US weather woes continue to plague the market, and it will be interesting to see how the speculators in the market react to this on the weekly commitment of trader’s report.

Although we have seen a rally, it is yet too early to determine whether this will form what I consider to be a sustentative rally.

High throughput across the country weighs market

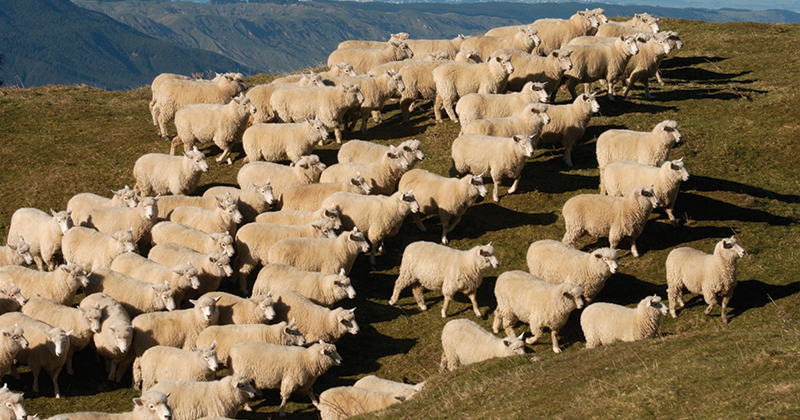
Strong throughput numbers for both lamb and mutton across the nation this week saw falls recorded in all national sale yard indicators, ranging between 3$ to 9 %.  The headline Eastern States Trade Lamb Indicator (ESTLI) dropping 9.4% to close at 601/kg, while mutton was equally weak, off 8.8% to 385¢.

The East coast sale yard indicators mostly mirroring the national falls, with many categories posting declines between 2% to 12%. In Victoria, Merino Lambs the weakest, falling 9% to 558¢, while in NSW Restockers took the heat with a 12% drop to 598¢.

Victorian and NSW lamb yardings shown to be running above average for this time of the year and this saw East coast throughput lift 33% on the week to sit 28% higher than the seasonal average for this time in the year – Figure 1.

Higher NSW mutton yarding the key behind the elevated East coast figures too this week – figure 2. NSW sheep thoughput currently 34.7% over the seasonal average level for this week in the year and the added numbers of mutton has pushed the East coast levels over 100,000 head this week, an 18.7% gain on the seasonal average.

Western Australian indicators for Merino Lamb and Mutton were particularly soft, both off 19% to 509¢ and 370¢, respectively. High throughput the likely culprit there too with WA mutton yarding levels showing a solid surge this week with 27,000 head recorded – an increase over the seasonal average of 66.3% – Figure 3.

What does it mean/next week?:

A wetter week is anticipated, particularly in the West, and this should stem some of the price declines experienced by producers this week. The BOM have forecast a higher chance for a wetter than average February and there hasn’t been much for the East coast for the first few weeks of the month – perhaps that means the second half of the month we will be some decent falls… fingers crossed.