 It has been some time since we had a look at live cattle exports so we thought it timely to focus in on the changing market share of the live cattle trade among the key export states, along with the price relationships that exist between live cattle and domestic young cattle.
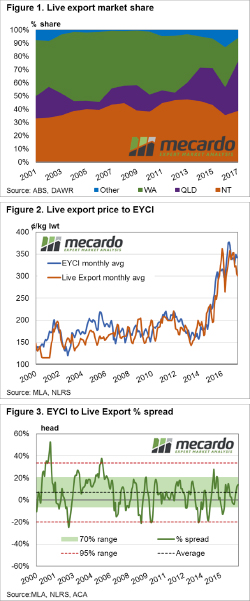
Figure 1 outlines the percentage of market share in volume terms that are attributed to the three largest exporting states for live cattle, namely the Northern Territory (NT), Queensland and WA. Historically, NT and WA have held the lion’s share of the trade volumes over the last two decades. NT market share has been relatively stable fluctuating between the seasons from 35-45% of the total trade volume. In the last five years there has been a noticeable expansion of volume exiting Queensland. Indeed, for much of the period from 2001 to 2013 Queensland accounted for 10-20% of the trade. However, in recent times the proportion of live cattle leaving Queensland has extended toward the 25-30% range.
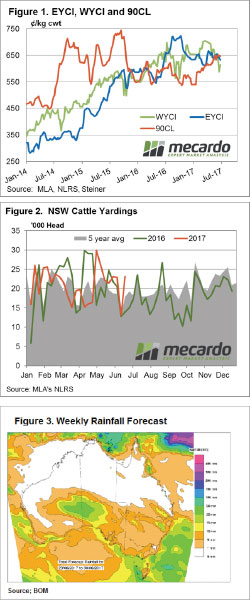
Turning our attention to price movements we can see a fairly strong relationship between average monthly EYCI prices when compared to a Live Export Index (created by averaging the live weight prices per month out of the ports of Broome, Townsville and Darwin). Analysis of the correlation between the monthly EYCI and the Live Export Index shows a correlation co-efficient of 0.83, which is indicative of a reasonably strong relationship between the two-price series. The correlation in price movement increases to 0.94 when the two-price series are compared on an annual average basis.
Analysis of the historic monthly percentage spread between the EYCI and the Live Export Index shows the EYCI to Live Export long term average spread sits at a premium of 7% and spends 70% of the time fluctuating between a 6.5% discount spread to a 20% premium spread (green shaded zone – figure 3). The red dotted lines highlight the 95% range between a 20% discount spread to a 33.5% premium spread, indicative of the extreme ends of the historic range.
What does this mean?
Analysis of seasonal live cattle trade flows shows that volumes out of Queensland tend to peak in the first quarter of the year, while WA peaks mid-year and NT peaks at the end of the season. This would suggest that the current market share of volumes out of Queensland at 28% is likely to diminish slightly as the year progresses and volumes out of WA and NT expand.
The current percentage spread of EYCI to Live Export prices sits at a 14% premium, and within the 70% range banding, which indicates that price levels for the two data series are comfortably within the “normal” range and suggests that neither price is too far over or undervalued in comparison to the other.
Key points:
- Live cattle volumes exiting Queensland has shown steady growth in percentage market share in the last five years.
- Movements of the EYCI and Live Export cattle prices show a close relationship over both monthly and annual average comparisons.
- The EYCI tends to sit at an average premium spread to Live cattle prices at around 7%, but can fluctuate between a 20% discount to a 33.5% premium, dependent upon the season.
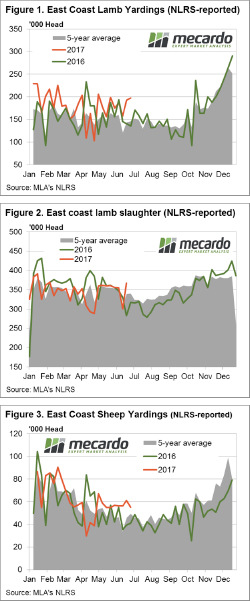 On the radio in today the weather report included a brief from BOM saying that June has been the driest in Victoria since records began and its taking its toll on the price of lamb and sheep. East coast figures show price falls in all categories other than Restocker lambs on the week and Light, Heavy and Trade lambs are now trading lower than this time last year.
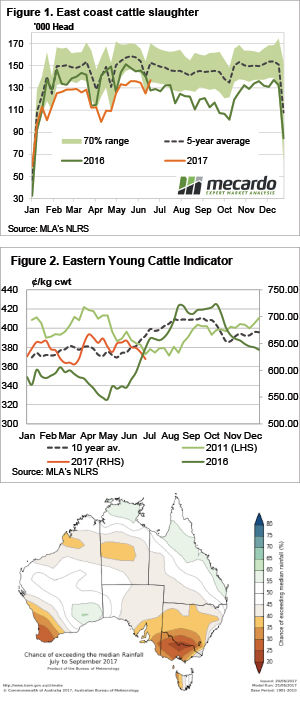 Here’s a quiz question. When was the last time the Eastern Young Cattle Indicator (EYCI) finished June lower than it started? You’ll have to read the article to find out….
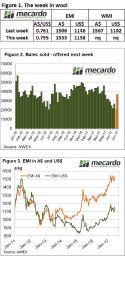
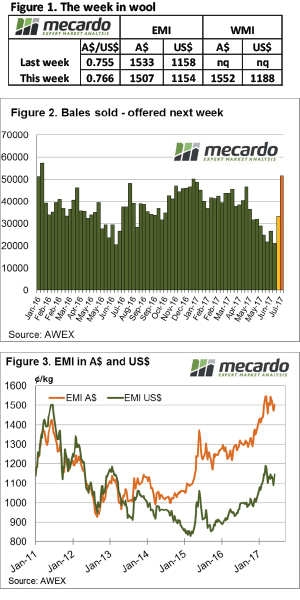 The fragility of the wool market was evident this week in what was the final sale for the financial year where increased supply (Fremantle back selling again) and a rising A$ pushed all types lower however, the strong Crossbred types showed some resilience. The EMI shed some weight nearing 1500¢, down 26¢ to 1507¢ and also falling a more modest 4US¢ to 1154US¢.
 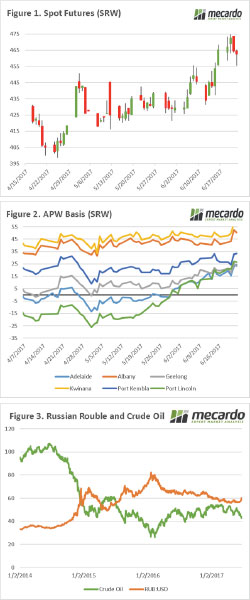 There has been a slight turnaround in the market, but overall prices are substantially more attractive than they have been in the post-harvest period. In this week’s commentary, we examine the potential impact of crude oil on Australian wheat, and why we should be aware of it.
 A good recovery staged by Queensland across the board, while NSW disappoints… no I’m not talking about the State of Origin – although the phrase fits there too! Actually, it’s the cattle market this week. Despite the national market indicators posting largely flat results, with weekly moves of less than 2% either way some state based indicators saw more substantial action.
 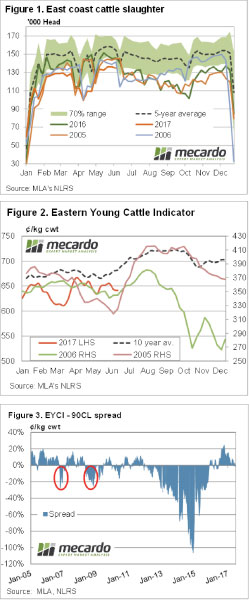 Whether or not you believe the Bureau of Meteorology (BOM) three month forecast, there is always the chance the current dry spell could continue. Dry winter’s and springs are not great for cattle prices, but given the current historically strong values, how bad could it get?
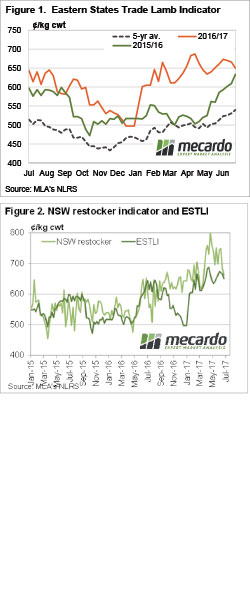 In general lamb prices were largely steady this week, but trends were mixed depending on category and state. With supply remaining relatively strong as we pass the winter solstice, and new season lamb supply fast approaching, the question is whether we have seen the peak.
 Again, the occasional, yet extreme demand for wool with good measurements (low mid breaks & good tensile strength) contributed to a mixed message out of this week’s wool market. The better types pushed the overall market to new levels while lower style wool battled to keep pace.
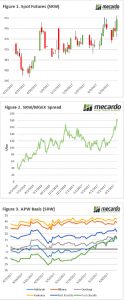 This time of year, has typically been one of great volatility as the northern hemisphere commences harvest. This can easily be seen in the current market, where the weather is the major driver. The market stays on a knife edge, where every new piece of information is propelling the market.