Tag: Grain

My shutdowns are the greatest shutdowns.

The market trades based on information. The largest source of publicly available information is currently on a record-breaking holiday thanks to the US government shutdown. What impact does this have?
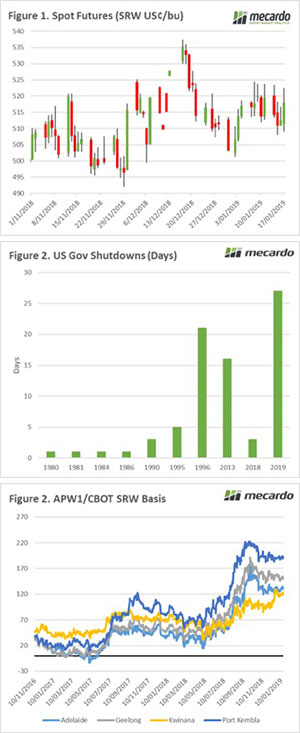

January is typically a quiet month for overseas markets. This month has been no exception to the rule. Chicago wheat futures are unchanged week on week in both US$ and A$ terms (Figure 1). The US will receive snow cover during the weekend, which will benefit the development of the crop. It provides protection against forecast cold snaps.

According to Trump, he is the best at a number of tasks. His ability is generally self-assessed; however, he is currently the record holder for presiding over the longest government shutdown in US history at 27 days.  The president is currently unable to get his budget approved due to his insistence on US$8bn to build a wall between Mexico and the US.

The shutdown has resulted in 100’s of thousands of government employees being furloughed. The biggest impact to agriculture at present is that the USDA is no longer releasing any new data including export, production and the WASDE report. Although there are many private forecasts available, the USDA data is usually a starting point for the trade.

The longer a shutdown continues the bigger the impact on the US economy. The US government estimates that quarterly growth will reduce by 0.13% per week. This is due to the impact of government workers having less income to spend/invest. The slow down in growth will likely slow down the pace of any US interest rate rises, which are now not expected until Q3 at the earliest.

At a local level, the Australian crop is largely complete. The only area continuing to harvest is Tasmania, which has experienced a fantastic growing season with conditions almost perfect. This has necessitated the construction of additional storage (see here) by Tasmania’s main storage and handling company.

This season has seen very little harvest pressure, as demand on the east coast has stripped supply. The basis levels have largely remained flat since the start of harvest (Figure 3), with the exception of WA. These basis levels remain at post-deregulation record levels and are liable to remain strong through until at least the middle of the year.

What does it mean/next week?:

As the government shutdown continues, there will be less and less current data available for the trade. However, most of the market uses USDA data alongside privately held data. At present, there seems to be no end in sight to the shutdown, with Trump holding his ground.

The real driver in coming weeks will be whether Russia can maintain its export pace and weather conditions in the northern hemisphere.

Cash in your grain and still retain exposure to the market.

There will be many of our readers who use swaps as an instrument in their grain marketing toolbox. The swap is a simple tool to use, and in general, is used pre-harvest but are there opportunities to turn the swap on its head and use post-harvest?

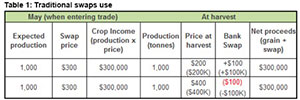
The traditional method of utilizing a swap is to sell a swap prior to harvest in order to lock in a futures price, then unwind the swap by buying it back from the bank at or near harvest. The main point of using swaps as a marketing tool is to create a hedge to protect against downside in physical prices, not as a speculative tool. At its most basic, if physical market rallies you will lose on the swap and gain on the physical and vice versa (Figure 1).

A detailed explanation of swaps and a video on how to use them is available on the below link:

Grain Swaps – farmers’ friend or hazard to be avoided?

The above explanation briefly outlines the traditional use of swaps, with the grower as the seller in advance of harvest. In our previous analysis article ‘3 elements you must consider when pricing grain’, we have explained the importance of thinking of your grain price as three distinct components. It is important to always keep in mind basis and futures.

During a year with low harvest prices, many growers will elect to hold onto grain with the hope of prices increasing in the post-harvest period. The holding of grain has a cost attached (interest lost, storage costs), and alternatives, where you can cash your grain and still have exposure to the market, are an attractive proposition.

With a number of banks, it is possible to turn it around and instead of selling a wheat swap, buy a wheat swap. Let’s say for instance the current basis levels were high (currently the case) and futures were low. It would be possible to sell your physical grain and lock in the basis, at the same time as buying a wheat swap.

The buying of the swap would give exposure to the futures market. Therefore, if the futures market rallied, you would participate in any upside. In an ideal world, you would then close out your swap position when you had reached your target price, and with the addition of the basis already captured, would be your overall price.

It has to be noted that there is also the potential for downside risk, and for many, it may be more beneficial to use a cash and call strategy which has a known ‘worst case scenario’.

The use of derivatives as an alternative to holding onto grain either on farm or in the system storage has a number of advantages:

  • You are able to gain cash flow from the physical sale of your grain.
  • You no longer have to pay storage costs
  • If the basis levels are attractive they are locked in, leaving no exposure to falls.

 What does it mean?:

It is important to understand a number of different ways of marketing your grain, as the tools available will work better in different marketing environments.

The opportunity for growers to buy a swap is best utilized when basis levels are high and upside is limited. This provides exposure to the futures market through the northern hemisphere growing period.

Surety in sorghum?

When it rains, it pours. It’s been a dry year, and to end the month the east coast has received a deluge, with many areas receiving more rainfall over the past week, than they had received for the entire year. What does this mean for sorghum?


The rainfall in Queensland and Northern New South Wales was welcomed by summer croppers, with reports of 100-300mm. This rainfall will provide surety to the sorghum crop, as there should now be sufficient moisture to get the crop through to harvest.

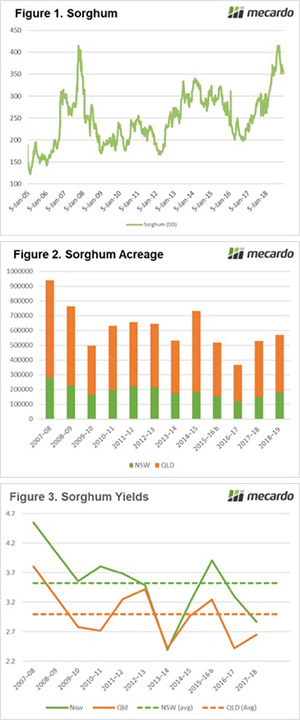
The Sorghum price has been very strong in recent months due to a combination of drought and record numbers of cattle on feed. The peak of the year was reached in September, however has fallen 15% since this time (Figure 1). This peak was at similar levels to the previous record held in the drought year of 2007/08. Nonetheless, even with the sharp fall in pricing levels, Sorghum is still priced well above average.

The question now remains, what size will this crop be? The crop production is made up of two factors; acreage & yield.

The December ABARES report forecast the total sorghum crop acreage at 570kmt, shy of the decade average of 615kmt (Figure 2). However, these forecasts were produced before the December rains, and there is still ample time for producers to seed recently moistened paddocks. I would expect acreage to increase in following updates to levels above average.

The bumper sorghum crop in 2007/08 was due to a combination of both yield (figure 3) and acreage. This resulted in a sorghum crop of 3.7mmt. At present we would like to consider that yields will be at or above average for the coming crop due to the recent deluge. This would place the crop at approximately 1.8mmt, based on the ABARES most recent acreage forecasts. However, with acreage likely to be increased above their forecasts, a 2mmt (or above) production year is not unfeasible.

What does it mean/next week?:

The ABARES forecasts are likely to be ratcheted up as both yield and acreage projections are revised.

The bigger the sorghum crop becomes, the larger the impact will be on pricing of both Sorghum and other feed crops. This will be a relief for grain consumers up and down the east coast as the flow on effect reduces input prices.

However, with record cattle on feed and a poor northern winter crop the pricing scenarios are still expected to attractive for producers.

As always it is a good idea to consider selling in small chunks, especially as production becomes more assured. This will help average up pricing if the market does fall.

Key Points

  • The recent rainfall in NNSW and QLD will provide an element of surety to the sorghum crop.
  • The sorghum market has fallen 15% since its peak in September, however remains at historically attractive levels (for producers).
  • The acreage & yield for sorghum will increase due to positive moisture levels.

Why does it always rain on me?

The sound of rain can be heard on roofs throughout the east coast. This will be welcome to some and a hindrance to others. In this update we take a look at futures for next year, and the last two days deluge.


It is always important to look towards the horizon when creating a strategy for grain marketing. This is especially true this year, as producers in Australia are all likely to receive a historically high price due to the local drought conditions. There isn’t much strategy really required in a year like this.
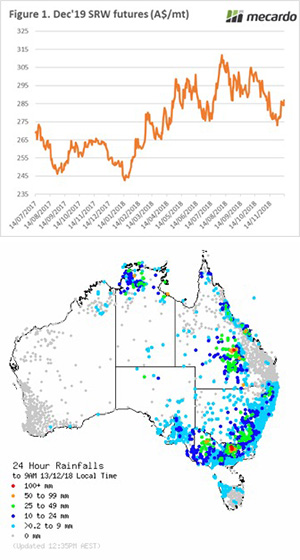
We don’t however know what the outcome will be for next year, will we have a big or small crop? Therefore, it is important to start considering forward sales.  Since the start of the month the December 2019 CBOT wheat contract has increased by 4%, from A$275/mt to A$287/mt (Figure 1). As we move forward into the northern hemisphere risk market, opportunities may present themselves.

Locally the east coast of Australia has received a deluge of rainfall with reports of over 200mm in 24 hours. Technically that will leave many with above average rainfall for the season. Unfortunately, it didn’t arrive at the right time for many.

The rainfall will cause more delays to harvesting, and likely downgrading to quality in Victoria. On a positive note, it will provide some subsoil moisture for next season and place a floor in sorghum production.

The delay in harvest may provide a lift in prices between now and Christmas for prompt delivery, as consumers attempt to gain access to feed.

What does it mean/next week?

There is a meeting in Russia next week to discuss the wheat export pace. The inevitable rumors of an export ban are back to the fore.

It is unlikely that an export ban will be put in place, a more likely result would be some form of curbs. However either action would result in a move back to US exports becoming competitive.

A crude harvest present

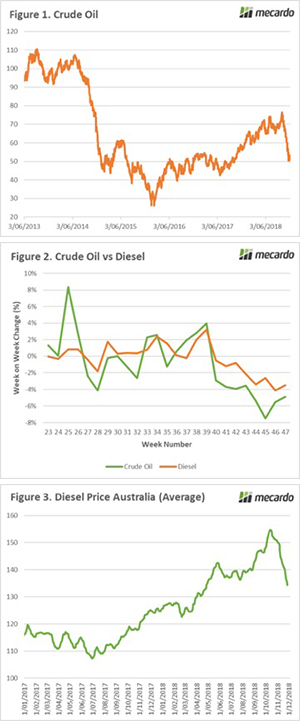
Those who are lucky enough to be still harvesting are receiving an early Christmas present in the form of a reduced fuel bill. Diesel is one of the biggest costs on farm, so it’s worthwhile looking at this downward move.


In mid-September, I covered fuel in the sarcastically titled ‘The great fuel robbery of 2018’. During this time fuel prices in Australia had risen dramatically to the highest since 2014. This led to calls to boycott the fuel companies. My view, in this case, was that boycotting the fuel companies was an ineffective action as the price of fuel is based on factors largely out with the fuel stations control. It is a function of commodity pricing.

In early October crude oil futures reached a four-year peak (Figure 1). The market has fallen dramatically since then. Diesel is a derivative of crude oil therefore when crude falls, in theory so should diesel (and vice versa).

To show this, I examined the weekly change in price between crude oil and diesel over the past six months. In figure 2 the movement in price (as a %) is displayed, clearly showing a strong relationship. This chart uses a lag of one week, which signifies that there is a delay between the value in crude moving and diesel prices.

The correlation between the two commodities is displayed below, with 1 being a perfect correlation and 0 being no correlation.

  • 0 lag : 0.33
  • 1 week lag :78
  • 2 week lag :66
  • 3 week lag :41

The result of this downward movement in crude has been that diesel prices in Australia have started to reflect the fall (Figure 3). This means that any purchases at present should be considerably cheaper than pre-harvest which will be welcome to all.

What does it mean/next week?:

November was the weakest month for crude oil futures during the past decade. This is due to supply outstripping demand, with US stockpiles at record highs in recent months.

Prices are likely to stay weak until we see either an improvement in global economic growth or production curbs enacted by OPEC.

Key Points

  • Diesel is a derivative of crude oil.
  • There is a strong correlation for a 1 week lag in changes in crude oil being reflected in diesel prices in Australia.
  • In November, crude oil had its worst month in ten years.

Crimea river.

This weekend Russia and Ukraine edged closer to war. Many may recall the short conflict between Russian and Ukraine in 2014 which provided a short rally in pricing. In this analysis, we look at what the impact could be if this conflict was to escalate.

On Sunday a Russian naval vessel opened fire on three Ukrainian vessels, detaining them and causing injury to six sailors. The incident occurred in the Kerch Strait, which is a contested area between the Azov and Black sea (see map).

There is an agreement that both countries will have entry through this strait to access their respective ports on the Azov sea. However, in the past year, there have been concerns from both sides regarding inspections of vessels which have slowed down trade in this area.

In early 2014, Russian back separatists fought against Ukrainian forces which resulted in Crimea being annexed by Russia (see map). This has led to a tense environment with fighting continuing albeit largely forgotten about by the rest of the world, despite estimates of 10,000 being lost in the conflict in recent years.

During the initial period of the 2014 conflict, risk premiums emerged within the agricultural markets. However, when it was realized that supply chains would be largely unaffected the market fell back.

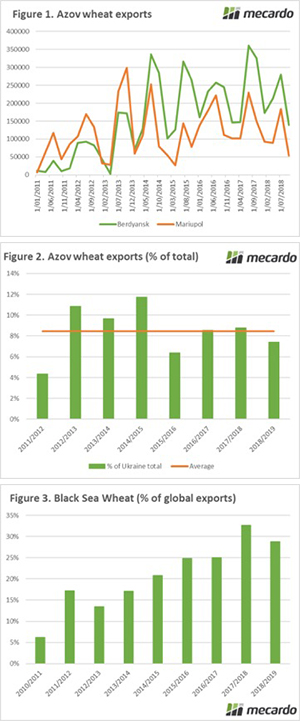
The main ports on the Ukrainian side of the Azov sea are Mariupol and Berdyansk. These ports are mainly used for the export of steel and grain. The drafts at these ports limit the volume which can be exported. The quarterly exports from both ports are shown in Figure 1, with annual exports at 1.1mmt.

It is important to note that that majority of Ukrainian exports are loaded on the black sea, which is not likely to be disrupted by the current tensions. On average the Azov ports load around 8% of Ukrainian wheat exports (Figure 2).

The risk is limited at present, whilst the tension is restricted to the Crimea and the Kerch Strait. However, if there is an escalation of hostilities, the disruption could spread to the black sea ports. It is important to remember how vital Russia and Ukraine are to global wheat exports. In this season it is expected that Russia and Ukraine combined will contribute 30% of the global export task (Figure 3).

What does it mean/next week?:

An escalation to a full-blown conflict is highly unlikely at present and not in the best interests of either country. However, all eyes will be on Putin and Poroshenko in the coming days and weeks.

The international community have expressed concerns with the Russian behaviour, however, it is unknown how much pressure the west can really exert.

In the event of major disruption to the black sea grain trade, there is likely be very strong premiums enter the market, especially considering the reducing global exportable surplus.

Key Points

  • Russian naval vessels attacked and detained three Ukrainian vessels in the Kerch Strait.
  • The ports likely to be impacted at in the Azov sea; Mariupol and Berdyansk.
  • These ports load on average 8% of Ukrainian wheat exports.

Geopolitics at the fore.

It’s been an interesting week, with geopolitics front and centre. Early in the week, we had a fracas between Russia and Ukraine and today the leaders of the world meet for G20 talks. In this comment, we look back at the big drivers in the market.

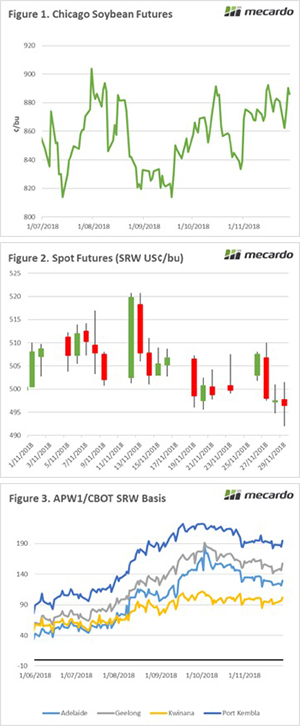
This weekend the leaders of the G20 will meet in Buenos Aires. This could be a very interesting meeting, with the US-China and Russia-Ukraine issues being a considerable talking point. The market has reacted to the potential for positive discussions between Trump and Xi with Soybeans up 3% or 24¢/bu (Figure 1).

The US soybean market has fallen dramatically since China announced tariffs against imports, which in turn resulted in Brazilian exports trading at a strong premium to the US. There are expectations that positive conversations would lead to a relaxation of the current tariff structure.

Chicago wheat futures fell to end the week down 2% or A$8.9/mt (Figure 2). The concerns of distribution to trade flows in the black sea have largely been removed from the market (see Crimea River), as ports in the affected region on export <10% of the Ukrainian crop.

The planted area for the 2019 wheat is expected to be high. Russian winter plantings are expected to reach record levels this season, which although there is a long time until harvesting does point towards the potential for another strong year of production.

Due to the China-US tariff scuffle, soybeans are being held in storage which is becoming a concern for prices during the 2019 season. It is expected that after a 100 year low in wheat planting for last year, we will see a resurgence of wheat acreage.

In the past week, local prices have risen whilst Chicago has dropped, therefore providing an improvement in basis levels (Figure 3). At present, farmers are reluctant sellers, especially with the stop-start harvest that we are currently experiencing.

It is important to remember that these basis levels (or premiums) over Chicago are very strong (see This isn’t the new level). As grower selling starts to increase we may see a decline in premiums, albeit still remaining at historically high levels.

What does it mean/next week?:

If we see a positive meeting between Xi and Trump, we are likely to see a positive impact on markets. There are concerns that continued tariff restrictions between China and the US will have wider economic ramifications, an easing of the tariffs will lead to increased confidence.

Does the forward curve support producers or consumers?

Does the market structure at present offer an opportunity for producers, consumers or both to reduce their price risk for the 2019/20 harvest? In this article, we examine both local and overseas futures to provide some options for hedging.

It is always of great importance to look beyond the current harvest and towards the horizon. This is equally important for both producers and consumers.

The bulk of the wheat price received in Australia is the futures element, with the predominant contract being the Chicago contract (CBOT). In a typical year, basis would account for around 30% of the overall price, in a drought year like present, this will increase substantially.

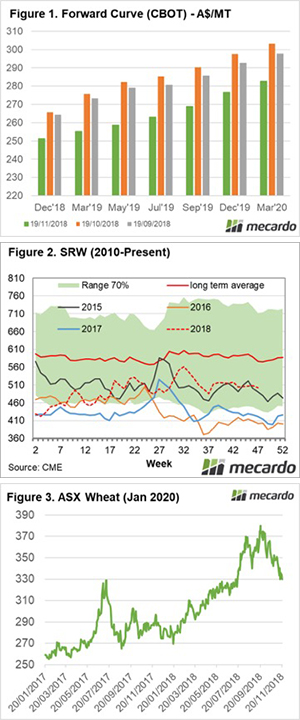
The forward curve remains in contango, where forward contracts are at a premium to spot. At present, the December 2019 contract is at A$276, a A$22 drop from this time last month (Figure 1). This is clearly less attractive for hedging for growers, however, it does provide a much more attractive opportunity for consumers.

This is the lowest level since mid-July, providing a solid floor to start the procurement process for the 2019/20 season. There is a long way to go between now and next harvest and hiccups in the northern hemisphere could lead to substantial price rises. This is especially true during the northern hemisphere risk period where we have seen strong movements in recent years during the mid-year (Figure 2).

What about for producers? In mid-August, I highlighted the opportunity for producers to hedge using ASX for Jan 2020 (see article) and also how this strategy could be used by consumers (see article) in September. At this time, it was possible to lock in A$380 for January 2020. I know that several producers did follow this strategy and the market has now fallen to A$330 (Figure 3). This provided an effective return of A$50p/t.

The market is clearly not as attractive now for producers as it was a month ago, however, A$330 still provides a reasonable base for hedging. This is still a return higher than in recent years.

I generally opt for a risk mitigation strategy where the marketing process is conducted in chunks. This leaves room to continue to participate in any upside, but also not been completely exposed to a market trending downward. It comes back to the old saying, how do you eat an elephant? One bite at a time.


What does it mean/next week?:

The market is currently offering potential strategies for both producers and consumers to reduce their price risk for the 2019/20 season.

The market is very volatile, with local and international conditions for next year on a potential knife edge. No-one knows where the market will be in >12months time, therefore it is prudent to consider strategies to reduce risk, even if only biting a small chunk.

Key Points

  • December 2019 Chicago futures are down $22 to $276 from this time last month.
  • ASX futures for January 2020 have lost some shine falling A$50 to $330 from highs in September.

Thanksgiving or thankstaking?

The USA was closed on Thursday for thanksgiving celebrations. This meant that the market was relatively quiet ahead of the holiday, so the focus on this week’s market comment will be on the local market.  

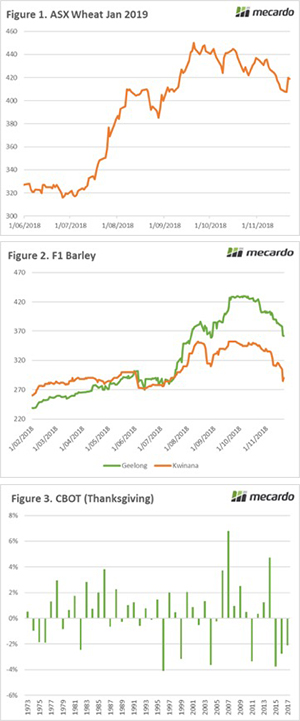
The ASX wheat futures market started the week in the red, as yields surprised, and consumers pulled out of the market. However, on Wednesday afternoon strong trading resulted in the market rising 2% since the previous Friday (figure 1).

The barley market took a turn for the worse this week. On Monday it was announced that China was launching an investigation into allegations of Australia ‘dumping’ barley in an uncompetitive manner. Earlier this year an investigation into US Sorghum dumping led to a 178% bond, this resulted in Australian sorghum becoming more competitive. However, a month later China removed the requirement to pay a bond.

Although prices had been steadily falling since mid-October, the trade reacted strongly to the announcement. This resulted in Barley prices falling across the board (figure 2). Western Australia took the bulk of the hit with prices down 7% week on week and 5% decline in Geelong.

The investigation is expected to last up to 12 months and if a bond is introduced, Australian barley for export will be uncompetitive into China which is overwhelmingly our largest customer.

Prior to thanksgiving volume on Chicago futures tends to dip as traders pull their positions ahead of the holiday. However, what happens when they come back to work? In the past 44 years the market has risen on the first trading day after thanksgiving on 26 occasions (figure 3). Overnight an Egyptian tender was partially filled with US wheat, which will likely give some support for futures when they open.

What does it mean/next week?:

How will the market react as harvest continues? At present it is a Mexican standoff, where buyers hold off and growers store their grain.

There has been strong rainfall in NNSW which will assist with the summer sorghum crop. Although there is still a long way to go until it is harvested, this does provide some confidence.

Harvest pressure despite minimal receivals

With harvest underway yields are coming in near expected levels.  Looking at receivals gives us a bit of an idea where grain is being stored, and where the top ups are coming from. ASX Futures also suggest a bit of heat is coming out of the market.

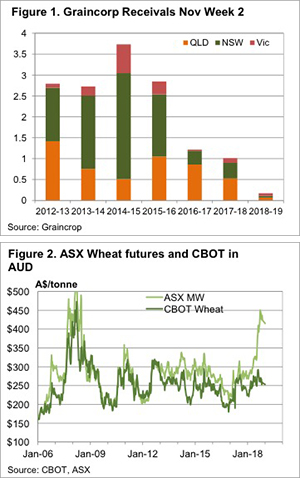
Figure 1 paints a pretty stark picture of how yields are faring early in the harvest. With reports that the Northern NSW and Queensland harvests are basically done, just 170,500 tonnes have been received by Graincorp. A third of receivals have been in Victoria.

Compared to the same week in previous years Graincorp receivals have been minuscule. The way things are headed it looks like it will be hard for Graincorp to receive 1mmt this year. Total receivals last year were 5.58mmt.

Bulk handler receivals aren’t necessarily an accurate reflection of the crop size.  We don’t think that the east coast has harvested just 17% of what was harvested to this week in 2017. Most of the grain harvested this year is likely to be stored on farm or delivered direct to consumers.

It’s interesting to note that Graincorp are reporting ‘Transshipments via port’.  We suspect this is grain which has arrived from WA or SA, which is up to 192,000 tonne.  More grain has come in via ship than has been received up country.

Harvest both in the east and west does seem to be putting some pressure on prices.  ASX East Coast Wheat has fallen another $10 this week to $415/t (Figure 2), while ASX Feed Barley is quoted at $383/t.  Chicago Wheat is also close to a six month low in our terms, Dec-18 is back at $252/t in our terms thanks largely to a rising Aussie dollar.

What does it mean/next week?:

Weather is going to be good for harvest in WA over the coming week, while the east coast might see some delays. With harvest and hopes of a summer crop taking some pressure off markets it will be interesting to see what level growers stop selling at. Some support should be found at $400 for wheat, it’s a nice round number.