Tag: Grain

What in the ag markets changed 254.7% overnight?

Recently there have been releases from both the US Department of Agriculture (USDA) and the National Statistics Bureau (China). There were some very, very big changes to headline numbers.
I have rightly or wrongly always been dubious of supply and demand numbers originating from China. The data reporting does not appear to be as rigorous as other nations and it can be very difficult to obtain a strong handle on what is happening on the ground.

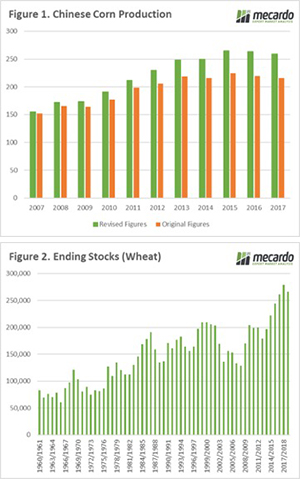
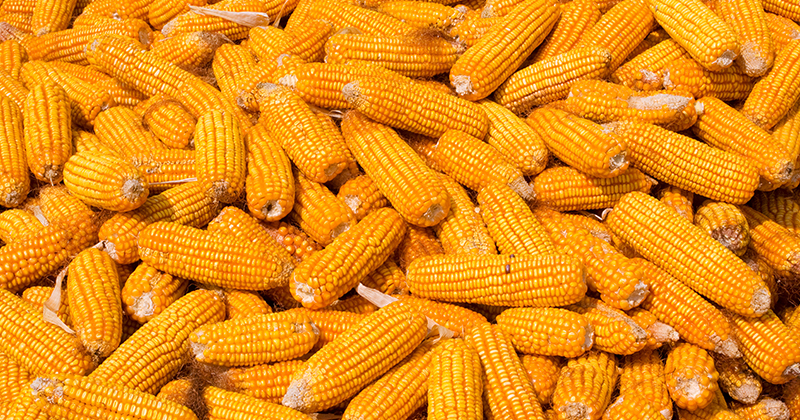
The National Statistics Bureau has revised Chinese corn production from 2007 to 2017 based on census data. This has resulted in large amendments, with production over the period increased by 259mmt (Figure 1). To put this in perspective, China has found 23.6mmt on average over the past decade. Coincidentally, this is the average Australian wheat production for the same period.

The USDA released their November World Agricultural Supply and Demand Estimates (WASDE) overnight. The USDA reflected the change and increased Chinese corn ending stocks by 254.7% between the October and November update. The overall global picture for corn stocks is 307mmt, versus 159mmt one month ago.

If these numbers are truly reflective, then this will reduce China’s need to import corn during this season, or at least until the mandated 10% ethanol in fuel regulation is implemented.

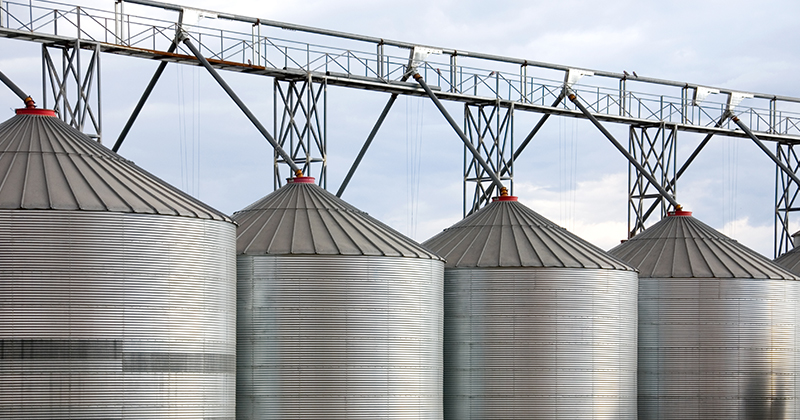
Wheat was also given the bearish treatment, with global end stocks increased by 6.5mmt. This would place world ending stocks at the second highest on record (Figure 2). As ever, we must be cognizant of the fact that 53% of world stocks are held in China and are unlikely to be available to the world market.

The Australian crop was reduced from 18.5mmt to 17.5mmt, which remains above trade estimates. There tends to be a two-month delay in the USDA expressing a change in Australian wheat production from what is happening on the ground. In the December update, it would be unsurprising to see a further reduction to 16.3-16.8mmt. However, this will already be taken into account by the market.

What does it mean/next week?:

As harvest rolls will we get more surprises or will harvest selling pressure bring some downside to pricing?

There is some light rainfall expected for most of the east coast in the next 8 days, which will be positive for the sorghum crop.

Xie Xie Trump.

Social media continues to be an influencer in markets. In the last day we have seen big moves in the market in response to a tweet made by President Trump regarding China. In this week’s comment, we take a look at the markets it has influenced.

Donald Trump announced (through twitter) positive discussions with his counter part in China, Xi Jinping. During Trump’s election campaign, he had alluded to his desire to change the trade relationship with China. This resulted in the announcement of various tariffs by the US and counter escalations by China.

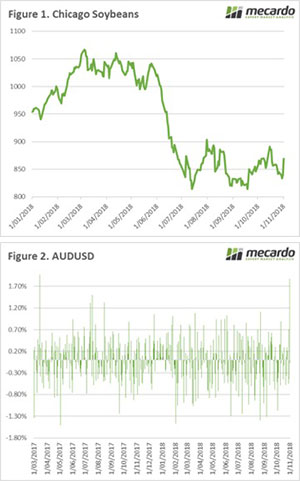
The biggest impact to the US was with agricultural products, especially soybeans. This resulted in US soybeans becoming uncompetitive versus other origins. This was covered in the article ‘What do US soybeans and the Socceroo’s have in common?’.  The Trump tweet has resulted in expectations that positive trade talks would result in an improvement in soybean exports which have been languishing of late. This resulted in strong rally in soybean prices (figure 1) of 4%.

It is important to note that at this stage, the relationship could easily change direction with little notice. As we have seen, the US president has been volatile at times. It’s not over yet.

Yesterday the A$ rose 1.87% rising from 0.7073 to 0.7205. This was its biggest daily jump since March 2017 (figure 2). The expectations of a thawing relationship between Trump and China, along with a positive Australian trade balance for September which was strongly above expectations.

The increase in the A$ technically makes Australian wheat less competitive from an export point of view, however at present we are well above other origins at present. The stronger dollar will provide some benefits for imported products.

What does it mean/next week?:

Trump could easily change his mind and go stronger against China. This would result in any gains and positive sentiment being lost.

The USDA will released their WASDE report next week, giving an indication of the final results of the season from the northern hemisphere.

This week also saw an increase in US wheat export sales (582.5kmt vs exp 200-500kmt), will we see this repeated for a second week?

Canola & Rape futures.

Canola is starting to be harvested but a cloud hangs over the industry. With a massive hay program and dry finish, what will happen to yield and oil content? In this analysis, we take a look at canola basis versus Canada and France.

Two weeks ago, we wrote about canola pricing catching up with the drought conditions in the article “Canola: Finally catching up”. This week we will take a look at the canola futures market.

There is an Australian canola futures contract on ASX. However, it has no trading activity, therefore it is ineffectual. Farmers who are hedging using financial price risk management tools will then have to look overseas for a market.

If we are ignoring local derivatives, the main contracts are Canadian Canola futures (ICE) and French Rapeseed (Matif). The Matif contract is non-GM, whilst the ICE contract is GM.

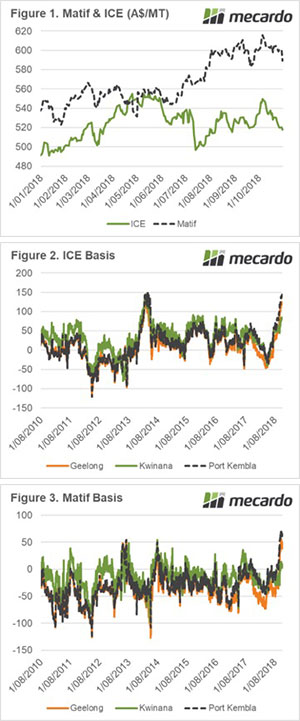
In Figure 1, the Matif and ICE spot contract is displayed in A$/mt. The Matif contract rose through July-September as drought conditions impacted upon the German and French crops. The ICE contract also followed the general market. However, in recent weeks, the market has lost much of its momentum and is sitting below the average from Aug-Nov.

The drought in Australia has drastically impacted canola production, therefore we would expect that the local premium (basis) against overseas futures would rise dramatically. In Figure 2 & 3, the basis between ICE and Matif is shown. Recent weeks have seen a sharp rise in basis levels over both contracts.

The premium over ICE is at the highest level since 2014 and is the highest against Matif during this decade. Typically, when these peaks are reached the market tends to experience a correction, but will this be the case this year?

What does it mean/next week?:

A high basis level usually suggests that it is time to start selling physical. However, a huge amount of uncertainty remains around canola production levels (& oil content). The east coast has a likely deficit of supply which will place pressure on crushers as they move into the new year.

The risk of seed imports is low, however, oil consumers can easily switch to imported canola oil to meet their requirements.

I am confident of strong prices into the new year, however I would advocate for a bite sized selling program as the seed comes off the header.

Key Points

  • Canola prices have risen dramatically in the past month.
  • The price increase is attributed to local
  • Basis levels against both ICE (Canada) and Matif (France), are at their highest levels since the start of the decade.

The hunt for the red October.

This week the market continues its volatility with prices falling globally and domestically. The main factors driving the market into the red has been the Russian crop beating initial expectations and reducing the likelihood of export curbs.

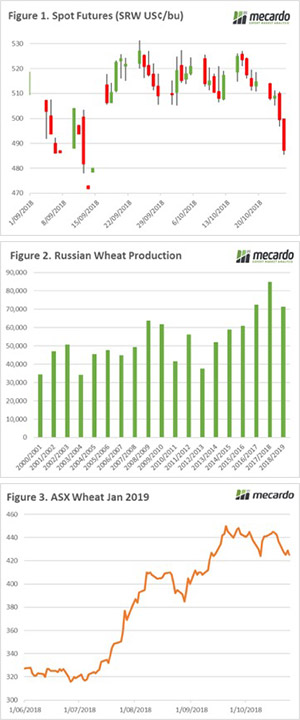
The Chicago futures market has ended the week on a low note. The past week has seen futures fall A$12 since the close last Thursday (Figure 1). The trade is concerned about the increased expectations of the Russian crop and decreased exports in the US. The fall in the overseas market will certainly impact local pricing. The low expectations of Australian exports will, however, be limited, as local drought factors dominate.

Throughout the past few months, there have been concerns related to this seasons wheat crop in Russia. There were headlines discussing the huge drop in production (>15%) year-on-year. Throughout the year we have urged caution, as this number is from the record production year.

The crop has performed above many expectations and is now projected at between 70-72mmt, this is the third largest crop (Figure 2). It is important to remember that although this crop is 15% lower year on year, it is 26% above the average.

At a local level, the ASX contract has lost steam, with January 2019 falling back 3% or $20 in the past week (Figure 3). The strong potential for the summer crop has given buyers some confidence and many are selling their long positions at what are historically high levels.

In recent days, there have been frosts in the western districts of Victoria, the last region of mainland Australia with a decent crop. It is too early to determine the extent of any damage, but in impacted regions, it will reduce the likelihood of any further growers selling whilst the risk is assessed.

The week ahead

The trade will be assessing the progress of harvest as we move into November. It will be interesting to see if grower selling places pressure on basis.

There is more rain expected in the north which will further assist the summer crop. Let’s just hope that the good fortune continues.

A royally good down pour is the Prince-iple talking point in the market.

Grain producers in NSW and QLD have been constantly harried this season, as promising weather forecasts fizzled to nothing. So far October has received the crown for rainfall in many places which has provided much-needed confidence to summer croppers (and consumers).

The Chicago wheat market has closed the week with three straight losses. The rapid pace of Russian exports is pressuring US values (Figure 1). There were concerns throughout the past three months that Russian production would be poor and would result in export curbs. However, this seems increasingly unlikely as the estimates place the crop at either their 2nd or 3rd largest wheat crop.

It is likely that export demand will switch to the US in late 2018 / early 2019 as Russian supplies dry up.

The Russian government is also in the process of selling their stockpiles to the domestic market and have announced that they will not purchase any 2018 harvest wheat. This is not necessarily an issue for Russia at present, however, a poor 2019 will require them to enter the market to support domestic consumers.

At a local level, the recent rainfall has grabbed the attention of the trade. In the past week, many parts of NSW/QLD have received >50mm, this has provided a degree of confidence in the summer sorghum crop.

The BOM has forecast similar downpours over the next week, this will encourage paddocks with previously lower moisture profiles to support planting. At present acreage available for seeding is very high, however there are concerns around seed availability. Despite the positive outlook there is still a long way to go.

The positive sentiment led to the ASX contract sliding A$8 or 2% (Figure 2). The next month will see more surety of the crop with the full extent of the impact the dry September and frost has had on the crop will be determined. The range of estimates from the crop range from <10mmt to 16mmt, clearly a surprisingly low number will cause prices to rally.

What does it mean/next week?:

Harvest is in progress in parts of the country. The reality is that crop forecasts are a very inexact science and the reality will be unveiled when the lie detectors get into the paddock.

The big focus of the next two weeks will be whether the forecast rainfall eventuates. If realised, it will provide some comfort to summer crop producers and many grain consumers.

WASDE & rain

The rain has arrived in the east, but it’s still too early to call the drought broken. Nonetheless, the sound of rain on the roof is great therapy. In this weekly comment, we take a brief look at the WASDE report and how the market has reacted to the downpours.

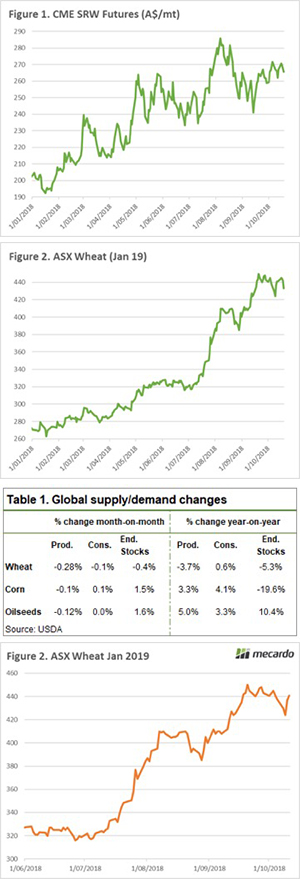
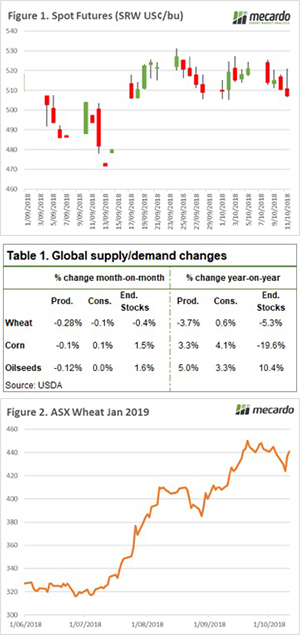
The futures market is down 2% week on week (Figure 1). The market has largely been treading water over the past fortnight with the lack of substantive data. At this point of the year, the world production is largely set with only the southern hemisphere being a relative unknown. The big issue is where we go to in 2019, as globally we are on the tipping point.

The WASDE was released overnight (Table 1).  The report didn’t provide enough fire to really move the market, however global wheat production was reduced overall by 2mmt, with falls in Australia (-1.5mmt) and Russia (1mmt).

The USDA has lowered Australian wheat exports to 13mmt, however, at this point this is overly optimistic. While the east coast suffers through a deficit, the WA crop will find it’s way around the Bight. In the coming months, this figure will be downgraded substantially and impact the availability of global exports.

It was expected that the USDA would drop their projection to 17 or 18mmt, however they were conservative with 18.5mmt. This fall will not be a surprise to anyone in the Australian grain trade and will have little impact on pricing locally as most are working on a sub <18mmt national production figure.

The east coast has seen some very welcome rainfall at the beginning of the week, with more forecast over the next fortnight. This led to a 4% decline in ASX futures, with the contract falling from $441 to $424. However, the market regained all its losses and settled on Thursday at $441. The reality of the rain is that it is too late for the majority of the crop, and the only hope for consumers is the outcome of the summer crop.

What does it mean/next week?:

Harvest is starting to get underway in WA. Over the next month, it will be interesting to see how the frost impacted the crop. All expectations are still for a reasonable crop and sufficient stocks to feed the east coast domestic demand.

In the east coast, many will be watching the moisture profile to make the decision on whether summer planting of sorghum is worthwhile. At present, there are a lot of acres to be planted, with moisture being the only barrier.

Warning: This isn’t the new level.

It’s a dog of a year. There was some hope that September would bring some rain to at least keep the crop stable. Unfortunately, September has brought frost and continued dry weather. As a result, wheat pricing has stepped up a gear. In this article I look at the structure of the market and why it is important to remember that this price is not the ‘new, new’.

At present, the local market is the most important driving factor for pricing, with basis levels trading at post-deregulation records. As an example, basis (Port Kembla) now comprises approximately 45% of the overall flat price, against an average of 13%. Nonetheless, the futures market and overseas pricing should not be ignored.

The futures market has lost ground since its late July/Early August rally and is tracking the 2015 season reasonably closely (Figure 1). US futures have lost strength due to lower than expected exports with commitments at 38% of projections. This is a substantial drop from the typical 57% for this period of the year. The futures pricing, however, does indicate that globally concerns for wheat availability is not yet critical.

In this analysis we have chosen to analyse pricing in Geelong, however, a very similar picture is apparent in all port zones within Australia. In Figure 2, the seasonality of Geelong APW is shown. The stratospheric ascent. The market is currently pricing at $430-445, with limited grower selling. This is clearly an abnormal year for pricing and shows the impact of a drought.

The basis level has clearly been the main driver (Figure 3), with the premium in Geelong over Chicago at +$160. This is a remarkably strong level and as we can see is well above what would be considered the normal range.

At present pricing levels are unlikely to see a substantive fall this harvest and risk management for growers at this point is largely not required. However, it is important to remember that these prices are caused by a drought premium and as figure 2 & 3 display, this is an abnormal year.

What does it mean?:

It is important to understand that these prices are not the ‘new, new’. If we have an average or above year in 2019, the premiums currently in the market will erode very quickly. The market will move back to a pricing point based on the export market and will align with international values.

At present no-one knows how the weather will treat us in the next year. If anyone tells you that they do; they are guessing. It therefore makes sense to investigate the forward market either through physical or futures to commence a structured sales plan for the 2019/20. At present 2019/20 Australian markets have a drought premium already priced in.

Key Points

  • The basis component of pricing in Australia typically contributes around 13% to the overall flat price. This year basis is at a post-deregulation high in all port zones, with Port Kembla at 45%
  • Chicago futures have fallen during August & September, whilst local prices have risen. This has led to very strong premiums.

The pricing levels as present are due to local drought. It is important to understand that these prices will not be around for the 2019/20 harvest if we see an average or above average crop.

Some people feel the rain. Others just get wet.

The drought continues to be the main talking point, with this September being officially the driest on record. The areas that were in reasonable condition at the start of the month (Vic, SA & WA) have all seen downgrades to their potential production. However, it’s not all doom and gloom with welcome rainfall in NSW.
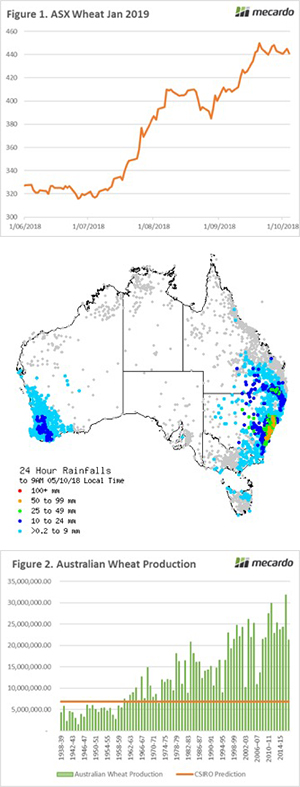
The ASX futures saw strong volume this week, however, is currently marginally lower than the end of last week (Figure 1). Interestingly there was increased interest in delivery periods further on the horizon with trades at $370 for Jan 2020 and $360 for Jan 2021. I wrote on Tuesday about the importance of looking beyond the current harvest (Warning: This isn’t the new level.).

This has been a tough year, however, it is fantastic to see some reports of substantive rainfall in NSW and QLD (see map). It is much too late for many crops, but it will fill some dams and assist with the moisture profile for the coming summer planting. Most of all, it improves everyone’s wellbeing.

The CSIRO has released crop updates based on their Yield Gap model. They currently predict an overall yield of 0.62mt/ha, this equates to 6.8mmt. In comparison, in the last ABARES update a yield of 1.45mt/ha or 16mmt was forecast. This is a bold call from CSIRO, however as we all know a ‘small crop only gets smaller’.

This forecast would place the crop at the lowest level since 1972/3 (Figure 2). They may indeed be correct, but I think that market forecasts of between 12-16mmt are more realistic.

What does it mean/next week?:

In the next week, we will see the WASDE report released, I don’t expect many big surprises in this report as most crops are now a known entity.

There are many in the industry examining the possibility of importing wheat or by-products for feeding purposes, as many consuming industries are unable to remain profitable at these levels.

Prices are soaring like an eagle.

It’s another week of increased pricing. In this week’s comment we look at wheat pricing, the new action in canola and increased to global wheat production. 

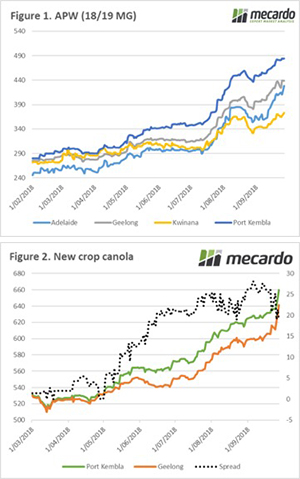
The continued poor conditions and lack of grower selling has led to further increases in pricing in the past week. All zones have shown strong rises, with the lowest being in the Port Kembla zone, at a meagre 1% (figure 1). The reality being that in NSW and QLD, there isn’t much value in increasing prices because it just isn’t available to buy.

Two weeks ago I wrote about the relative inaction in the canola market (see link). At this point the canola market has only risen 10% since the beginning of widespread drought panic whereas wheat had increased an impressive 27%. A combination of the high price of hay alongside dry/frosted conditions in the east coast has led to substantial cutting for hay.

It seems that this is now starting to filter to the buyers. In the past two days prices have markedly advanced, with Port Kembla and Geelong rising 4-6% week on week (figure 2). The spread between Port Kembla and Geelong has decreased from its season high in early September, as buyers chase areas of potential production.

The International grains council has increased its forecast for this year’s wheat crop to 717mmt after improved prospects in Russia. This provides some limited breathing room for importers, but, for Australian producers the only real concern is the local situation.

What does it mean/next week?:

The market really is soaring like an eagle in Australia, but it is bittersweet. The reality is that this drought is no good for anyone on the east coast. The consumers of grain are paying prices which will massively impact upon their profitability. Grain producers will find that the higher price will nowhere near offset the reduced yield.

The great fuel robbery of 2018

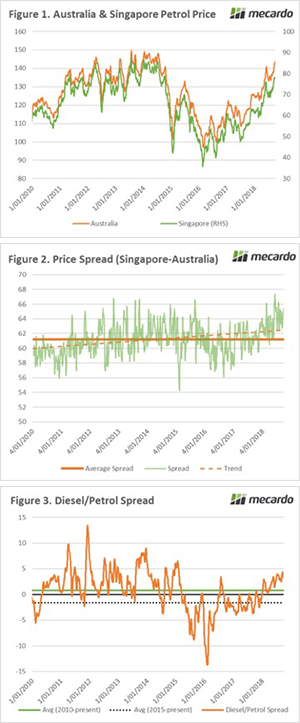
Fuel prices have seen a dramatic rise in recent days. Talkback radio has been airing calls to boycott the petrol stations. I thought it was therefore worthwhile revisiting fuel prices within Australia – are we being screwed over?

We start our journey in Singapore, where the bulk of our fuel is imported from. In Figure 1, the Singapore and the average Australian petrol price (at terminal) is displayed since the turn of the decade. There is an extremely high degree of correlation between (0.9615), with 1 being a perfect correlation and 0 being no correlation. In effect, this shows that when Singapore prices increase, our prices will also rise.

In Figure 2, the spread between Singapore and the average Australian price has been plotted, with the 7-day moving average to smooth out the data. This will give an indication of whether we are paying a higher premium, and therefore being gouged. However, the current spread is quite close (4¢) to the average compared to the start of the decade (61¢), but in recent years the trend has seen a rising premium in Australia.

The fuel premium in Australia over Singapore can be attributed to logistics and excise duties on fuel. However, the relatively narrow range that the basis trades within can allow us to effectively use Singapore fuel pricing to determine our price (or even hedge).

The major machinery items on-farm use diesel, and whilst we were looking at spreads, it is worthwhile to examine the spread between diesel and petrol prices. In Figure 3, we have plotted the spread, again using the 7-day moving average. At present diesel is currently pricing at a premium over 2.97¢ over petrol. This is above the average of 0.82¢ above petrol since the turn of the decade.

Interestingly however, since the start of 2015, the spread has been a lot lower, with diesel being discounted at 1.6¢ below petrol.

What does this mean?

In reality, this isn’t the great robbery, more a result of market forces.

The cost of my 600km a week commute has increased substantially. As much as it would be nice to blame the fuel companies, the price is a result of the market. It is important to remember that a large chunk of our local fuel price is fuel excise and we will be unlikely to see a government reduce taxes on fuel.

By looking at the numbers, it means that petrol and diesel prices are largely following the international market. There doesn’t seem to be any evidence of gouging, as spreads between Singapore and Australia have remained within the narrow band that we have historically experienced.

To those calling for a one-day boycott of fuel stations. It really won’t make a difference. Those who use a car have a relatively inelastic demand for fuel, if we don’t purchase on one day, we will buy it on another day. The impact on fuel companies will be infinitesimally small.

Key points

  • The bulk of fuel in Australia is imported from Singapore
  • The correlation between Singapore prices and Australian is 0.98, almost perfect.
  • The spread between Singapore and Australia has risen strongly above the decade average.