Tag: Grain

USDA Day

A relatively downbeat week in the grain trade, with the world watching and waiting for the next big driver of pricing. The big data release for the week was the USDA world agriculture supply and demand estimates.
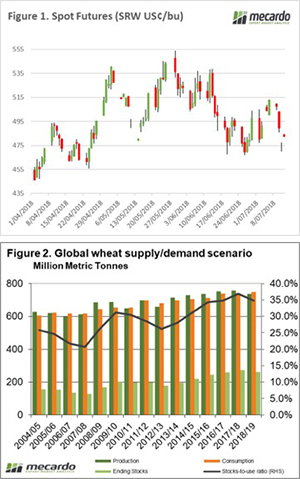
There has been a high degree of volatility in the past week as traders scope for telltale signs of weather impacted yields in the northern hemisphere. The market has recovered A$5 overnight, but week on week the wheat futures market is down 6% or A$14 on the spot contract (Figure 1).

The July USDA report was released overnight. The report called major reductions for wheat production around the world. The global end stocks for the coming season were dropped to 250mmt, the lowest since 2016/17 (Figure 2).

The USDA has lowered consumption of wheat by 2.3mmt, however, this was more than offset by falls in production. Dry conditions around major crop growing regions are the driver of this downward movement in Australia (-2mmt), EU (-4.4mmt), Russia (-1.5mmt), Ukraine (-1mmt).

This report was generally bullish in nature and points towards a tightening global wheat market. Although global wheat stocks will still be the second highest on record, production by the main exporting nations is slipping.

What does it mean/next week?:

This week will see more certainty as the northern hemisphere harvest progresses. There are a few tenders in the next few days which will give some indication of pricing signals.

Locally in Australia VIC, SA & WA are forecast to receive reasonable rainfall events in the next eight days. It however, looks like NSW is set to miss out.

We continue to live in interesting times

It is going to be a very interesting fortnight. All the major factors which impact grain pricing are likely to come into play, adding volatility. In this weekly update, we take a look at the two big uncertainties – geopolitics and European downgrades.

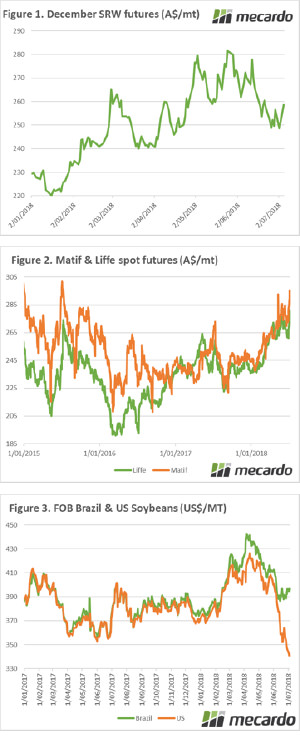
The US futures markets were closed for the 4th July celebrations. When they opened, they have done so with a bang. The December SRW futures contract is up 3% overnight or A$7/mt (Figure 1). This puts us back to slightly above the end of last week.

The rise can be attributed to the dry weather conditions in western Europe. The run of hot weather and poor rainfall has resulted in downgrades in Germany and France. The German crop was yesterday lowered to 41mt, the smallest since 2007 (and 9% lower year on year). In the past week, the French crop was reduced by 4mmt.

Even in god’s country (Scotland), I am hearing from contacts of yield expectations being the lowest in recent memory. The national farmers union have reduced the UK crop from 14.5mmt to 13.5mmt. These drops have led to a sudden rise in French wheat futures (matif) and London wheat (liffe) which can be seen in Figure 2.

The tariff scuffle between the US and China will likely kick up a gear today as tariffs are set to be enacted. The US government will commence tariff collection at 2 pm this afternoon, with China to begin retaliatory tariffs immediately after. In recent hours Trump has escalated concerns, commenting that $500bn in Chinese exports could be targeted. The Chinese threat of tariffs on US soybeans has led Brazilian supplies achieving strong premiums (Figure 3) – in fact, the largest premium since 2004.

Also, if you would like to hear my dulcet tones you can watch my market update on The AgShow on the link below:

Commodity market Update

What does it mean/next week?:

There are three main areas to keep an eye on during the next week:
-US/China tariff escalation. Any impact on the Chinese economy is likely to result in a fall in the A$.

-Rainfall. NNSW remains quite dry, with very little rain due in the next eight days.

-Europe. As the EU starts to harvest, will the old adage of a small crop getting smaller come into play?

What do US soybeans and the Socceroo’s have in common?

The past week has largely been void of new fundamental data to move markets. The big issues of the week are political in nature, with only one week until tariffs are in place against a multitude of US agricultural products. So, what do US soybeans and the socceroo’s have in common? They are both uncompetitive.
The wheat market continued to retreat over the week, with Chicago futures down 11¢/bu or A$3/mt. Northern hemisphere producers have started selling their crop, placing pressure on the market. Will this continue or will growers stop once they have met their cashflow requirements?

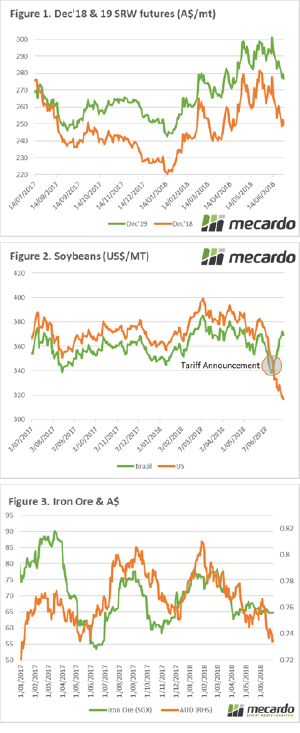
In Figure 1, the December futures contract for both 2018 and 2019 is displayed. As expected both contracts have experienced a decline in line with one another. In past analysis articles during April and May, we have outlined good hedging opportunities, especially for December 2019.

During this point in time, it would have been feasible to lock in A$295-300/mt. At even the most conservative estimate of basis, this would have led to a price well above $300/mt. At present, the Dec’19 contract has contracted to A$276/mt. Although a less attractive hedge, it would still provide an attractive price; using average basis levels this would likely lead to a $300-310 price.

We are one week away from implementation of Chinese tariffs against a multitude of US agricultural products (see here). China is set to implement a 25% tariff on US soybeans, this instantly makes US supplies uncompetitive versus other origins. The result can be seen in Figure 2, which displays both US and Brazilian soybean prices. Brazilian soybeans have moved from trading at a discount to the US, to trading at a strong premium (US$50/mt).

If the tit for tat retaliation between the US and China continues, we could see a reduction in global trade. Our currency in recent years has largely followed the economic performance of China. In the past week, we have seen the A$ drop to the lowest levels since early 2017 (Figure 3). It will be interesting to keep a keen eye on Iron ore pricing, as this can be an indicator of economic performance in China.

What does it mean/next week?:

There has been a lack of fresh data in the past week, however, there will be new data released from Canada and the US. Reports at this time of year can provide big surprises, as real data from the field flows into the analyst’s lap.

The rainfall in QLD/NSW this week was not quite as healthy as hoped however provided a lifeline. There are substantial falls expected for WA towards the middle of next week, which will hopefully provide a floor in yield.

We have lift off.

The wheat market is firing on all cylinders. We are going to the moon. The pedal is to the floor. We are cooking with gas.  These are a few appropriate analogies for the market movement this week. In this article we look at the price movements in Australia and seven other markets around the world. 

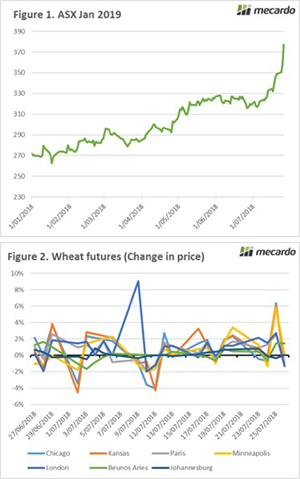
The ASX east coast wheat coast contract has been on a steady climb over recent weeks however this week the market has been on fire. The price has increased a whopping $27 since last Friday (fig1). This is because of continued dry conditions on the east coast in conjunction with the flow on effect from the wider worlds woes.
It is a catch-22 for many, as although prices are high many are not able to take advantage due to lack of production especially in northern NSW/QLD. The high price is very unlikely to mitigate for the loss in yield. The producers in Victoria and parts of South Australia with reasonably good crops will all going well be able to take advantage of the benefit of inflated pricing.

As alluded to earlier, conditions in other parts of the world are on a downward trend. In last weeks update I mentioned that northern Europe is in dire straits. The last few days of harvesting are pointing to this resulting in Europe’s export capacity declining. This has resulted in futures around the world rising, with the majority of wheat exporters now seeing year on year declines in exportable surplus.

In the last fortnight the different wheat futures around the world have seen solid gains (fig 2), with only between 3-4 days of negative results (dependent upon bourse). It is going to be an interesting month as we gain more resolution on the northern hemisphere crop.

What does it mean/next week?:

In Australia the lack of rainfall is likely to result in continued strong pricing well into the 2019/20 season on the east coast.

The commitment of traders report will likely see an increase in the long (bought) position in wheat by speculators. At some point they will likely want to take their profits leading to some price correction. Nonetheless the fundamentals are supporting these strong levels, especially in Australia.

Uncertainly certain.

As we near the northern hemisphere harvest period, volatility comes into the market, further assisted (and at times hampered) by continued political posturing by the giants of the US & China. In this week’s comment, we look at weather concerns and pricing in the world’s largest wheat producer.

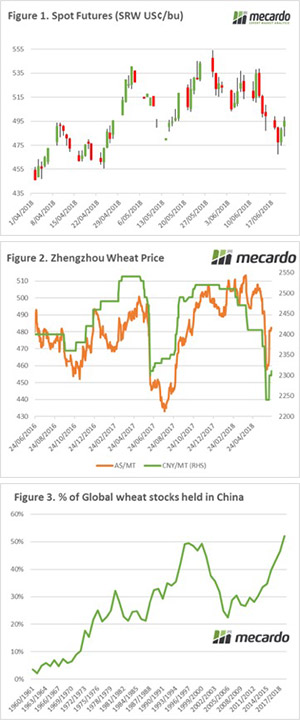
At the end of last week, the markets were rocked by the erection of tariffs firstly by the US, followed by retaliation by China. The worst impacted ag commodity was soybeans (see article), however, wheat didn’t fare all that better. The spot contract had lost 23¢/bu between Friday and Tuesday but has since regained its grounds returning to Friday levels (Figure 1).

The June/July period is typically the most volatile time of year due to the start of the northern hemisphere harvest. There are diverging opinions on the outlook for the black sea region, with some analysts dropping production estimates at the same time as other raising them. One thing we know with certainty is that that region has a high degree of uncertainty; surprises are common.

China is the world’s largest wheat-producing (and consuming) nation and they have had a hiccup this season. Poor weather has hampered the crop resulting in a fall in forecasts for the crop, with official Chinese government estimating a drop of 3mmt year on year. The crop concerns have resulted in local Chinese prices rising since the start of June, albeit from a multi-year low (Figure 2).

This may lead to an increase in imports which would likely originate from out with the US due to trade tariffs. We do have to be cognizant of the fact that China holds very high stocks of wheat (Figure 3), holding more than half the world’s wheat inventory.

What does it mean/next week?:

At a local level, there is welcome rainfall forecast for WA, NSW & QLD. The forecasts of rainfall for NSW and QLD in recent months have had a worrying tendency to fizzle out. Let’s hope that this rainfall comes to fruition.

It would not surprise me if we saw additional tariff announcements by the US this evening. If we do, China will ramp up its tariffs shortly afterwards.

Teetering on the edge

It was a big week in the grain markets with the release of crop forecasts from the US and Australia. The market teeters on the edge of a bull market causing a high degree of volatility. In this weeks market comment we take a look at the A$, futures and new crop basis.
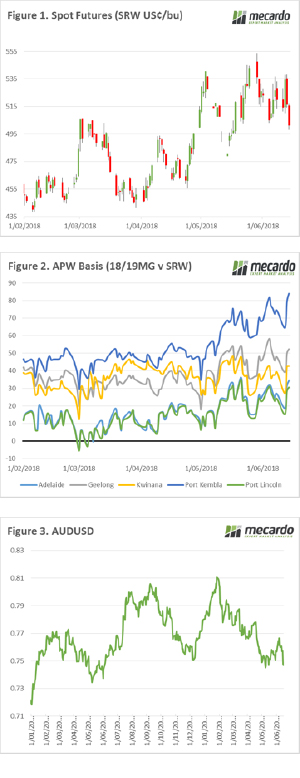
The futures market has been volatile this week (Figure 1), with Chicago spot futures trading in a range of 501.5-534.5¢/bu. The market is currently at $5 below the close on the last Friday. The midweek rally was as a result of the generally bullish data in the WASDE report, especially the sudden fall in Russian production estimates. Gravity, however, had its impact on the market, with traders digesting the WASDE report with concerns related to high ending stocks and uncertainty in the Russian seeding numbers.

Our greatest concern at present for Australian wheat producers and consumers is the conditions locally, especially in NNSW & QLD. In these regions, the crop has gone into minimal soil moisture and received little in the way of meaningful rainfall. The domestic demand in these areas is high and the likely drop in production will be a primary driver of basis on the east coast.

In Figure 2, the new crop basis levels are displayed and we can see the strong increase in levels in the past month as conditions show little sign of improvement. A higher basis level indicates that we should be considering selling physical, however at this point in time, production risk is too high in most places to consider substantial volumes.

The A$ has taken a nose dive in the past day (Figure 3). This was a result of weak Chinese economic and neutral Australian employment data. A lower A$ makes our export commodities more attractive versus competing origins, on the other hand, it makes our inputs more expensive in local terms.

What does it mean/next week?:

The June/July period tends to have a high degree of volatility as the northern hemisphere heads for harvest. This year with supply and demand teetering on the edge of a neutral/bullish market, it will not be unexpected to see large swings in pricing on futures.

The big risk is to the Australian crop and with the BOM forecasting a drier than average 3 month period, we need to take this into account in our marketing plans.

CBOT up as a start to the season appears

Chicago Soft Red Wheat managed to maintain its upward trend this week. It had an attempt at moving lower but bounced stronger on Wednesday night. Local wheat prices also tried to go lower but found strength on Thursday.
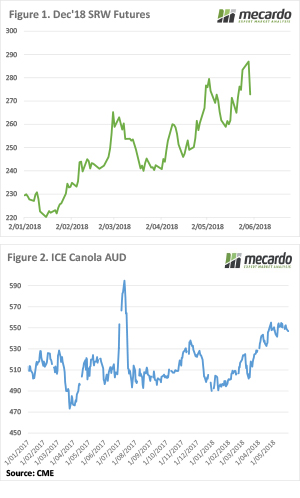
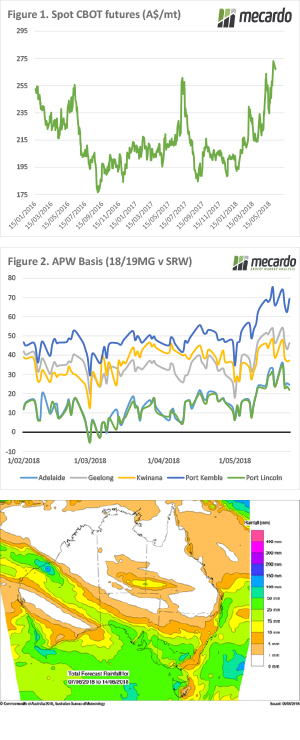
Figure 1 shows CBOT wheat in AUD/t sitting just below the highs hit at the end of May. Still, $267/t is close to the best swap price we have seen for the December contract since 2015. The market did move a little lower earlier in the week before recovering. Apparently there was some speculator profit-taking triggered by the higher levels, and the Aussie dollar found some strength this week.

The AUD is actually back at 76.5US¢, its highest level in six weeks thanks to some stronger economic data.

Locally wheat prices followed CBOT’s trend, finishing the week on a high. While new crop APW basis in the Newcastle zone is at around $100/t basis, in the south it’s close to $50/t (Figure 2). If crop prospects continue to weaken Geelong basis could rally to $80-100/t as well, so at $320/t it could end up being cheap.

Old crop markets continue to tighten, with any remaining grain being held tight, and buyers having to pump up prices to get hold of it. A good rain and some grass growth might take some of the pressure off demand, but supply relief won’t turn up until the new crop arrives; if it does at all.

The week ahead

Figure 3 shows some good rain forecast for Victoria and southern NSW this week. In fact, most of the Mallee, parts of the Riverina and SA are expected to get their monthly average rainfall over the coming 8 days. This will give crops a start, but with no subsoil moisture, follow up will be required before the heat comes out of markets.

Volatility in the US not impacting here -yet

The wheat yo-yo continued in the US as they approach harvest. Chicago Soft Red Wheat rallied to new highs this week, before easing back again. The charts are pointing to more upside, but supply will soon start rolling in.
It was all up for CBOT wheat late last week, but after the long weekend in the States, some profit taking and pre-harvest grower selling sent values back to 574¢/bu.  In our terms, Dec-18 reached $285/t, before finishing yesterday at $272/t.

Figure 1 shows the classic rising price trend. Wheat prices are making higher highs and higher lows. At some stage, the market will make a lower high, which signals the end of the rally.

Wheat prices are trying to come to terms with this year’s lower production, but there has been a lot of speculator activity on the buy side. This might dissipate when harvest starts rolling in.

The latest US crop condition report has 38% of the wheat crop in good or excellent condition, compared to 50% last year. Poorer condition means lower yield, how much lower is the question.

Locally things were relatively steady despite the fluctuations in the US. The spreads of recent years remain in place, with price ranging from $355 at Newcastle for an APW Multigrade, to $296/t at Port Adelaide.

Canola prices in Canada have steadied at around $550/t in our terms. In quite an unusual quirk, new crop canola prices are still at a negative basis to ICE Canola. Yesterday’s Geelong Canola price for 18-19 was $546/t, despite what should be dwindling production expectations.

The week ahead

There are some promising signs on some of the 7-14 day rainfall forecasts, which might get the crop going in NSW if it eventuates. It’s interesting that basis hasn’t really gone as crazy are you might expect given the dry, with new crop supplies expected to alleviate some the current supply shortages.

The is some potential for downside in international markets, but not too near the 220s of earlier this year.  Maybe back to $250/t during the wheat harvest, and if summer rainfall is good in the US there might be more downside.

The Russian Steamroller

In recent years our comrades in Russia have been the most important driver of the wheat market. Their technology and logistics have improved to ensure that they are efficiently (& cheaply) producing a huge exportable surplus. When there is a hiccup in this region, the impact is felt around the world. In this comment, we look at the past weeks performance, and specifically what is happening in Russia.

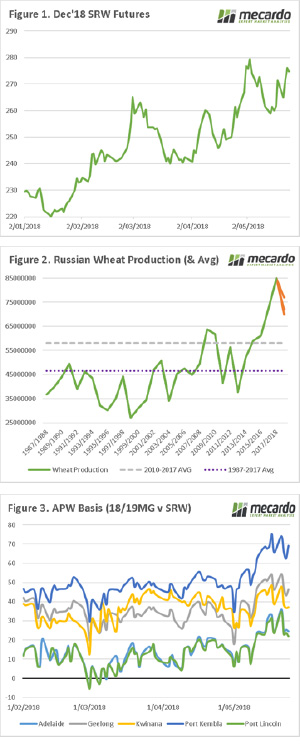
The weather market is in full swing. Last week saw the market lose most of its early month growth, only to post a very strong turn around (Fig 1). At present, December wheat futures are up a$9/mt since the close last Thursday.

The rise in the market can be attributed to poor weather conditions in Australia (more later) and Russia. The Russian wheat growing regions have experienced warm and dry conditions over the past fortnight. These dry conditions in conjunction with limited forecast rain has resulted in concerns mounting. The Russian wheat crop has been down grade with estimates from 70mmt to 77mt, this is a huge drop from the 17.18 record of 84-85mmt.

It is important to put this downgrade into perspective. In figure 2, Russian wheat production since the end of the USSR to present has been displayed. The estimates for this season are displayed in orange. Dependent upon analysts estimates, Russian could produce either the 2nd or 3rd largest wheat crop. It is also mindful to remind ourselves that the average crop for this decade is 58mmt, or 54mmt if you don’t include the past season.

At a local level, the Australian crop remains on the precipice. There has been some meaningful rainfall in parts of central and northern WA, however initial reports are that the great southern and Esperance have largely missed out. The weather forecast has led to a fall in basis levels (figure 3), from the week prior, albeit they remain at attractive levels.

What does it mean/next week?:

The most important factor for Australian producers and consumers of wheat is the local weather. The 8 day forecast for NNSW & QLD remains bleak, and this is where the largest concentration of domestic demand is situated. The continued poor conditions could lead to the incredible high old crop values persisting into the new marketing season.

The negotiations between the US and China will be of interest. Although not set in stone, China have agreed in principle to purchase US$25bn of US agricultural products per annum. It is not clear when this will commence, or what commodities they will accumulate.

Basis on the rise

The weather continues to be the biggest driver of the market both globally and now increasingly at a local level. The Australian crop is currently on the precipice, with a huge degree of risk currently being priced in. In this weekly comment, I take a look at the weather forecast and basis levels.

Figure 1 displays the December wheat futures contract since the start of the year. This contract aligns with the Australian harvest and is typically the most appropriate for hedging purposes (for producers). As we can see much of the gains of early May have been lost. At it’s highest point in May the December contract was at A$279/mt, although in recent days the market has gained some traction, the current level of A$261/mt is not an insubstantial fall. The market however is prone to volatile behavior at this point of the year, and large market swings can potentially occur.

Our biggest concern for both grain producers and consumers in Australia, are the local conditions. The BOM released their rainfall forecasts for June to August (see map). This map details the change of above median rainfall. Our concerns are growing for the majority of the wheatbelt, but especially NSW and WA. Our hope is that the forecasts are wrong, and that a deluge is imminent.

Let’s take a look at basis levels (Aussie premium or discount over CBOT). As we all know, our basis level will increase when weather conditions deteriorate. In figure 2, the spot (old crop) basis is show, as we can see the basis level has increased dramatically in the past week. This is as a result of both the weather premium, and demand for the shrinking stockpile of old crop, especially in northern feed demand areas.

In figure 3, the new crop APW1 MG basis is displayed. The basis level has increased to it’s highest point this season. Although there is still a long way to go before harvest, if weather conditions remain dire, then this basis level will increase. This will provide minimum solace, as high prices and poor yield is a poor outcome for everyone.

If you are interested, I was asked to give a summary of the market to the Sky News Ag Show. The video is on the link below. However, please note I am not a seasoned TV personality!

https://www.weeklytimesnow.com.au/agribusiness/the-ag-show/the-ag-show-featuring-auctionsplus-chief-executive-anna-speer/news-story/6c3256aef5e4a96b32a6b6ecb1709280

What does it mean/next week?:

Let’s just keep an eye on the weather. Although cash prices are currently high, it is prudent to think strongly about physical risk, and washouts at present.