Tag: Grain

A lot can happen in one month.

Key Points

A month is a long time in markets. A lot can happen, and opportunities can be lost or gained if you wait a month before making a decision. In this weekly update, we take a look at what has happened over the past month.
As discussed in yesterday’s analysis article volatility has increased in recent months to higher than average levels for this time of year (See: More months of uncertainty).

Chicago wheat futures have been in a steady decline since last Thursday, in US terms the market has fallen from US$209/mt to A$200/mt for the December contract. During the same period, the A$ has advanced to trading at a range of 63-64¢. This has resulted in December wheat futures falling from A$329/mt to A$316/mt in the same timeframe.

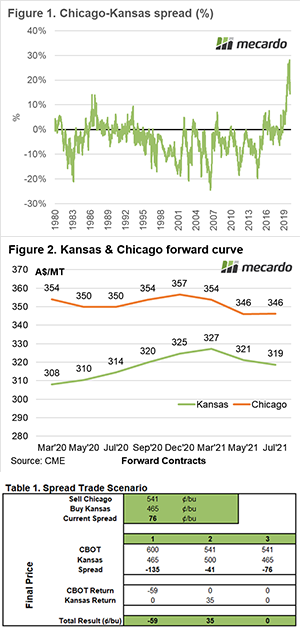
In the past month, we have seen a large fall in wheat futures levels in part due to a rising Aussie dollar and a depreciating CBOT. During the week commencing the 16th March, wheat futures rose from A$310 to A$348, and continued through the next week to reach a high of A$355 (figure 1).

The market has given back most of the gains since that point. There are many farmers who benefitted from this rally in pricing levels by taking out wheat swaps for next harvest.

It is important to develop a marketing strategy which will take the emotion out of selling decisions, this will help gain a higher overall price.

Remember to listen to the  Commodity Conversation podcast by Mecardo

What does it mean/next week?:

Parts of Europe and the black sea nations have been dry. However, the next fortnight is expected to see improved rainfall.

Seeding has started in Australia, and will likely ramp up towards the traditional ANZAC day start. The majority of farmers are quietly confident of the conditions.

Easter bear?

Key Points

The USDA released their April world supply and demand estimates report overnight. Although a bearish report, the market largely ignored the data and moved higher.

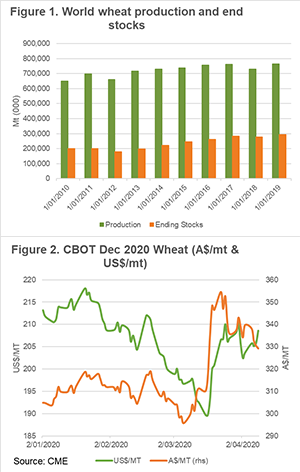
The USDA report was bearish, and normally that would have led to a fall in pricing however we live in different times. The headline numbers of the report show that global wheat production is set to hit record high levels at 764mmt, a rise of 33mt on last year. To put this in perspective, this is more than Australia’s record crop in 2016.

In addition, global consumption is reduced by 5mmt, leading to end stocks being increased to a record-breaking 293mmt. As discussed in previous updates on the USDA end stocks information greater than 50% of stocks are held in China and likely inaccessible to the wider market.

After two days of deteriorating CBOT values, the market gained US$2. In Australian dollar terms however, the market has lost ground, down A$11 since the end of last week. This is as a result of the Australian dollar regaining a lot of ground and currently trading at 63¢.

These next four weeks will provide some more clarity on the northern hemisphere crop, whether it will stay large or fall back. The one thing to be certain of is that historically the period late April to July has plenty of excitement.

Yesterday the Mecardo analysts produced a podcast discussing what is happening in the agricultural markets at present.

Remember to listen to the  Commodity Conversation podcast by Mecardo

What does it mean/next week?:

Volatility will prevail. There is a high degree of uncertainty in the marketplace caused by COVID-19, however, the fundamentals always prevail.

At present Australia is on track to produce a good crop, the rest of the world is likely to follow. It is time to consider your risk management strategies.

Disease keeping wheat prices strong.

Key Points

The market has been assisted in recent weeks by the high levels of uncertainty. This week the wheat price has fallen, albeit remains strong.

Let’s start this weeks’ commentary on a global level. The price of a December CBOT wheat contract has fallen dramatically in the past week. On the 25th March the contract was trading at A$352, it has now fallen to A$334. A fall of A$18 is considerable, however it has to be noted that it had risen A$51 during the preceding ten trading days (figure 1).

In Australian dollar terms the futures have lost some ground as our dollar increased from 55¢ to 60-62¢. A higher dollar reduces the price on an Australian denominated swap.

Fundamentally the wheat market is relatively bearish, however, the uncertainty caused by COVID-19 and the associated government interventions can add a huge amount of volatility. Here are a few reasons for movements lower in wheat:

  • There are deepening concerns related to the global economy. As unemployment rates around the developed world skyrocket there will be a slowdown.
  • Eqypt, traditionally the worlds’ largest wheat importer started a tender process then suddenly pulled the tender.
  • There has been speculation that Russia will introduce an export ban. At present this is proposed as a 7mmt export limit between April and June. In reality no more than 7mmt would likely be exported in this time frame.
  • Corn prices continue to edge lower as ethanol drops to record low levels in the US.
  • The FAO expect near record wheat production in 2020.

In reality, the market has bearish tones, and if it were not for COVID-19 the pricing levels would likely be substantially lower than they are at present.

Kansas/Chicago – A spread trade strategy.

Key Points

Kansas typically trades at a premium to Chicago. However, since 2018 Chicago has been running at a strong premium. In September we put forward a strategy for a spread trade to benefit from a mean reversal in values.

The two wheat contracts in the US are the Chicago soft red winter (SRW) wheat contract and the Kansas hard red winter (HRW) wheat contract. These are two distinct contracts with differing specifications, the SRW is low protein (9.5%) whereas the HRW is mid protein (11%).

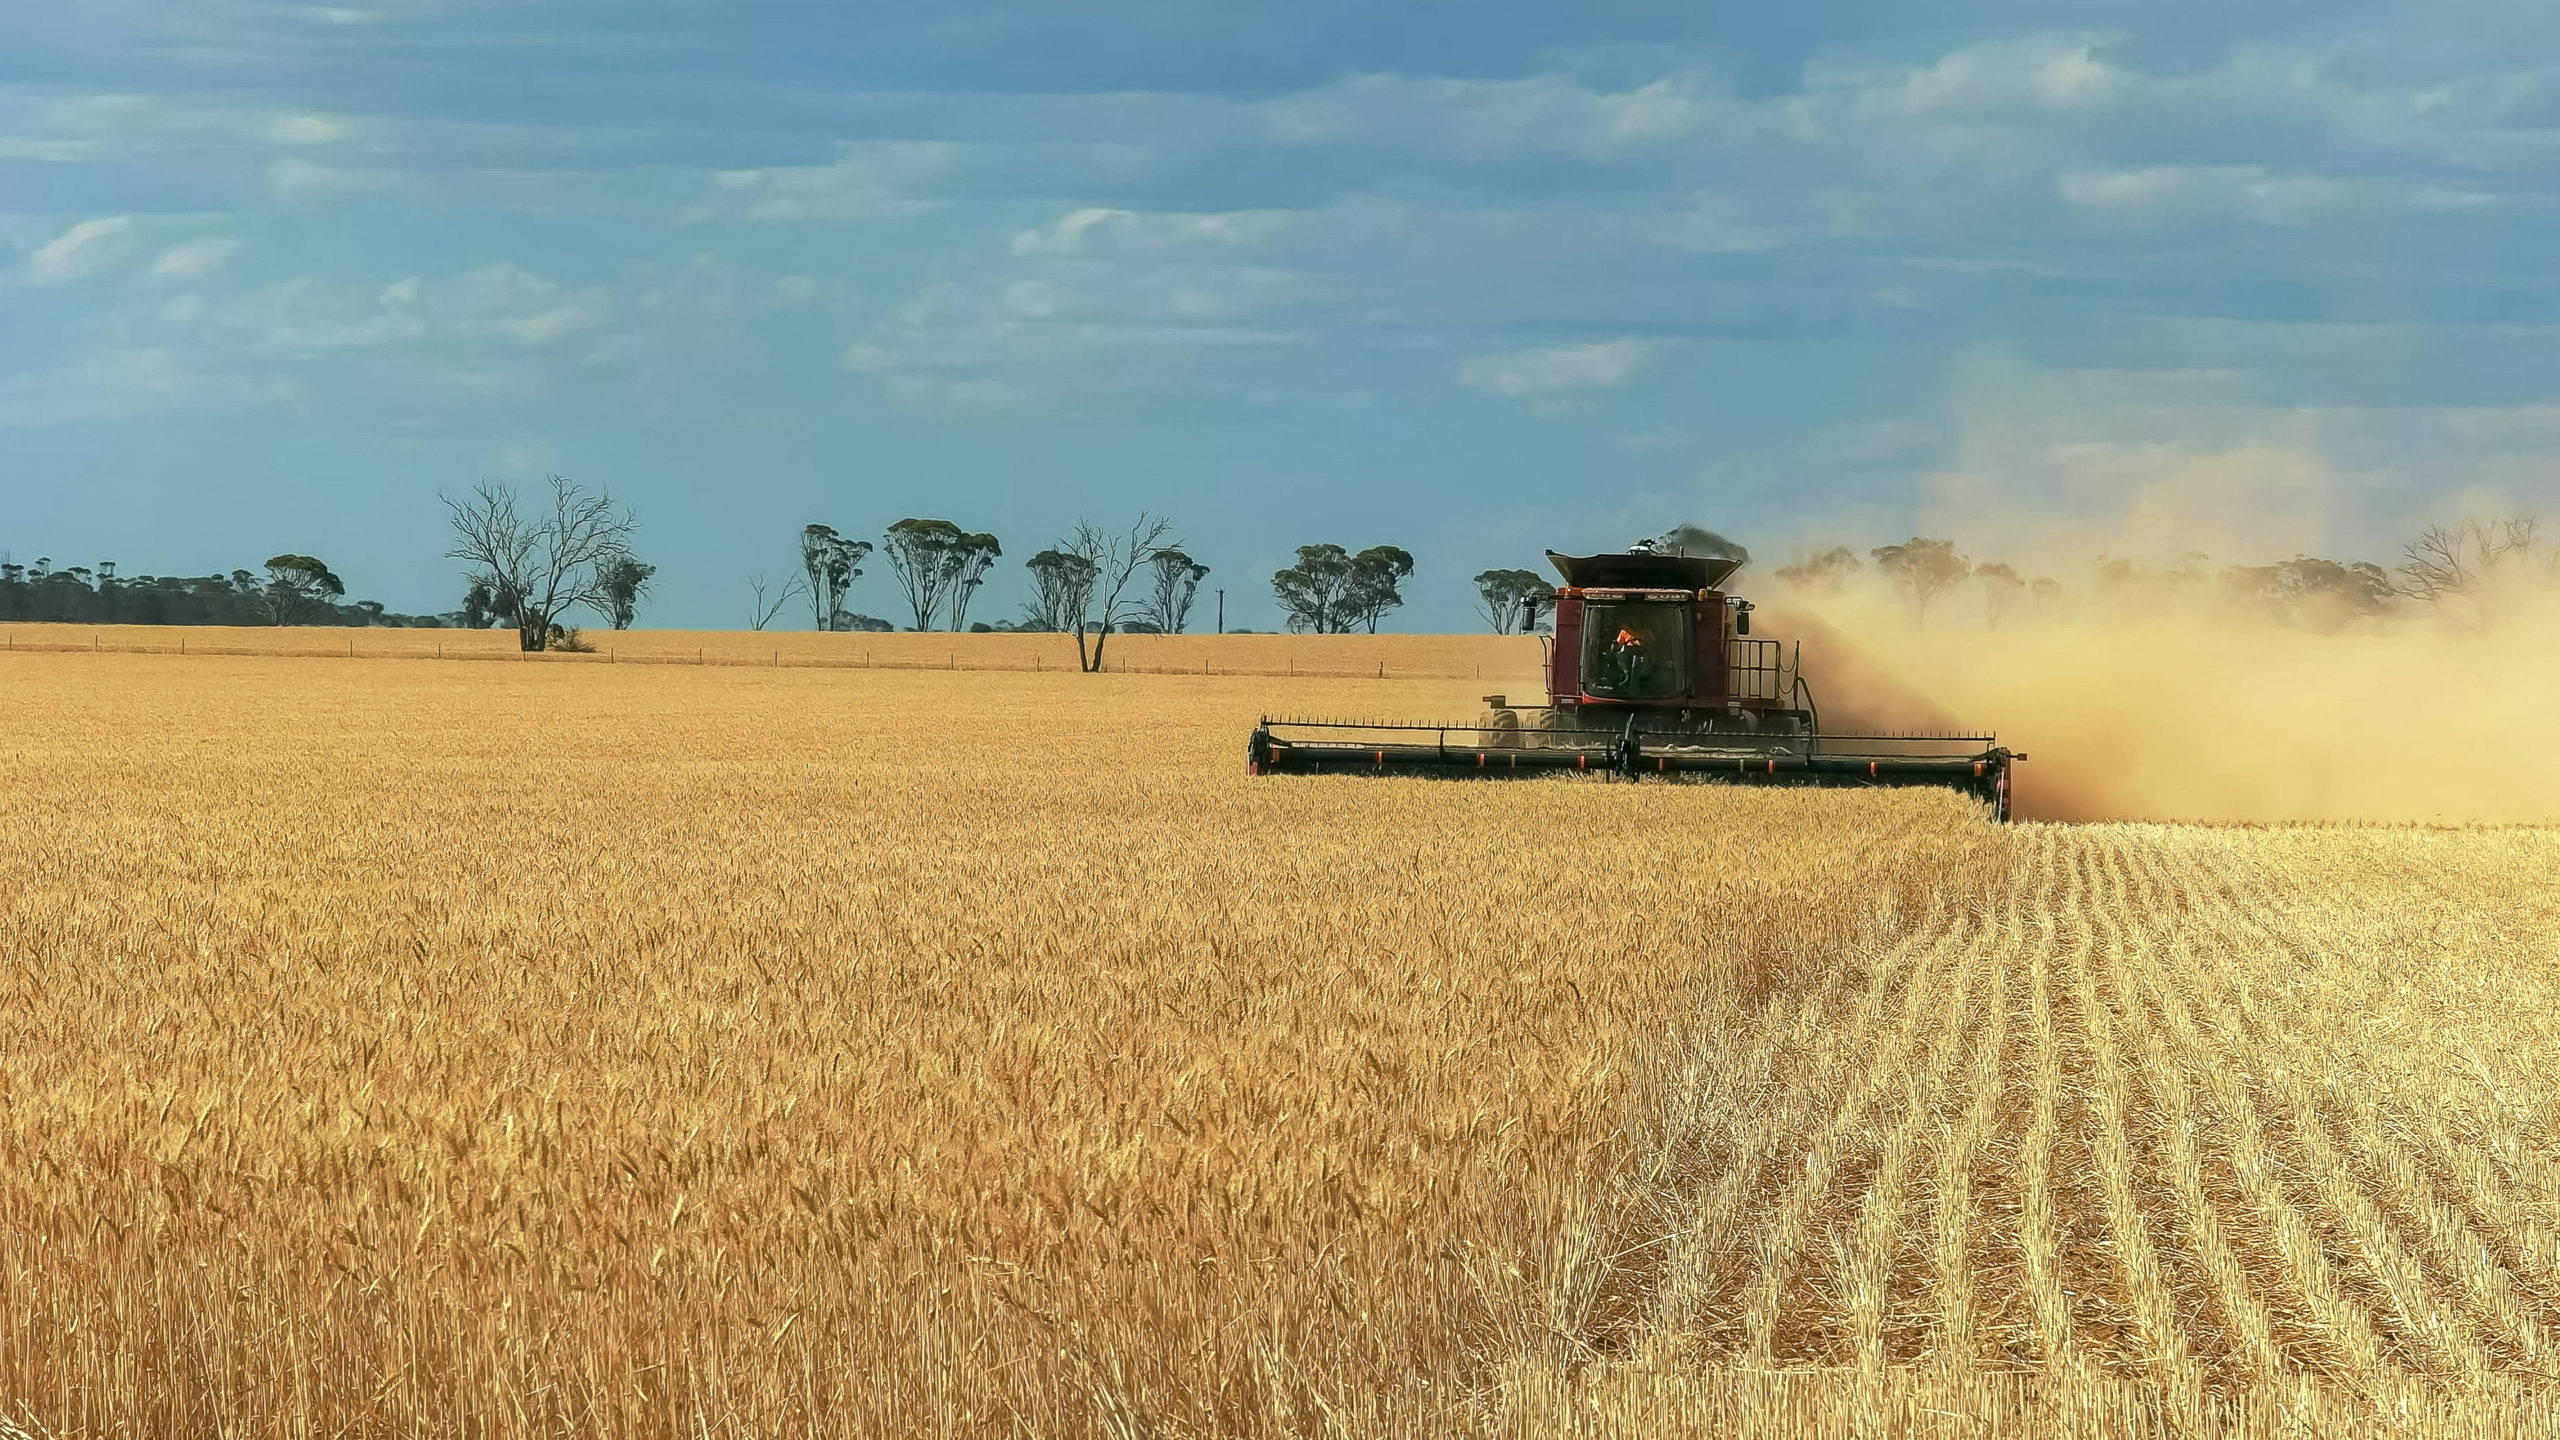
Typically, Kansas would trade at a premium to Chicago wheat. However, the spread has changed to a strong Chicago premium over Kansas during 2018. During September the spreads reached highs of 28% over Kansas, and an average for the month of 22%. The market has since fallen to 15% (figure 1).

Those who followed this spread trade strategy have a return of 13%, not a bad return on investment in the current climate. However, the spread remains at 15% – still well above the long term average of -3%.

As China starts to ramp up purchases as part of their Phase 1 obligations and extra demand for milling wheat due to panic buying – there is still an opportunity for this spread to return to normal levels.

So as a refresher, here are some strategies on how to do this:

What simple trades can we do?

Long Kansas: It is possible to take out a straight futures contract for Kansas. In this scenario, we would purchase the Kansas futures contract for a forward period. In this scenario, we would be buying with the expectation of Kansas futures rising to meet Chicago.

There is however a risk that the Chicago contract could fall to meet Kansas, or worse that Kansas falls further.

Spread trade: If we only want exposure to the spread between the two contracts, we can trade both Chicago and Kanas.

Whilst buying Kansas, we would take an opposing contract by selling Chicago. If this trade was executed, there would be no interest in the underlying price, only the spread between the two contracts.

Here are few hypothetical scenarios of the end results (table 1):

  1. The spread increases: The trade will result in a loss.
  2. The spread returns to normal levels: The trade will result in a profit.
  3. The Spread remains the same: The trade will be neutral.


Remember to listen to the  Commodity Conversation podcast by Mecardo

What does it mean/next week?:

This provides an opportunity to participate in further potential falls in the spread between Kansas and Chicago.

As with all strategies, there are risks involved. It is worthwhile getting advice from your risk management consultant.


The grain must flow

Key Points

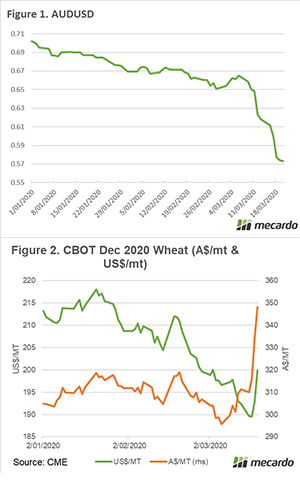
Last week the Australian dollar was the major discussion point. The dollar floated like a lead balloon to lows of 55¢, the lowest level since 2001. This meant that our local pricing and Swaps increased dramatically. As much as last weeks fall was impressive, this week the rise has been equally dramatic.

At the time of writing this, the Australian dollar has increased to 60¢ (figure 1). During any other period, this would be considered an unusually strong move, but in the current environment large swings are to be expected.

In the previous weeks, wheat futures had actually been declining but the A$ was providing most of the benefit to local pricing. In this past week however, we have seen futures start to rise, which has somewhat outweighed the rising A$ (figure 2).

The reason for the rally was two fold. The panic buying seen around the world for staples such as pasta has resulted in an increase in demand from flour mills. This can be seen in the market preference for nearby contracts as opposed to further down the horizon. This has led to the forward curve moving from contango to a flat/backward structure.

The other major reason was anxiety related to the supply chain. There is a concern that a major exporter such as Russia or France, would be impacted by lock downs in the coming weeks.

At present agricultural supply chains remain essential around the world. In addition, Russia is unlikely to want to limit the income received through wheat exports at a time when crude oil receipts have fallen.

Mulling over the risk of a disruption to supply chains, I was thinking about recent times when this was a major concern. We haven’t had any human pandemics (except HIV) in recent decades, but an analogous situation could be the annexation of the Crimea in 2014.

There were concerns that this short conflict between Ukraine and Russia would result in export difficulties, the reality was that the grain still flowed. The question will be whether the market will continue to price in the risk of supply chain disruption.

Fundamentally the world is forecast to produce a large crop during the coming year, albeit with the share of production held by exporters declining. This year is however likely to be one of extreme uncertainty, and a good grain marketing strategy is important.

Remember to listen to the  Commodity Conversation podcast by Mecardo

What does it mean/next week?:

I don’t know what will happen in the next week, but I’d put money down that it will be volatile! At a local level grain prices remain strong.


Feeder Steer Forecasting

Key points


  • An annual average National Heavy Steer price of 335¢/kg lwt during 2020 would suggest forecast National Feeder Steer price of around 385¢/kg lwt, provided grain prices continue to soften toward the 2020/21 harvest.
  • A forecast of 345¢/kg lwt for Heavy Steers in 2021 places the National Feeder Steer forecast nearer to 400¢/kg lwt.
  • The difficulty in forecasting for the 2021 season is the long-term impact of Covid-19 on global beef, global grain prices and the A$.


Article

In a Meat and Livestock Australia (MLA) funded webinar that Mecardo delivered for Holmes and Sackett on restockers last week we were asked a great question on what our national heavy steer forecast means for feeder steer prices for the 2020/21 season. This piece looks at the relationship between heavy steer, feeder steer and feed grain prices and what it can tell us about feeder steer forecast levels for the next few years.

To access a copy of the MLA restocker webinar recording click here.

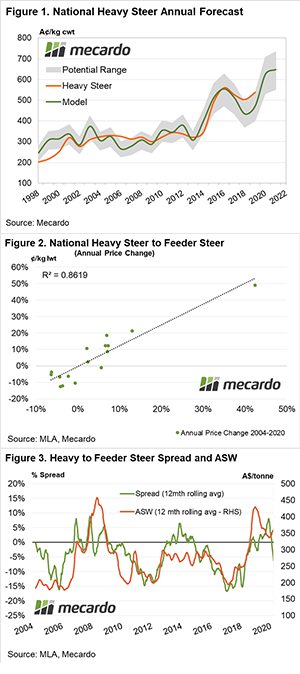
The Mecardo National Heavy Steer (NHS) forecast model is used to predict the annual average price of heavy steers in Australia using predictive inputs to the model such as the A$ level, global beef prices and domestic supply considerations.

The current forecast for 2020 is an annual average of 625¢/kg cwt (approx. 335¢/kg lwt), which is based on an A$ annual average of 67US¢ and an annual average US Live Cattle futures price of 110US¢/lb (Figure 1). At the moment both of these inputs are much lower on the back of Covid-19 speculative selling, with the Aussie dollar under 60US¢ and US Live Cattle below 100US¢/lb.

A comparison of the annual price change for National Heavy Steer and National Feeder Steer shows that there is a very strong correlation between the two (with an r2 of 0.8619) (Figure 2). This demonstrates that we can safely use the Nation Heavy Steer forecast model output to get an idea of the likely price forecast for National Feeder Steers, once we allow for how climatic factors and feed cost influence the historic spread between heavy steer prices and feeder steer prices.

Analysis of the percentage spread of heavy steer to feeder steer compared to the ASW price (smoothed over a 12-month average) highlights that during periods where there is a low feed price environment, the heavy steer moves to a discount of approximately 15% to the feeder steer (Figure 3). 

The big unknown at the moment is the long-term impact of Covid-19 on global beef, global grain prices and the A$. Local grain prices rallied last week despite softer international grain prices due to the collapse in the A$ under 60US¢.

What does it mean?

Assuming an annual average National Heavy Steer price of 335¢/kg lwt during 2020 would suggest an annual average National Feeder Steer price of around 385¢/kg lwt, provided grain prices continue to soften toward the 2020/21 harvest.

For 2021, the Mecardo National Heavy Steer model forecasts an annual average price of 640¢/kg cwt (345¢/kg lwt) but this is based on an A$ of US70¢ and US Live Cattle at 115US¢/lb. If the Covid-19 impact is short-lived and the A$/US Live Cattle futures can rebound from their current levels, there isn’t any reason why we can’t achieve these forecast levels for the heavy steer. 

Furthermore, based on an assumption of cheaper domestic feed prices and a 15% discount of heavy steer to feeder steers into the 2021 season the feeder steer forecast would be nearer to 400¢/kg lwt.


Wheat futures rally to extreme levels (in A$ terms)

Key Points

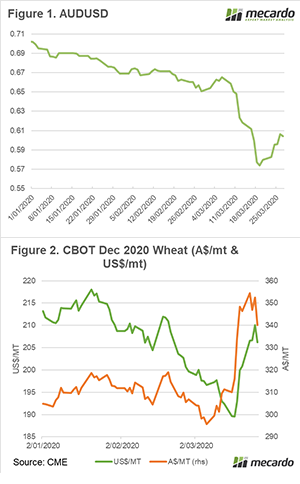
The markets have gone truly bananas. In a good way for growers but not necessarily for consumers. In the past week, Chicago wheat futures have risen to the highest level since 2012 (in A$ terms). This provides a great opportunity for farmers to start their 2021 marketing at extremely strong levels. 
Let’s start where the real excitement is. The A$. Australian agriculture for the most part of export orientated; this means that with a lower dollar the local price can rise dramatically due to buying in Australia from overseas effectively being cheaper. 

The A$ has been feeling the effects of gravity since the start of the COVID19 crisis. At the start of the year, the expectations from most banks was an A$ in the low to mid 70’s. The mother of all black swan events has caused all forecasts to be wildly wrong. In figure 1, we can see the Australian dollar against the greenback, and it has hit levels not seen since 2002.

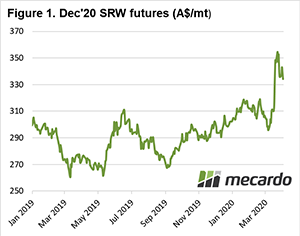
So what about grain? In figure 2, Chicago wheat futures for December are displayed in both US$/mt & A$/mt. The market has rallied substantially in both however the rally in Australia dollar terms has been more pronounced.

This is an opportunity for producers. At present, it is possible to book in a wheat swap for the coming harvest at A$347/mt. This is an extremely attractive number historically and places it at the highest level since 2012. 

We advise that all producers enquire with their banks about the option for using swaps for mitigating risk. It is important to get this facility set up, it doesn’t cost anything. It’s better to have it and not need it than need it and not have it. 

Remember to listen to the  Commodity Conversation podcast by Mecardo

What does it mean/next week?:

The market is crazy with a huge amount of volatility. What is going to happen next week? No-one has a clue. We are in uncharted territory, the US dollar is considered a safe haven which has caused a decline in our currency. 

We might find the US response lacking and see an exodus from the greenback. It’s all speculation at the moment, but in reality agriculture seems quite resilient to these times. 

Oil be damned

May you live in interesting times. A phrase which absolutely applies to 2020. As well as Coronavirus, we are also an ‘oil war’ between OPEC nations. This has resulted in big moves in the oil industry.

The oil market was falling in recent weeks due to demand disruption caused by reduced trade and drastically falling passenger numbers on air travel. However, instead of curtailing supply the major producers have done the opposite!

The Organization of the Petroleum Exporting Countries (OPEC) had planned to reduce output in order to stimulate prices. However, Russia was unwilling to agree to plan. In response, Saudi Arabia threatened to flood the market with oil.

As the worlds largest exporter this represented a huge risk to pricing as with lower extraction costs (US$8.98), they can sustain very low oil prices for extended periods.

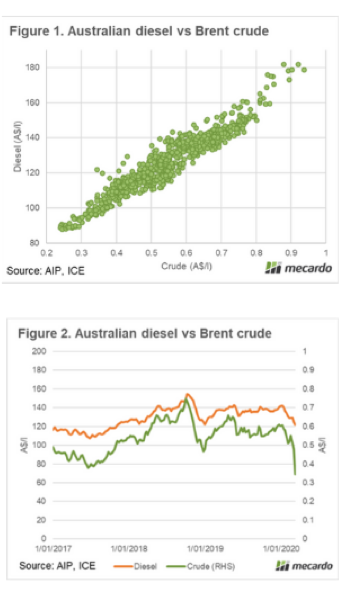
Diesel is derived from crude oil, and any changes to the price of crude will flow to our fuel prices within Australia. When converted to Australian dollars/litre the correlation between crude and local diesel is 0.95, with 0 being no correlation and 1 being a perfect correlation. This can be seen in figure 1.

In figure 2 both crude and oil are displayed in A$/litre. The crude oil price has been creeping down since the start of the coronavirus crisis, however, has seen its largest fall in over a decade in the past week.

Diesel prices have been falling this gradual decline to reach the lowest levels since last January.

What does it mean/next week?:
At a time of low demand for oil, the oil-producing companies have gone against logic and are increasing supply.

Crude oil prices have been absolutely smashed. There is a lag between the fall in crude and diesel prices, however, we would expect that prices will fall further throughout the week if crude remains at current levels.

This is good for my 120km daily commute, but will also be good for those preparing for seeding.


We may run out of toilet rolls, but there will be plenty of cereal.

There has been a run on toilet roll in Australia, however, we will likely have plenty of cereal. In this update, we step away from COVID-19 and look at some of the fundamentals driving the market.
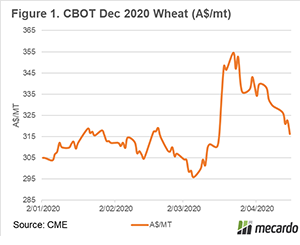
The December 2020 Chicago wheat contract has dropped 6% in the past fortnight (Figure 1). Levels have dropped considerably from A$318 to A$298, although in part have been assisted by a falling A$. If the A$ had remained at the same level as the start of the year the A$ swap would be around A$285.

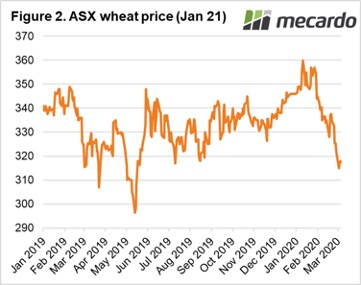
Coming closer to home the ASX January 2021 contract has also experienced dramatic falls. The contract reached its peak in early January at A$360/mt but has since seen a gradual fall to A$317.50.

One of the reasons for the fall in pricing of wheat (and other commodities/equities) has been due to a risk-off appetite. This is where traders reduce their risk by moving to traditionally safe investments, which causes a sell-off. However it is not just this attitude that has caused a downfall in pricing, it is fundamentally driven.

After two years of drought, the east coast is starting (touch wood) to return to more fertile conditions.  This has provided confidence that Australia will produce an average or above average crop in the domestically focused areas. As a result, our basis has declined as buyers don’t have a ‘fear of missing out’.

On a global basis, the same sentiment dominates with global conditions improving. Overnight, the FAO forecast wheat production at 763mmt. If global weather patterns continue to be benign then there is every chance that the world will be awash with cereals.

Remember to listen to the  Commodity Conversation podcast by Mecardo

Next week

Markets will continue to watch the spread of COVID-19. Overnight it was confirmed that coronavirus had impacted staff at a commodity brokerage in London, this could spook the market.

On the data front, USDA will release their WASDE report next week. This will provide further insights into the supply scenario.

EYCI solid, but fat cattle stall on processor concerns

Increased cattle yarding across the eastern seaboard hasn’t slowed demand for young cattle this week but concern over export markets and the prospect of tighter margins appears to be slowing meat works appetite for finished cattle.

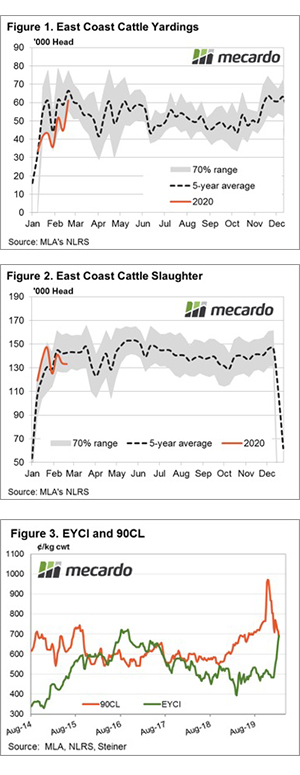
Figure 1 highlights the trend in weekly east coast cattle yarding levels and it shows in the last few weeks we have seen increasing numbers present at the sale yard. Weekly yarding has tipped over 60,000 head but remains under the five-year seasonal pattern – which is understandable given the lower herd this season.

Although, it does highlight demand remains robust and this is particularly true for young cattle with rainfall encouraging restockers into the market. Pushing the Eastern Young Cattle Indicator (EYCI) just short of record highs to close at 718¢/kg cwt, 7 cents short of the all-time peak. In the coming week, Mecardo will take a closer look at the restocker activity so far this season, so keep an eye out for that.

Finished cattle along the east coast has been having a good run of late. However, this week the eastern states’ heavy steer indicator took a pause, easing 3¢ to close at 341.75¢/kg lwt. The weekly trend in east coast cattle slaughter has dipped below the five-year trend in recent weeks highlighting the slowing processor demand in the face of high domestic prices, softening export prices and concerns around the ongoing spread of Covid-19 impacting global growth and weighing on international beef markets – Figure 2.

The 90CL benchmark beef export indicator dropped back under 700¢/kg CIF over the week, pressured by ongoing concerns over Chinese beef demand due to Covid-19 issues and higher NZ imported grinding beef supply into the USA. For the first time since the heady restocking episode of the 2016/17 season, the EYCI moved to a premium to the 90CL – Figure 3.

What does it mean/next week?

It still remains a bit of an unknown how the spread of Covid-19 will play out globally particularly with regard to the impact on beef export demand, but more clarity will be available in the coming weeks as we get access to the February trade figures.

Continued rain across the continent this week, including falls of up to 25mm in western NSW will continue to buoy young cattle prices and interest in breeding stock. There’s a good chance we will see the EYCI hit new all-time highs too. However, to really extend above into the high 700 cent region or even break into $8 territory we will need to see finished cattle prices continue to probe higher too, and this will only come with robust export markets.