Tag: Grain

Corona fears brewing

The market has become increasingly worried about the impact of a potential global pandemic of Covid-19. This has resulted in a risk off attitude to commodities. In this update, we take a look at the CBOT market and ASX.

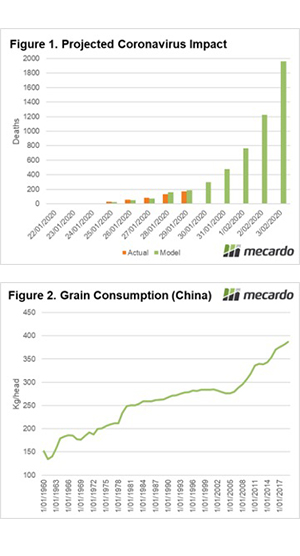
Until recently, Covid-19/Coronavirus was largely limited to China, however this week the number of daily cases outside China exceeded the source nation. This has caused a great deal of consternation relating to the potential impact on global markets.

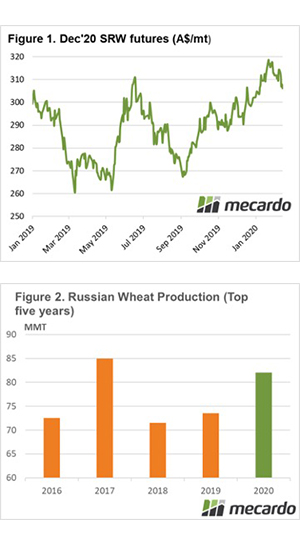
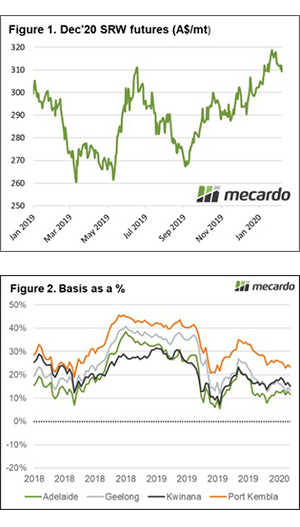
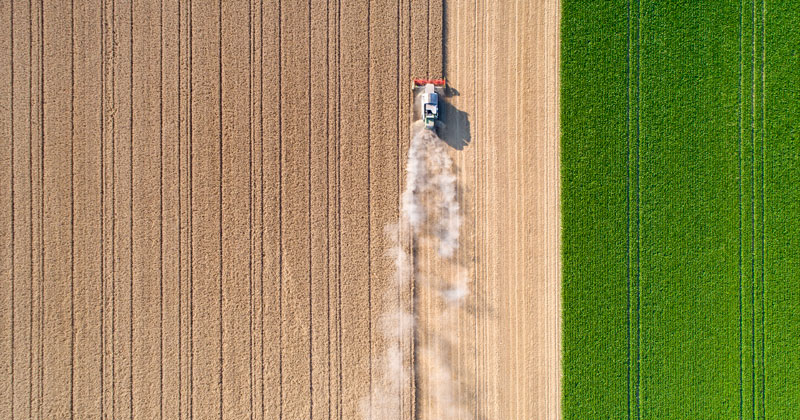
The wheat market has not been spared from the sell off. US wheat futures for December have had a run of red days with the market falling to the lowest level since early December, wiping out all of the recent gains.

However, one factor to take into account is the Australian dollar. The economic impact of Covid-19 has been mostly felt in China, and our economy is highly reliant on the Chinese economy performing well. The concerns related to China have flowed through to bearish sentiment on the Australian dollar.

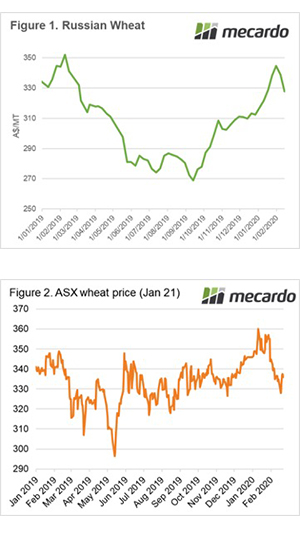
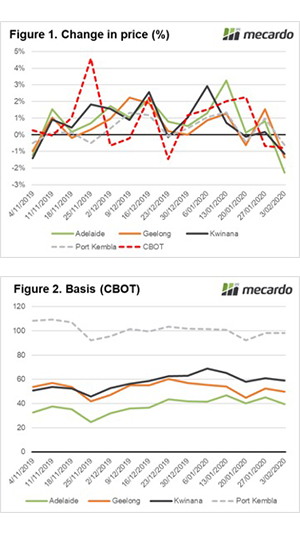
This has meant that when converted into Australian dollars, the fall in Chicago wheat futures has not been quite as severe (Figure 1). This has meant that the wheat futures contract corresponding with our next harvest still offers close to A$310/mt.

At a local level, the rain has continued to fall across large parts of the Australian wheat belt, including WA which had been missing out in recent weeks.

After two years of dire conditions, the wet weather has provided plenty of confidence. Producers are confident that they are set up well, and consumers are confident that they will not be chasing a drought crop to feed their needs.

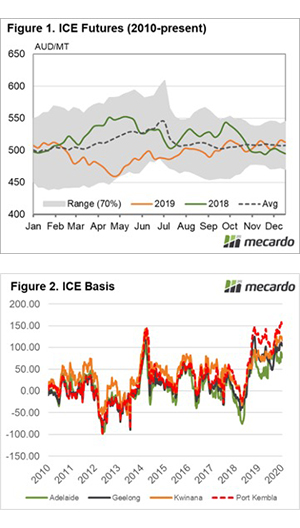
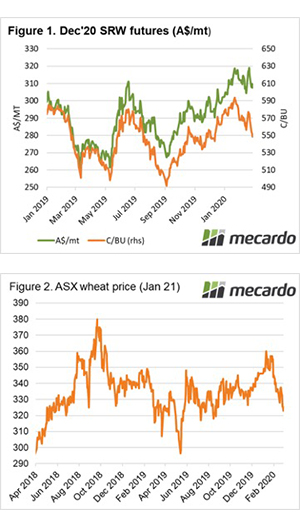
The confidence in this market can be seen clearly in the January 2021 ASX wheat futures, which have seen a fall from December highs of A$360 to trading at A$323 on Thursday afternoon. This places forward basis at pre-drought levels.

Many of our subscribers have started hedging their 2021 crop, but despite the fall in levels, there are still historically attractive pricing levels available.

*report written on Thursday 28 Feb evening and does not reflect overnight moves

Next Week

We are well into black swan territory. The world has not seen such a potentially disastrous disease since the Spanish flu (1918-1919). This means that the market will likely remain very volatile as traders try to interpret the moves.

Cheap Russian wheat & China protects its fertiliser

In this grain market comment, we provide a short summary of Russian wheat pricing, ASX levels and fertiliser/chemical blockages in China.

In yesterday’s analysis article ‘It’s relatively relevant’, we briefly discussed the rapid rise in wheat futures this week. This has had a limited impact upon Australian wheat prices, resulting in basis levels declining. What about our competitor, Russia?

Pricing levels in Russia have been increasing steadily during the last quarter of 2019. There were questions during this time relating to export pace and, in December, around weather concerns. However, once the local analysts started to dig into the potential the market has seen downward pressure. In A$/mt terms Russian pricing has dropped from A$344 to A$327 during February (Figure 1).

The ASX contract for January 2021 traded up throughout the week with the contract rising from A$328 to A$336 (Figure 2). This places the basis between CBOT (Dec) and ASX (Jan) for next harvest at A$19/mt.

The Coronavirus has far-reaching impacts beyond health. The long hiatus of work in the superpower has led to issues related to agricultural inputs, namely chemicals and fertiliser. The Chinese government has mandated that fertiliser (Phosphate) supplies be domestically prioritized at all levels to ensure no impacts on their local spring planting. In relation to chemicals, logistics chains are backed up which could disrupt the supply of agricultural chemicals in the lead up to seeding.

Remember to listen to the  Commodity Conversation podcast by Mecardo

Next week:

It will be interesting to see whether the current rally in US futures will be sustained or whether it is a speculative driven rally. If this is the case, fundamentals tend to return and eventually take control.

EYCI nearing price resistance with supply dearth still to bite

Cattle supply is expected to wane, and prices are already on the rise.  It is still worth having a look at how the tighter cattle supply is likely to play out on a seasonal basis, and what this might mean for prices.

Last week we took a look at Meat & Livestock Australia’s (MLA) Cattle Industry projections on a broad basis, and this week we delve into what this will mean for prices. While the sheep and lamb prices are tightly tied to supply, cattle are a bit more complicated. The global nature of the cattle market means our prices are strongly impacted by supplies from other exporting countries.

As such, we’ve found cattle prices here are a result of export prices and supply.  Figure 1 demonstrates how the level of cattle slaughter governs the discount or premium of the Eastern Young Cattle Indicator (EYCI) to the 90CL Frozen Cow price, exported to the US.

We can see that in 2019, despite strong slaughter, the EYCI discount to the 90CL deviated significantly from the trend line. This was likely a factor of strong export prices and very weak restocker demand from the drought.

So far in 2020, the EYCI discount to the 90CL has narrowed, last week it was at 53¢, with the 90CL at 715¢/kg swt. This week, the discount is likely to narrow further, with the EYCI at 692¢ on Wednesday.

There is no guarantee the volatile export prices will stay at 700¢. Assuming it does, and the EYCI moves to a 20¢ premium, it gives the EYCI another 40-50¢ upside before it gets historically ‘expensive’ relative to export prices.

There will always be seasonality in livestock prices, and variations in supply generally govern how prices range around the average. Figure 2 shows how the MLA forecast slaughter of 7.2 million head will hit the market if five-year seasonality holds.

Cattle slaughter is expected to be over 10% lower than last year in all months.  October to December, which were strong slaughter months in 2019, are expected to take the biggest hit, with 17-20% fewer cattle expected to be slaughtered.

What does this mean?

Cattle prices have rallied so strongly they have nearly made up all the ground we would expect them to, relative to export prices. There could still be a further upside, but once the EYCI moves past export values, price resistance starts to mount.

The seasons have been far from normal recently, but rainfall might signal some sort of return. Once prices level out there could be a return to normal seasonality, with winter peaks and summer declines. The peak EYCI could be as high as 800¢, while the low shouldn’t be much less than current prices, providing the rain keeps coming.

Corona weighing on export prices, but domestic impact limited

Concerns over the Coronavirus spread has softened beef export prices in recent weeks, but tight supply and favourable rainfall has limited the impact on cattle prices at a domestic level. Australian beef exports for January were healthy, but an inability to get Corona under control could see export flows impacted in the coming months.

Just yesterday we saw a surge in reported Coronavirus outbreaks in China due to a change to the way they assessed the infection. Currently, there are 60,000 reported cases according to the Johns Hopkins University live mapping website.

US beef industry consultants Steiner are suggesting that the uncertainty around China’s ability to contain the spread of the Coronavirus is leading to a softening of the 90CL beef export price as Chinese beef demand slows with travel bans in China causing import congestion at Chinese ports. Supply chain bottlenecks in China are seemingly the cause of the 3% easing of the 90CL to close at 723¢/kg CIF.

Thankfully on a domestic level, the impact of Corona on cattle markets has been negligible. Yesterday Mecardo reported that there has been no sign of a negative impact on beef export volumes for January.

Additionally, the tight season expected in cattle markets for 2020 and the favourable rainfall patterns in recent weeks has continued to see cattle prices benefit. The Eastern Young Cattle Indicator (EYCI) gaining 6% this week to close at 662¢/kg cwt and narrowing the gap between it and the 90CL further – Figure 1.

East coast weekly cattle yarding figures have been averaging volumes nearly 20% lower than the five-year trend since the start of the 2020 season, trekking along the lower boundary of what would be considered normal for this time in the year and highlighting the expectation of the tight season ahead – Figure 2.

Next week

With the forecast of 15-50 mm of rainfall along the entire eastern seaboard in the coming week (Figure 3) it is unlikely we will see cattle supply expand any time soon. The continuation of the rain will likely see further restocker interest for store cattle and breeding stock.

Expect the EYCI to continue to probe higher in the short term, even if Coronavirus remains unchecked and export prices soften further, as the domestic situation of low supply and rain is providing good support.

The Russians are coming (again)

With inspiring rainfall dropping on large tracts of the eastern states, confidence is increased in the capability of producing a 2020 crop. If the potential continues to improve then exports will be important. Our biggest export competitor (Russia) is on track to produce a very large crop, which could cause problems.

The futures market has ended the week on a downer, with value in Australian dollars down A$8 since last Thursday. At the same time, the Australian dollar has remained low as a result of economic concerns related to the Coronavirus in China.

The market, however, is still providing attractive levels (historically) for hedging. In my experience dealing with farmers there used to be a psychological sell level of A$300. At present, the December Chicago contract remains above A$305. It is important to note that when using futures, basis has to be included on top. Historically Australian basis has been positive, although in theory could turn negative if we have extremely strong yields.

During December, there were concerns that the black sea region was in strife. This is a story that we’ve heard year after year and my thoughts were that it was too early to write off our competitors. In the past week, new forecasts for Russian production have been released, with a consensus from a number of organizations showing 82mmt.

Figure 2 puts an 82mmt crop in perspective, showing the top 5 productive seasons since the fall of the Soviet Union. An 82mmt crop would be the 2nd largest, narrowly behind the monster 2017 season.

Interestingly, the top five production years have all been in the last five years. It is inevitable that Russia will have a hiccup at some point in time, and when it does, the markets will see substantial rises due to the importance of Russia as an exporter.

It is still worthwhile to note that a lot can happen between now and the Russian harvest, so any forecasts of the crop will need to be taken with a grain of salt. They do however have the potential for a very large crop.

If Australian crop conditions continue to improve then exports will increase back to normal levels, a large Russian crop will be competing with us.

Next week

The east coast of Australia is forecast to receive additional rain over the next week. If this eventuates, confidence in the crop will be much improved.

The west coast, however, has limited rainfall on the forecast, and could really do with an increase in soil moisture.

Rain on the plain sees cattle price gain

Cattle markets have been waiting for a rain event, and it keeps coming.  Average January rainfall has been followed by more rain in Queensland this week, and more is forecast for the east coast this week.  If the drought hasn’t broken, price action suggests it is not far away.

The Eastern Young Cattle Indicator (EYCI) this week tore through 600¢ and finished Thursday at 623¢/kg cwt.  Restockers continued to drive values higher, averaging over 350¢ for steers in NSW and Queensland.  Feeders joined in this week, paying over 340¢/kg lwt for steers, 21¢ higher for the National Indicator.

Figure 1 shows the EYCI hasn’t been this strong since mid-2017, and it hasn’t seen a better than 100¢ increase in a month ever, as far as we can tell.

While Trade Cattle remained stubbornly steady at 300¢, Heavy Steer and Cows joined in the rally, the National Indicators sitting at 319 and 258¢ respectively this week.

Over the Hooks prices have also started to move, on average they were up 20¢ cwt at the start of the week and given they are still behind saleyard values, they might have to lift a bit further to get many bookings.

Export prices have continued to yo-yo this week, with the 90CL Frozen Cow Indicator easing 25¢ back to 744¢/kg swt. The price still leaves room for cattle prices to rise (figure 2), but the rally might start to slow.  That’s not to say it will stop, with 700¢ for the EYCI a realistic target.

Next Week

Meat and Livestock Australia’s cattle industry projections were released this week, so next, we’ll be looking at some long term forecasts.  Needless to say, things look very positive for cattle prices, with cheaper feed finally on its away and restocking on the minds of many in NSW and Queensland.

Are we independent?

Is the Australian grain industry a lone continent removed from the vagaries of overseas pricing? Are we independent of the rest of the world? In this article, we take a look over the past few months to see the driver of pricing.

Derivatives play an important part in pricing grain, even if you do not use them to manage your risk – the derivatives market will impact the price that you receive. In recent weeks we have heard from many that futures aren’t important because our pricing is disconnected from the rest of the world.

In figure 1 the change in price (as a %) is shown for four ports in Australia and the CBOT price. As we can see the price movements onshore and offshore are following one another quite closely.

These ports show a strong correlation between CBOT (in A$/mt) and the local port price. The correlation since the start of harvest is shown below, with 0 being no correlation and 1 being a perfect correlation.

  • Adelaide 0.95
  • Geelong 0.91
  • Kwinana 0.95
  • Port Kembla 0.91

The basis levels in Australia have traded within quite a narrow range since the Christmas break. The pricing levels in Australia have moved higher through January and with a relatively unchanged basis, we could argue that much of that has come from the rise in futures.

What does it mean/next week?:

The correlation between overseas futures, in this case, Chicago, are strong. This means that if prices move in CBOT, then the local price will likely follow.

The importance of futures cannot be stressed enough therefore it is worthwhile including them in your risk management strategy.

Bunch of pluviophiles

The rain has fallen dramatically over the past week providing much-needed rainfall to large swathes of New South Wales and Queensland. This will provide some positivity to many after suffering through 2 or more years of drought.

CBOT December wheat futures have declined rapidly from their recent (and contract high) of A$318/mt on the 21st of January. At present, the December contract is trading at A$309/mt (figure 1). The contract price in A$ terms has been protected somewhat by a declining A$, however, even with a close to A$10 fall, it remains at strong levels compared to recent years.

At present, the futures price offers producers a favourable starting point for marketing next years crop.

Tentatively we can say that the drought has broken in many parts of the eastern states. After receiving scant rain over the past 2 (or more) years, the past month has provided saturating drenches.

These rainfall events start to provide some confidence of the coming crop and some surety of producing something. Albeit we need to remain level headed as we have seen promising rains in the past with no follow-up.

It’s important to remember that basis levels which have been extremely strong in recent times will cause our ‘premium’ over overseas values to decline. This may be experienced with increased vigour in relation to new crop pricing.

In figure 2, the basis level as a percentage of the overall physical price in Australia. In recent months the overall importance of basis has diminished. As a percentage of the overall price received in Australia, the basis is actually now close to the historical long term average.

What does it mean/next week?:

Next Tuesday the WASDE report will be released by the USDA. The USDA has commented ahead of the report that the Phase 1 trade deal details will not be included as part of this report.

The phase 1 deal was always going to be a tough target for China to achieve. The team of analysts at Mecardo do not believe that China will be able to meet this target, especially in light of continuing economic concerns related to coronavirus.

Coronavirus – impact on grain?

Coronavirus is spreading around the world at a rate of knots. In the last week, we have been asked about the potential impact on demand for agricultural commodities due to this illness. In this report we look at the question – is coronavirus impacting on demand?

The Coronavirus has spread from Wuhan, China to 18 countries in a very short period of time. This has caused a great deal of consternation around the globe as countries enact quarantine protocols. Does this impact on markets?

I thought it was useful to give a few pieces of disease trivia:

  • Spanish flu (1918-1920) is estimated to have killed up to 100m people or approximately 5% of the population.
  • The black death killed up to 60% of the population of Europe, and it took 200 years to recover the population to pre-outbreak levels.
  • SARS (2002-2003) infected 8098 people with 774 deaths.

As the number of disease cases increases the number of deaths follows. The daily increase in cases has averaged 60% since the outbreak started.

The mortality rate from coronavirus has averaged 2.6%. To put this in perspective 2019 was considered an exceptional influenza season, and the mortality rate was 0.19%.

In figure 1, we have modelled the potential death toll from Coronavirus using an infection rate of 60% per day and a mortality of 2.6%*. This chart shows the actual and the modelled death toll. The model when back tested has closely matched the data originating from China.

If the outbreak continues to follow the trend, then 2000 people will have died by early next week.

In recent days there has been lots of talk about reduced demand due to this outbreak. In figure 2, the grain consumption per capita for China since 1960 is displayed. In this decade the average consumption within the nation (all uses) has averaged 354kg/hd, which is above the global average of 335kg/hd.

At this level, if 10m people were to perish due to coronavirus, demand would drop by 3.9mmt. Global trade flows are more likely to impacted by supply issues, as an example the average production of grain (wheat, barley & sorghum) in Australia this decade was 34mmt, last year we produced 24mmt.

*As the outbreak progresses we are likely to see infection rates and mortality dropping.

Remember to listen to the  Commodity Conversation podcast by Mecardo

What does it mean/next week?:

The real drive down in price is most likely due to a risk off attitude, in conjunction with concerns related to the overall economic situation in China.

The real fundamental demand hasn’t at present changed. If we get to the level where deaths cause demand disruption, we will likely have more pressing concerns than the grain price.

Are you on ICE?

The canola market has seen a surge in pricing levels since harvest commence. This has been beneficial to producers who generally wait until harvest before selling their canola. In this update, we take a look at the basis between ICE canola futures and local pricing.

There are two main canola futures contracts ICE (Canadian canola) and Matif (French rapeseed), in this update we will be taking a look at the basis between ICE and Australian pricing levels.

Canada is an important canola producer, with the country producing on average 28% of the world’s canola crop over the past five years. Most of the canola grown in Canada is genetically modified, whereas the majority of the Australian canola crop is non-gm.

In a typical year Australia will export the majority of the Canola produced, which aligns itself well with the logic behind using ICE futures as Canada follows a similar trade flow.

In figure 1, the seasonality is shown for ICE futures (converted in A$/MT). In these seasonality charts, rather than use a min/max for the seasonality banding (green shaded area), we use a 70% range (or 1 standard deviation). The 70% banding is used to remove the extremes in the marketplace, which we believe gives a better indication of the seasonality, as opposed to a min/max which can be extremely volatile. In these charts, we also overlay the average for the timeframe and the recent seasons.

During mid-year of 2019 ICE canola futures traded at the bottom end of the range, however, they have drifted higher throughout the year albeit are only now trading at the average for the past decade. If we follow the seasonality, we tend to see the largest rises in the middle of the year. This corresponds with the northern hemisphere weather risk period, and a similar pattern is evident in wheat.

In figure 2, the basis between ICE and local canola prices is displayed. As we can see the local price has increased versus the rest of the world to record levels (Port Kembla). At present basis, levels are extremely strong. The strength in basis levels is due to scarcity of supply, and we shouldn’t expect to see these levels repeated in 2020/21 unless we see further supply shocks locally.

Remember to listen to the  Commodity Conversation podcast by Mecardo

What does it mean/next week?:

The Australian market is currently trading at very strong premiums to Canadian canola futures. It is highly probable that these basis levels will decline next harvest (if we have an average crop).

At present, I recommend using physical sales of canola, whilst the market remains strong.