 The US Climate Prediction Centre, is currently on La Niña watch with an increased likelihood of the little sister to El Niño occurring before the end of the year, and into 2018. This can have very positive results for Australian grain growers, in this analysis we look at how we may benefit.
According to the BOM, ‘El Niño’s often lead to drier conditions over large parts of Australia, while La Niña’s tend to enhance rainfall over much of the continent’. However, it must be noted that not every drought is associated with El Niño nor every wet year with La Niña.
A visualisation of the impact can be viewed here.
In this analysis we have examined the El Niño and La Niña events which have been considered moderate to strong from 1960 to 2015 in order to determine what impact these events have on grain crops by analysing the year on year change in wheat production.
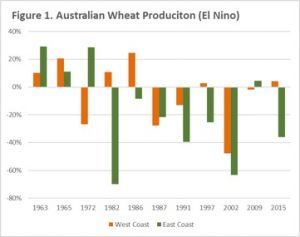
 In figure 1, we see the year-on-year impact of El Niño split into east coast and west coast. In the period 1960-2015, 7 of 11 El Niño years have recorded a reduction in wheat production, with 6 of these years recording a > 20% reduction. In Western Australia the impact of El Niño has been less negative, with 6 out 11 event years recording an increase. However, only two of these years record > 20% increase. In addition, during the years of production decline, 3 of these years recorded large production falls of > 20%.
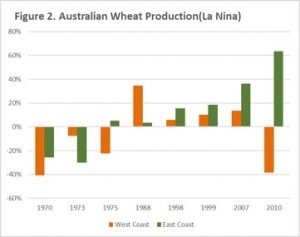
The year-on-year impact of La Niña is displayed on both the east and west coasts as highlighted in figure 2. In the period 1960-2015, there have been 8 La Niña events. The east coast during these La Niña events experienced 6 years where production has been higher, with 4 being >15% and 2 events where production reduced by >20%. The impact of La Niña in WA has caused 4 out of 8 years to have a production contraction, with 3 of those years having a >20% decline. The La Niña years with an increase in production in WA have resulted in smaller increases than the east coast with the exception of 1988.
In both figure 1 & 2, it is evident that since the mid 1980’s in Australia El Niño events have overall been negative for crop production and La Niña events have been positive, with the exception of 2010 in WA.
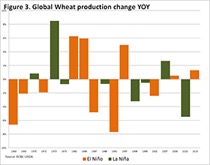
In figure 3, the year-on-year impact of La Niña & El Niño is detailed at a global level. During an El Niño year we can determine that production was reduced in 6 years out of 11, and increased in 5 years with no changes of more than 10% on a global level. During La Niña years, global production has increased in 3 out of 8 years, whilst production has decreased in 5 years.
 At present, the market is not yet overly concerned with La Niña. However, it does have the potential to impact greatly on the US crop through drier weather and eastern Australia through wetter than average conditions. If La Niña starts to impact on the US crop production, then we are likely to see risk premiums emerge in US futures markets, which will flow on to our own prices.
Key points:
- El Niño events tend to have a larger negative impact on east coast Australian production, with 6 out of 11 moderate to strong El Niño years recording >20% decrease.
- La Niña events tend to result in increased production on the east coast, especially in events since the mid 1970’s which may be due to more efficient water use.
- La Niña years in Western Australia tend to be more subdued with lower production gains, and a higher chance of reduced production.
What does this mean?
The market is looking for information to provide direction. The anxiety resulting from the potential for a La Niña can result in the formation of a risk premium in Chicago futures, as buyers seek to reduce risk from US related supply issues.
Australian growers would therefore benefit from a rise in futures prices.
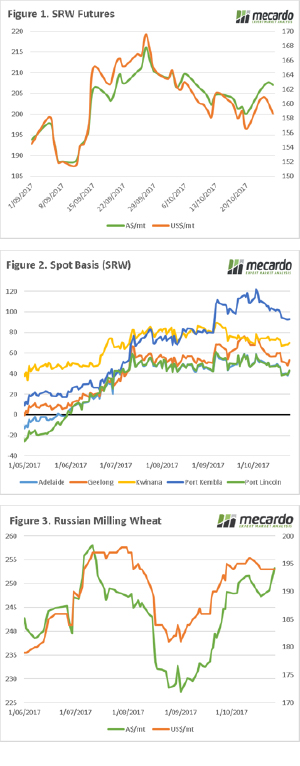 The market continues to follow a similar pattern to recent weeks. In this week’s comment, we look at futures & basis levels. In addition, we look at where our main competitor (Russia) is pricing its wheat.

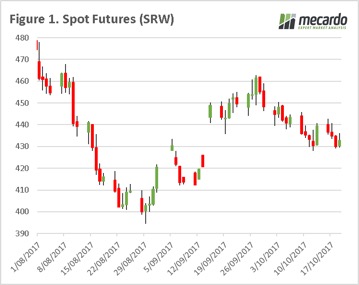 The futures markets are largely quiet, as the northern hemisphere is largely complete for 2017 and seeding progresses for next year. At a local level, it is important to start considering local premiums and how to take advantage of them.
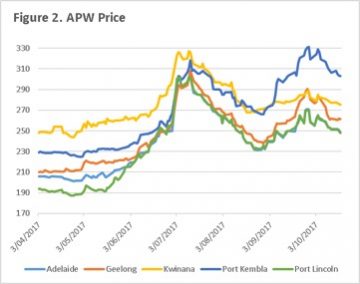 At a local level, harvest has begun in the north and it won’t be long until the bulk of farms around the country will be ‘reaping what they have sown’. During October, rainfall has been strong through much of northern NSW and QLD, although not adding much in the way of benefits to the winter crop has added confidence in the summer crop. This has resulted in consumers reducing some of their buying appetite, as they reassess the situation for the coming 6 months.
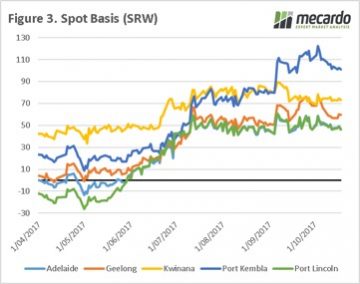 At present there are considerable premiums available for growers. As growers start to sell the crop, the logic would be for basis to fall.
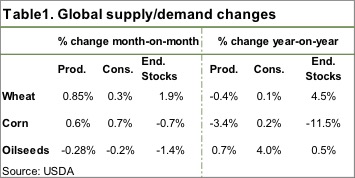 The Australian Bureau of Agricultural Resource Economics and Sciences (ABARES) made an interesting move this week, warning of crop downgrades. Meanwhile the United States Department of Agriculture (USDA) made their monthly predictions.
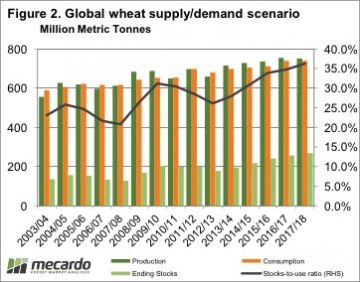 Global wheat production was lifted 5.3mmt thanks to improving production in the EU and India. The USDA did downgrade the Australian crop by 1mmt to 21.5mmt. Figure 2 shows we are still well and truly on track for a record carryout for 17/18.

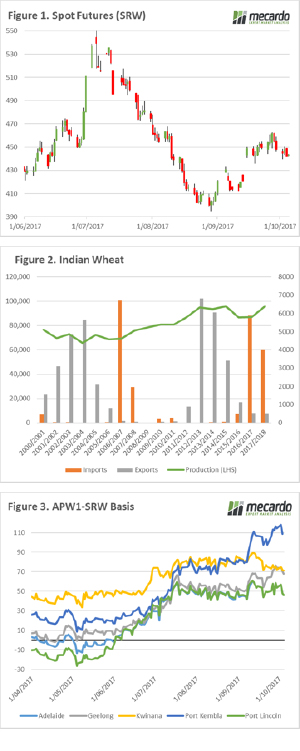 Futures markets edged lower this week, but were balanced by a fall in the Aussie dollar. In this week’s comment, we look at rumours of increased import duties in India, and local premiums over Chicago futures.
 The US Climate Prediction Centre, is currently on La Niña watch with an increased likelihood of the little sister to El Niño occurring before the end of the year, and into 2018. This can have very positive results for Australian grain growers, in this analysis we look at how we may benefit.
  In figure 1, we see the year-on-year impact of El Niño split into east coast and west coast. In the period 1960-2015, 7 of 11 El Niño years have recorded a reduction in wheat production, with 6 of these years recording a > 20% reduction. In Western Australia the impact of El Niño has been less negative, with 6 out 11 event years recording an increase. However, only two of these years record > 20% increase. In addition, during the years of production decline, 3 of these years recorded large production falls of > 20%.
 At present, the market is not yet overly concerned with La Niña. However, it does have the potential to impact greatly on the US crop through drier weather and eastern Australia through wetter than average conditions. If La Niña starts to impact on the US crop production, then we are likely to see risk premiums emerge in US futures markets, which will flow on to our own prices.
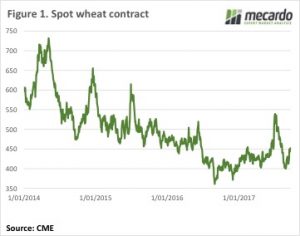 Local and international wheat markets continued to edge higher this week. Local markets are still trying to get a grip on where the crop will end up, as it shrinks by the day. The international market remains awash with wheat, but a rising rouble gave unlikely support.
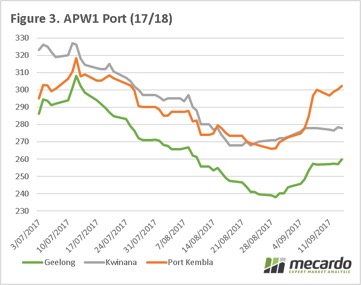
 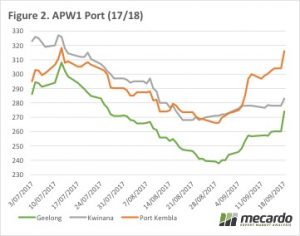 Locally the dry spell in NSW continues to run down the potential crop, with prices responding accordingly. ASX East Coast wheat, which we must remember is now deliverable in Victoria, was quoted at $283/t yesterday, up around $10 for the week. Interestingly Geelong continued to lag a bit, although it was up around $14 for the week to $274/t (figure 2).
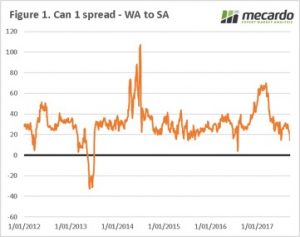
 Canola values are also at a premium in the northern cropping zones, but not as much as you would think. Newcastle Canola is priced around $550, with Geelong just $15 behind, at $535/t. It’s hard to see much canola being produced in NSW, but there might have been enough carry over from last year to satisfy local crushers.
 On Thursday, I will be presenting to the Crop Science Society of South Australia on the topic of GM crops, and the markets associated with them. I thought this was therefore an opportune time to look at the GM moratorium, and whether the promised premiums are available.
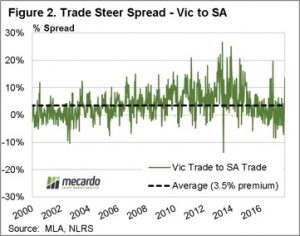 The South Australian government may point to a knock-on effect where other commodities are receiving a boost. In that case, we thought it was worthwhile checking how strong the premium for cattle and lamb had been due to being from a GM free state.
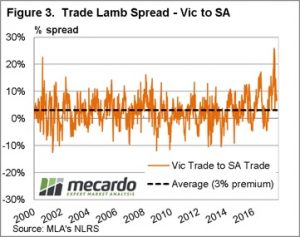 The South Australian ban on GM cultivation is providing little if no extra premium to prices of livestock and canola. There may be premiums in other sectors such as the seafood and wine industry, however this is of little comfort to canola producers.
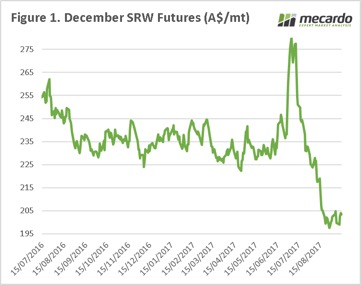 The Australian east coast crop is a tale of two continents, with the bulk of NSW and QLD in a poor state, and Victoria/ East SA developing. The market is well and truly capturing the status of the crop, and the domestic market is pricing accordingly. This creates an issue of premiums being available (half full), but being unable to take advantage of them (half empty).
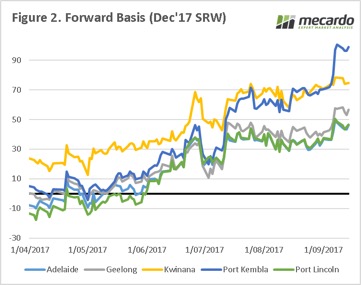 If a grower in Port Kembla had taken out a swap during the height of the July rally, then their overall price today would be >$370, which shows the value in strategic marketing using derivatives.
 In the next week will we see the speculators continue to view the market as bearish, or will we start to see additional profit taking?
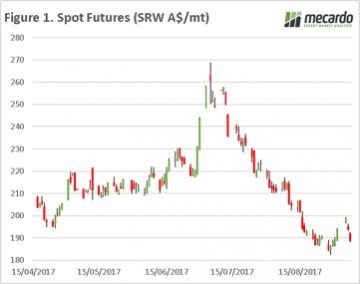 The US were busy celebrating labor day on Monday, well at least those not bracing for (or recovering from) Hurricanes. The market had a strong recovery prior to the holiday, with short sellers taking profits after a continuous decline over the past month (figure 1), however over the past two sessions the market has lost around half of these gains. The market was not helped by the Food and Agriculture Organisation raising its expectations for the global cereals crop to 2.6bmt, which would be the highest on record.
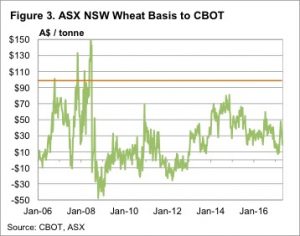
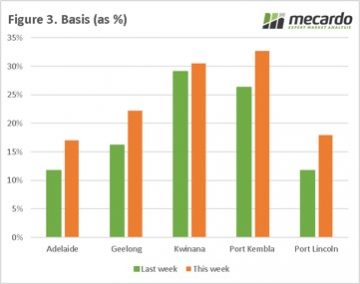
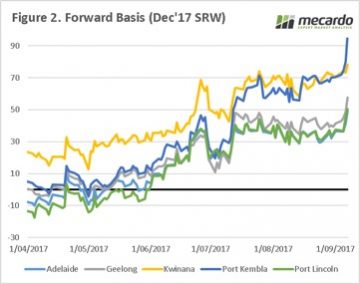 In figure 3, the basis levels as a percentage of the overall price are plotted. As we can see, there have been considerable rises in all zones. The rise was far more sedate in Kwinana, which has for the past 8 weeks maintained at strong levels, and the bulk of issues in the WA crop have been priced in. The basis levels as a percentage of the price in Kwinana and Port Kembla are now at historically high levels.
 The key will be the USDA report, will there be any surprises? The recent upgrades to the Russian crop will likely give a bearish edge to the report.
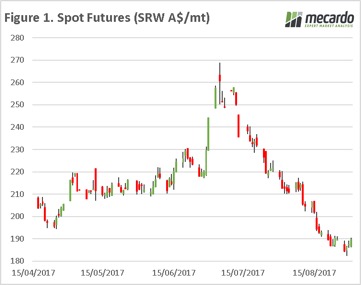 In nautical terms, ‘Dead Calm’ is completely still sea, with the absence of wind or waves. The grain market could be considered to be in a period of dead calm, with the market waiting for some wind or waves in the form of substantial new data to blow us either way.
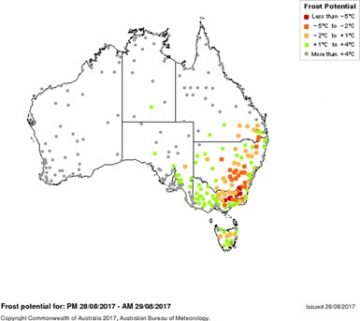 In contrast, Victoria seems to be the jewel in the crown and after having covered part of the state in recent days the crop looks to be in almost perfect condition, appearing to be on track for well above average yields.
 In two weeks, we will have the September WASDE report released, along with the ABARES report. The question will be whether the trade has priced in any downgrade, or whether any likely downgrades will cause a stir.