Tag: Grain

Rain pressures ASX basis

Have you heard the one about the rain on the US Plains? Thought so. It might seem like déjà vu but the story remains the same, with a few twists thrown in this week.
More rain is falling or is forecast to fall across US cropping areas. Northern areas are being most affected, with soft red winter wheat quality now coming into question.  This concern, along with further rises in corn, managed to push CBOT back to recent highs last night.

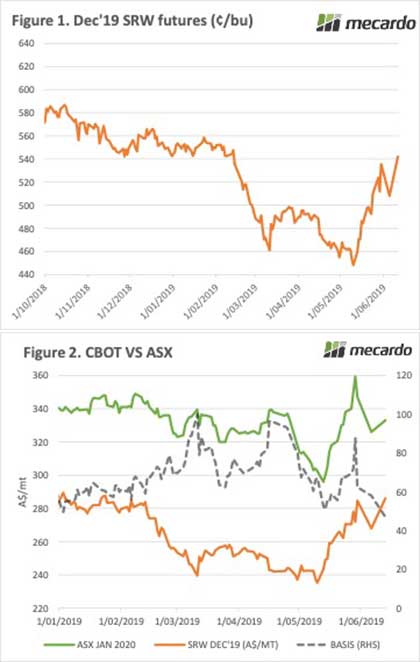
Figure 1 shows the bounce CBOT experienced in US terms, just making a new three month high.  With the Aussie dollar relatively steady for the week, CBOT is also back to a three month high in our terms, at $287/t.

Jan-20 ASX Wheat traded at $333/t yesterday, with the rain across the cropping areas of SA and Victoria helping depress basis.  ASX basis is now down back under $50 per tonne (Figure 2) as the southern cereal crop now has enough moisture for the next month.  There is a long way to go though.

ASX Feed Barley traded at $278.50/t, and is now at a $55 discount to the wheat contract.  Barley rarely gets to such a discount, and this suggests it might be good buying for consumers.  World feed prices have been on the rise, with CBOT Corn now at $250/t in our terms, so further downside might be limited.

What does it mean/next week?:

It is now just NSW which needs the rain in a hurry. There is little prospect for the next 8 days, so we’ll have to wait a bit longer. Internationally the heavy supplies of wheat are being offset by tighter supplies of corn.  There could be further issues for corn, with the target for many the magic $300/t wheat swap, within reach.

Wheat price reality check

The three week rally in Chicago wheat futures came to an abrupt halt this week. Despite little relief in terms of the weather in the US, the market turned around and took our new crop prices with it.

The market seemed to realise that even with rain impacting spring plantings in the US, there is still going to be plenty of wheat in the US this year. This, along with a little relief for Russia in the way of rain had CBOT wheat posting a 34¢ fall for the week.

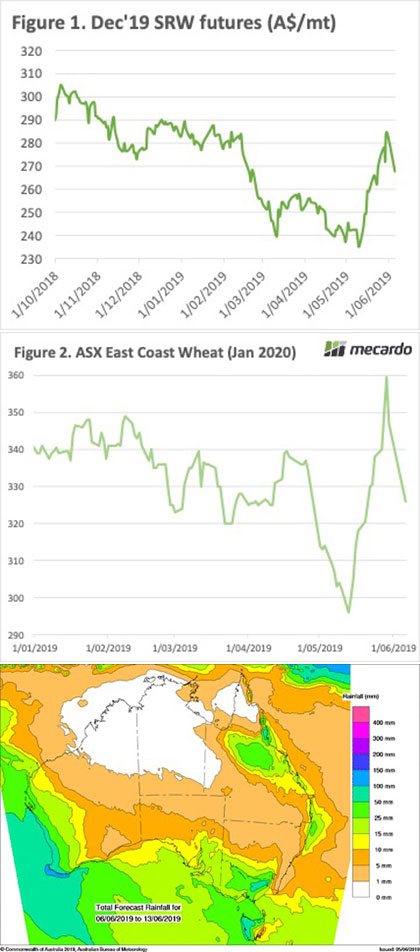
In our terms CBOT has fallen from close to $285/t on Friday, to sit at $268/t last night (Figure 1).  This takes CBOT from sellable, with it representing a local port price over $300/t with a little basis, to a price which is neither here nor there.

ASX Jan-20 wheat has been all over the place. Figure 2 shows it peaking at $360/t last week, with sellers coming out this week and pushing it back down to $326 at yesterday’s close. While ASX has moved with CBOT, basis has still ranged from $75 at the peak, back to $60 yesterday.

The good rains forecast for cropping areas of Victoria, SA, WA and the Riverina (Figure 3) might be encouraging sellers. Maybe not growers, but speculators and the trade might be getting in on the selling.

Old crop bids have largely held their ground, despite the falls in new crop prices. Any grain which is yet to be sold is likely to be held now for the new financial year, and there seems to be no urgency from buyers.

Next week?:

With new crop ASX basis now back at the comfortable level, we’ll be back to following what is happening overseas. There is plenty of uncertainty there, with Swine Fever’s impact on demand being offset by potential lower supplies of corn in the US.


Canola finding some upside

  • Soybean prices hit 12 year lows earlier in the month but have recovered some ground.
  • Canola and Rapeseed futures have also rallied, taking new crop Australian prices higher.
  • Current new crop prices look like good selling with plenty of uncertainty in Canola markets.

International oilseed markets have been in the doldrums, with heavy supplies and weakening demand seeing prices hit a 12 year low. There are suggestions that the soybean market might have found a base, with local canola prices to benefit.

The United States Department of Agriculture’s (USDA) production forecast for 2019-20 is a new record. Despite an increase in consumption, ending stocks are expected to increase marginally.

The increase in stocks, along with concerns around the demand from China given trade wars and African Swine Fever, drove soybeans to new lows. In fact, it was only two weeks ago that soybeans hit a 12 year low of 780¢/bu (Figure 1).

In the last two weeks, soybean prices have rebounded, gaining 8%. The wet weather afflicting the spring cropping areas of the US was initially expected to be positive for soybean production. Later planting is better for soybeans than corn. With the wet continuing, support has started to come for soybeans, although it is way behind corn, which hit a one year high yesterday.

Adding to momentum in oilseeds is dry weather in Canada, which is helping ICE Canola move higher.  It has gained $21 in the last fortnight in our terms, moving higher from doldrums, induced by weak soybeans and China’s ban on Canadian Canola.

Our canola values have been held above $500 by strong European Rapeseed values. Figure 2 shows Matif Rapeseed prices are almost back to $600/t and this is having more of an impact on new crop prices than old.

Old crop canola values have found a little strength this week, gaining $10 to hit $560-565/t in southern ports. New crop Canola is $15 above old crop, and importantly, at a $30 discount to Matif.  The Australian discount to Matif generally doesn’t get any narrower unless we have a very small crop, like last year.

Canada’s issues with China see our Canola at an even stronger basis to ICE than last harvest. Australia’s strong basis is likely being helped by demand which has shifted from China, with few other major Canola producers to fill the hole.

What does it mean?:

By most measures, new crop canola prices look pretty good. Obviously, another drought affected crop could see canola rise further before harvest, as basis to Matif rose to $50 last October. There is some downside risk if China changes their view on Canadian imports, and if we get a big local crop.

With political issues clouding normal pricing relationships, it’s even harder than normal to forecast prices, but there is some merit in looking at prices which are at the top of the historical range.

What a difference a month made

What a difference a month made, seven hundred and thirty little hours. The market has turned 180° since this time last month. In this week’s comment, we take a look at what has caused this move.

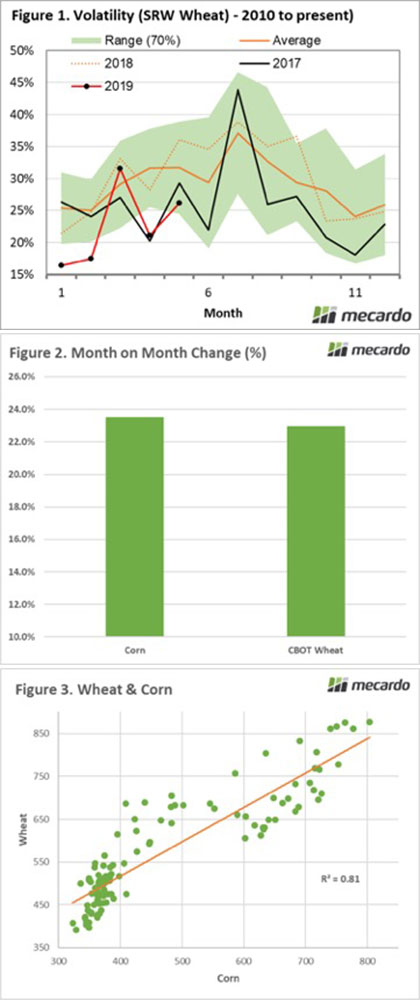
The market tends to be volatile towards the end of the second quarter of the year (Figure 1), and this year is no exception. At the start of May, the global environment had a bearish undertone. The USDA had forecast a year of ample production with most of the grain growing regions experiencing strong annual growth. This led to a projected production of 777mmt and end stocks of 293mmt, both record levels.

The picture with wheat is likely to change in June when the USDA releases their updated datasets, however not by much. So why is the wheat price globally jumping?

The US has received unprecedented rainfall during May, which has meant that areas forecast for corn are now more suited for trout. In the United States, producers are heavily reliant upon insurance. To comply with the insurance coverage there are set final planting days. If you plant beyond the date coverage is dropped by 1%.

Click below to see maps:

The impact has been dramatic, with corn and wheat prices on CBOT rising 23% (Figure 2). Although wheat production remains favourable the issues with corn have flowed through to wheat.

Agricultural commodities tend to have relationships with one another, as they are ultimately in groups of replaceable products. As an example, soybean and canola can be interchanged (to a certain extent). This is also the case with corn and wheat, which both have a high degree of relatedness.

This relationship can be seen in figure 3, which shows that as the price of either commodity rises the other will follow.

On our podcast, we had a chat with Brett Hosking, chair of Grain Growers. In this conversation, we discussed the opportunities for the grain industry over the next few years and the importation of wheat in Australia.
Click here

What does it mean/next week?:

The market will remain well supported in the coming weeks (and months) the nature of the rainfall events in the US will lead to a very sharp drop in expectations for the corn crop.

There are many who are considering that the rise in corn price will lead to farmers planting later and accepting a lower coverage. However, I don’t see this as likely as logistically it seems implausible for many farmers to be able to plant.

In Australia, expectations are also deteriorating with the outlook for rainfall not promising. Every week without decent rainfall will lead to an increase in basis levels.

Offshore support shores up price

The market is turning around, with overseas concerns starting to be a primary driver on our price (as opposed to drought). In this weeks market comment, we take a look at pricing/basis and the newly launched farm aid package for US farmers.

Since July last year our prices have largely been guided by events locally. The drought has pushed basis (premium/discount over Chicago) to levels unseen during the de-regulated marketing environment. This has meant that broadly prices have been strong, and that events overseas have been mostly inconsequential as drought bites. The story over May has largely changed.

The futures market declined steadily from Mid-October through until the start of May. This was driven by positive prospects for the northern hemisphere crop. The speculators jumped in and became extremely short, driving the market further south.

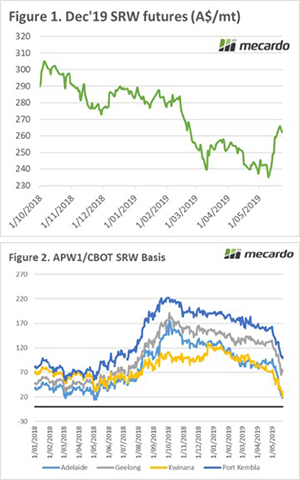
The US however was hit by rainfall throughout recent weeks which has resulted in delays to the planting of the corn crop. As we are all aware there are relationships between agricultural commodities which has caused a flow on to wheat. In the month of May the December futures contract has risen A$23 (figure 1).

When we look locally at our basis (figure 2), we can see that it has fallen since harvest. The biggest falls have occurred in May when beneficial rainfall hit during the start of the month providing some early confidence to buyers. The increase in futures prices is welcome, and if we see continued dry weather in Australia, basis will likely rise further as buyers return to a state of nervousness.

In the United States, the newest installment of farm aid was launched. The farm aid package is designed to compensate farmers (who happen to be Trumps support base) for losses from the trade kerfuffle between China and the US.

It is not yet clear how the fund will be distributed, but it will be based on a county by county basis. This is in order to ensure that it doesn’t impact upon planting intentions, however there are concerns that it will still increase soybean acreage.

The following statement was made by the US President during a press conference:

“The farmers have been attacked by China, but the $16 billion of funds will make clear that no country has veto on America’s economic and national security” Donald Trump

What does it mean/next week?:

The update on planting progress in the US will be the primary driver of the market in the coming days. If we see corn planting remaining well below expectations, it wouldn’t be surprising to see another rise in levels.

The COT report will also provide an indication of the change in positioning of speculators. It is likely that their net short position will be reduced quite dramatically after recent rises.

Have wheat imports impacted Australian prices?

This week sees the first permit for the importation of wheat into Australia since 2007. This has caused a great degree of consternation with producers in the eastern states. But has it had any impact on prices?

The import of wheat into Australia has the potential to cause two issues to grain producers:

1. Biosecurity
There is a concern that the importation of grain could bring foreign diseases or pests which are not currently an issue to Australian producers. There is the potential for large losses to production caused by these pests.

2. Economic
At times there will be the potential to import grain from overseas cheaper than buying domestically, especially in times of drought. Hypothetically the importation of overseas grain would place a ceiling on the domestic price of grain.

At present, the numbers don’t stack up for imports into Australia from any other origins, due to the post-harvest fall in pricing and cheaper options from Western Australia. Nonetheless, this permit approval potentially sets a precedent for future import programs in the event of a drought.

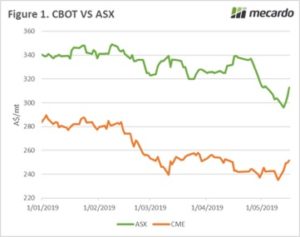
In figure 1, the futures prices for ASX (Jan 2020) and CBOT (Dec 2019) is shown, as we can see prices have risen in both contracts.

The rise in Australia is mirroring the rise in the US, as they struggle to plant their crop due to the recent rains they have experienced. Although prices have risen in Australia, it is not due to the vessel.

The impact of wheat imports of this scale (and time) are negligible from a pricing point of view.

What does it mean/next week?:

The single vessel import permit for Manildra will have limited impact upon the market in its current form. However, if future perpetual permits were issued there is a likelihood of import parity becoming a more realistic issue in times of drought.

In an average year, importation will not be a feasible enterprise for grain consumers.

The weight of the rain

The market was always going to react when the rain arrived. There are many who started their 2019 marketing strategy in the middle of last year. In this update we take a look at physical pricing and basis for new crop around the country.

At its most basic, wheat prices are based on supply and demand, with supply being the most important part of the equation. When there is a sudden shock to supply such as a drought, prices move sharply upwards. The reverse happens when beneficial rainfall arrives, and we see prices fall. This is due to buyers having more confidence that supplies will be available.

In last weeks market comment (see here) and podcast (see here), I mentioned that ASX had fallen 7%. This is a significant fall, and it is under further pressure today with buyers being reluctant to raise bids.

The ASX is a good barometer of grain prices on the east coast. It is important to remember that there is still a basis element between the futures and physical even though it is Australian based.

We are now at the point of the year where physical new crop bids are easily accessible, therefore many farmers who don’t utilize derivatives will be using physical contracts to reduce price risk.

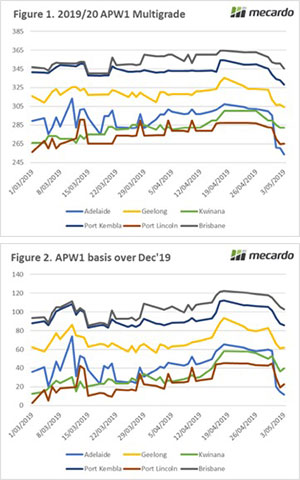
Figure 1 displays the physical contract price for APW1 multigrade and Figure 2 shows the basis versus December Chicago futures. I have selected a number of ports to give a broad spread of the nations’ wheat growing area.
As we can see, the domestic dominated areas have the highest pricing levels. This is due to concerns related to tight stocks in these areas coming into the new season. All zones have experienced dramatic falls since the middle of April when new crop concerns were at their peak.

The rest of the world has seen wheat prices slump as production in the key northern hemisphere growing areas continues to impress. This has meant that our basis over Chicago futures has come under pressure, albeit remaining at traditionally strong levels in the east.

What does it mean/next week?:

It is still very early in the season and rainfall will be the primary driver for Australian basis over the coming months. If we receive plentiful rains, then basis will fall further. Conversely a dry spell will see basis increase in a flash.

Committed to the bear (for now)

Speculation tends to get a bad rap, however, it provides the liquidity to ensure that grain markets operate correctly. 

The commitment of traders (COT) report is a weekly report produced by the US Commodity Futures Trading Commission. The report is released every Friday and is based on the closing position of traders on the close of trade on Tuesday.

The purpose of the report is to provide an insight into the sentiment of the market and where different market participants are trading. When using a futures contract, it is either a long (buy) or short (sell) position.

In the COT report, trader’s positions for contracts are compiled and the area of most interest is where the overall position of speculators lie. The simplest explanation of how to interpret the positions is below:

• If the speculators in the market are net long, then they are bullish and are hoping to capitalise on a rising market.
• If the speculators in the market are net short, then they are bearish and are hoping to capitalise on a falling market.

We all know that speculators bring a huge volume of liquidity into the market and for better or worse they provide the ability to easily trade in and out of positions.

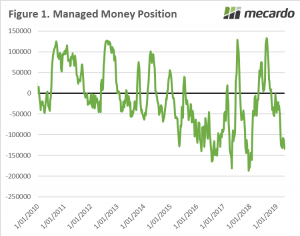
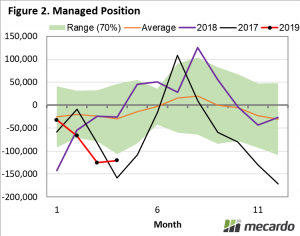
The current position for managed money (or speculators) is shown in Figure 1. This represents the combined position of Chicago, Kansas and Minneapolis wheat. The combined managed money short by 134234 contracts. This means that managed money is currently bearish on the market.

As we can see this bearish slide started in January and has been almost relentless, as global crops started to look promising. It is important to examine the seasonality of the sentiment, which is shown in figure 2.
In this chart, we can see that the current sentiment is extremely bearish compared to typically experienced at this point of the year. It is clear that seasonally the middle of the year is where the speculative money turns bullish. This tends to occur as any crop concerns start to develop.

What does it mean?:

At present, the speculators in the market are very short. However, if we see the release of bullish data, their sentiment can change rapidly.

With the advent of algorithmic trading, it is possible that there can be overcorrections where the market makes substantial movements as traders attempt to close their positions to curb their losses.

Pluviophile’s delight

Pluviophile – A lover of rain; someone who finds joy and peace of mind during rainy days. The rain has teased in recent months, however this week it has delivered to many in need – and the market has reacted.

After months of dry weather we finally see a rainfall event in the east that provides. In the animated map, we can see that large swathes of New South Wales and Victoria have received an opening break, with many receiving >50mm over the two days.

There are some who missed out on the rainfall, however there is still plenty of time to go.

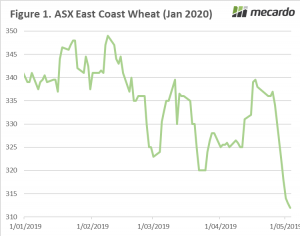
In recent weeks there had been concerns that the rain was never going to eventuate, with ASX futures rising A$20 since the start of April. As we all know prices move when the rain arrives, and the market followed the forecast.

In figure 1, ASX wheat for Jan 2020 is shown since the start of the year. In the past week, the contract has fallen 7% or A$25. The contract is now at its lowest level since April/May last year.
The market now has confidence in the crop, it will quickly revert if rainfall is not forthcoming over the next three months. The crop is not yet made, but in Victoria and parts of New South Wales it is off the starting block.

In September last year, I proposed a strategy of selling ASX (see here), which would have provided a return of A$68/mt. At current levels of A$313, many consumers are considering taking some cover, as memories of the prior years’ levels are fresh in mind.

On another note, If you are looking for something to listen to whilst seeding – give our podcast a shot:
Click here

What does it mean/next week?:

The overseas markets have stabilized over the past week, and it is likely that we will see short speculators start to take profits.

I don’t expect old crop to lose a huge amount of value due to the lack of available supply, however new crop is liable to come under further pressure as buyers pull the brakes.

Low yarding and rain give EYCI a boost.

A combination of low saleyard volumes and rainfall have helped to shore up the Eastern Young Cattle Indicator (EYCI) this week amidst the Easter and ANZAC public holidays, which have provided limited cattle sale opportunities.

The shortened trading week due to the Easter break and ANZAC commemorations have seen EYCI eligible cattle yardings slump to the lowest weekly levels this season.

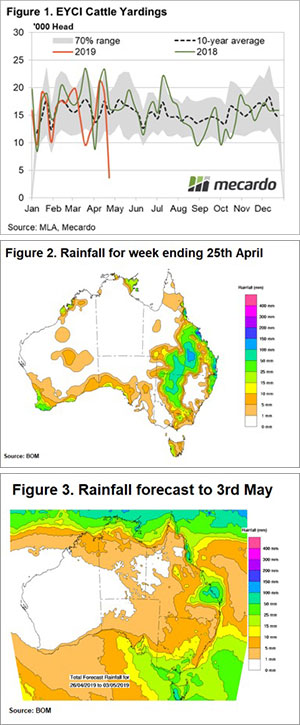
EYCI average weekly yardings have dipped to a mere 3,600 head this week, 59% below the levels seen during the Easter hiatus in 2018 and moved well below the normal range (as identified by the grey shaded zone in Figure 1). In contrast, the 2018 Easter dip toward 8,750 head, which occurred in early April, tested the lower end of the normal Easter throughput range.

The low volume of EYCI eligible cattle offered at sales this week has seen the EYCI bounce 3.6% to close at 468.75¢/kg cwt. Reasonable rainfall in southern Queensland and western NSW is boosting optimism (Figure 2).

However, it was a bit of a mixed bag for other cattle types. According to the Eastern States NLRS reported data, Medium Cow gained 9% to hit 205¢/kg lwt. In contrast, Heavy Steers eased 1.3% to close the week at 275.75¢/kg lwt.

In offshore markets the 90CL frozen cow indicator continues to push higher, reportedly cracking above 690¢/kg CIF prior to the Easter break. This is the highest the 90CL indicator has been in A$ terms since October 2015 when US demand for imported grinding beef was running red hot.

Next week

There is some follow-up rain scheduled for this week, particularly for south-east Queensland and Victoria. It is probably too early to call a start to the Autumn break in the south but it should be enough to keep cattle prices firm as we resume normal saleyard operations into next week.