Tag: Opportunities

Strap on: We are in for a ride

‘A big crop gets bigger and a small crop gets smaller’. This seems to be an apt statement to apply to this year’s Australian production. Continued concerns in the east coast & now in WA have led to more positive price action in the past week.

The ASX wheat contract in the past has been quite illiquid, recent months has seen reasonable volumes move into the contract. The lack of grower forward selling due to drought (& frost) concerns. The contract is deliverable; therefore it provides an opportunity for consumers to have cover to meet requirements.

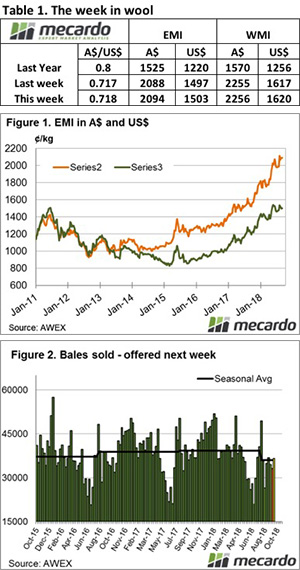
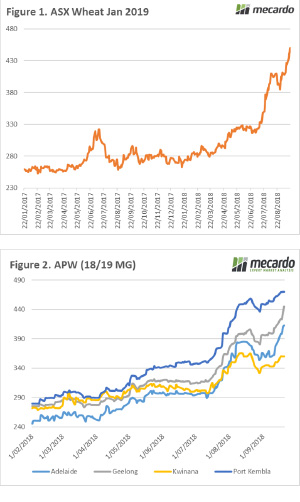
After a rapid rise through July and mid-August to $400-410, the market fell to $385. This dip was short lived, and in September continued dryness and frost in both sides of the continent have led to impressive gains. In the past week the price has risen $25/mt or 6% (figure 1).

At a physical pricing level the new crop multi-grade APW contract has seen a corresponding rise, however selling has been at low. Interestingly the market in Port Kembla, has seen a more sluggish (figure 2) rise than other east coast areas (Adelaide & Geelong).

What does it mean/next week?:

At present there are a high number of growers cutting grain and canola for hay. This leaves an interesting conundrum – will this increase in hay due to drought and frost lead to a downturn in hay prices?

One thing is for sure though, it’s time to strap on our helmets as its going to be a bumpy ride.

Cattle market a paradox

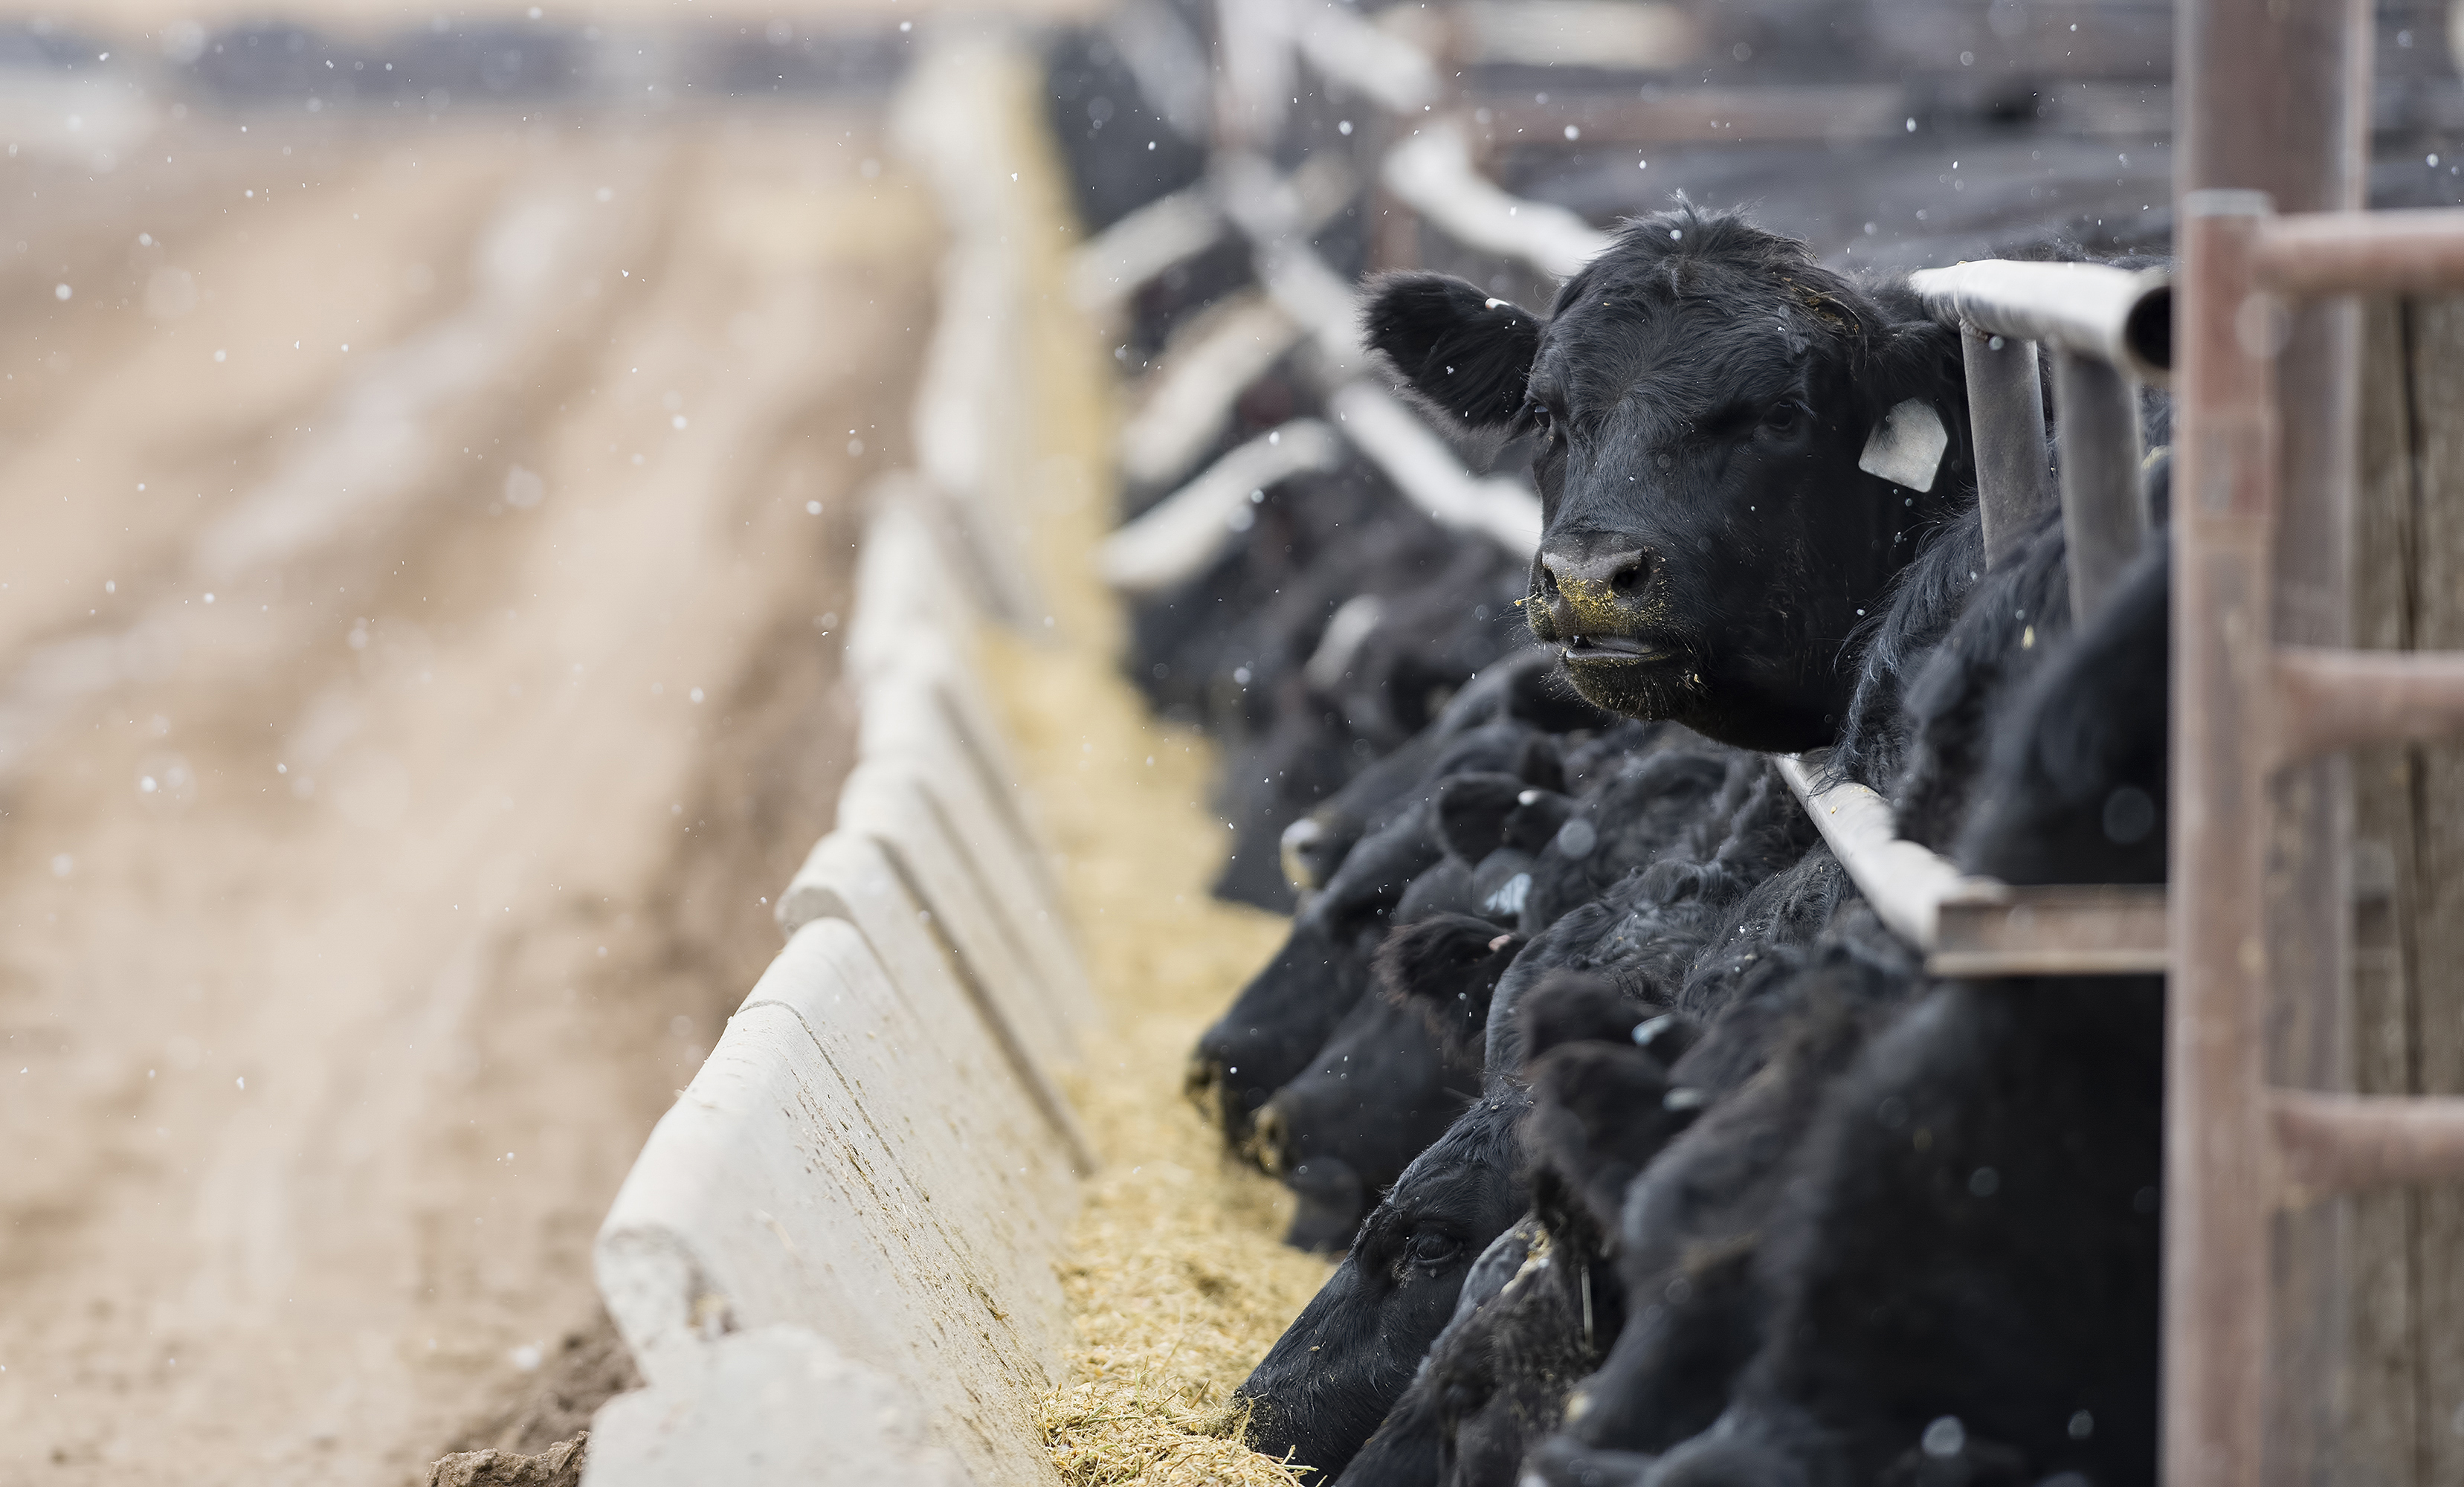
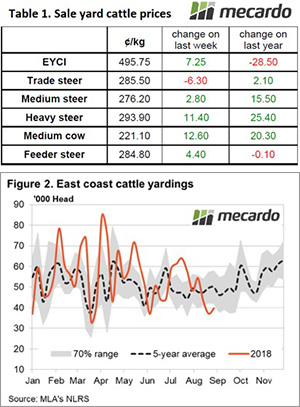
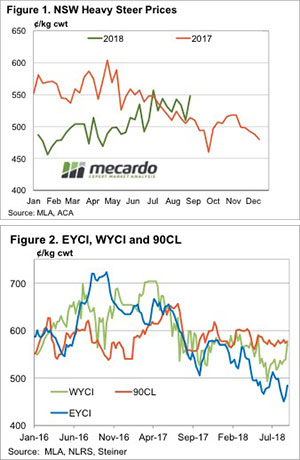
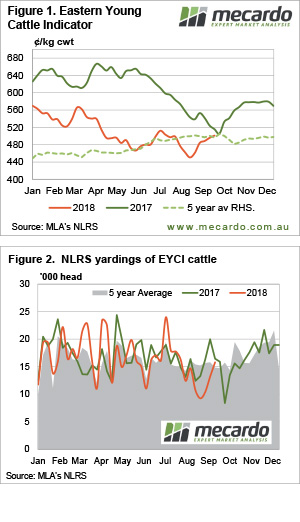
Cattle markets managed to edge higher this week, despite stronger supply. The Eastern Young Cattle Indicator (EYCI) moved back above 500¢ and within a tick of the price this time last year. It’s the spreads in restocker values we are interested in this week though.

Figure 1 shows the EYCI taking its rally up 11% from the lows to hit 501¢/kg cwt. Last year the market reached its low of 504¢ in early October and given the price of grain, and the lack of grass, it is remarkable to see it at similar levels.

Even with young cattle supply lifting to a six week high (Figure 2) prices managed to continue to lift.  Delving a bit deeper into the EYCI data we can see that the proportion of yearling cattle has risen in recent weeks. As we keep saying, demand for finished cattle remains good so those hitting the market are well sought after, which is dragging the EYCI higher.

It was the quotes for restocker steers in MLA’s data which caught our eye this week. In Victoria restocker steers were quoted at 229¢/kg lwt. In Queensland restocker steers were 274¢. You would be forgiven for thinking Victoria was in drought, and things were okay in Queensland. We know it is currently the opposite scenario, with at least parts of Victoria faring okay. It might the depressing rainfall outlook which is limiting demand for young cattle.

WA still has the best cattle prices in the country. MSA Yearlings are quoted at 565¢/kg cwt, 37¢ stronger than their NSW counterparts. Normally finished cattle start to flow in the West at this time of year, which could see some price adjustments coming up.

What does it mean/next week?

Rain will remain scarce over the coming week, with only a thin strip of northern NSW coastline seeing anything meaningful. It’s starting to look like supply is going to be fairly stagnant, with few cattle left to really flood the market. This means prices might stagnate as well, with obvious strong upside when it finally does rain properly.

Spring lambs on the mind

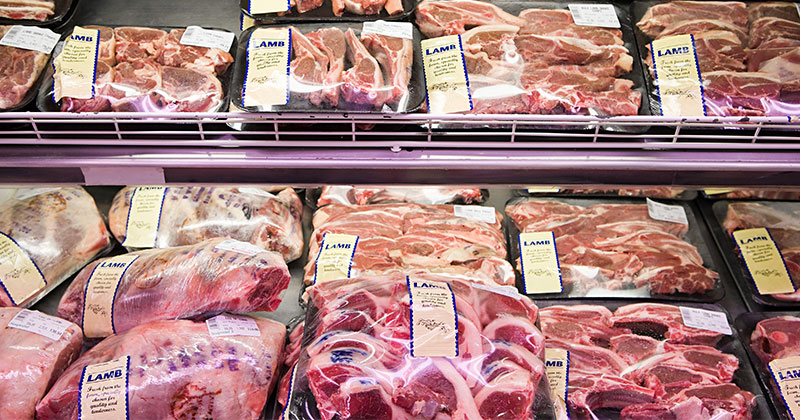
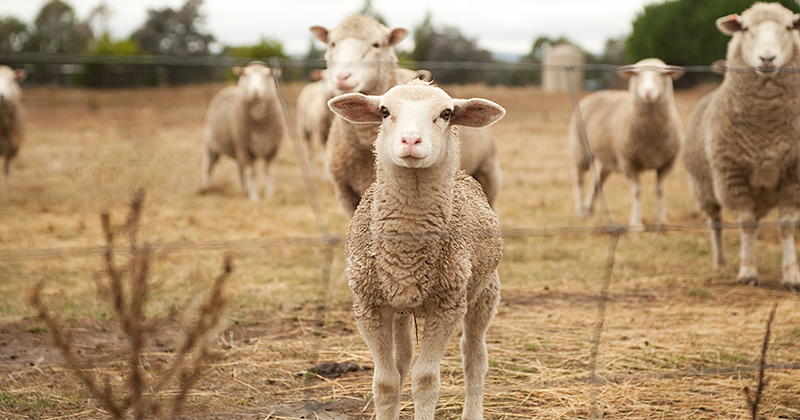
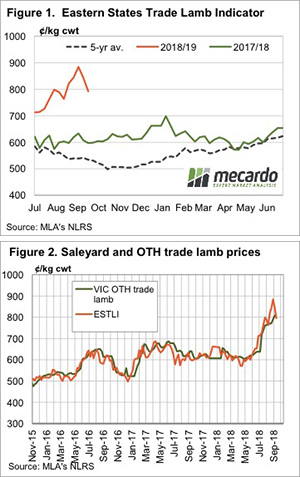
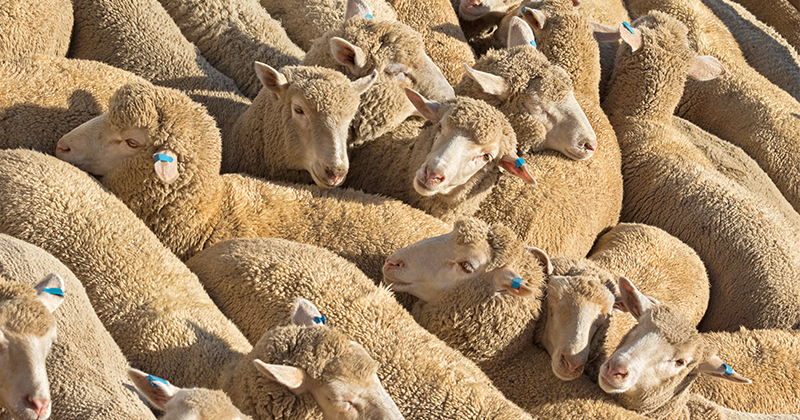
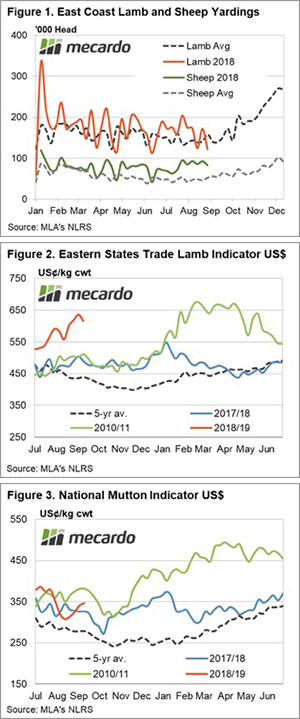
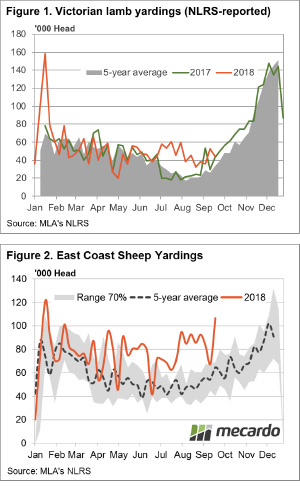
Coles and Woolies are already sprucing new spring lambs on their shelves, and we can see where they’re coming from with rising yarding levels in the south telling us the spring flush is making its move. This has already begun to take its effect on prices, with another week of declines for most lamb categories.

Victorian lamb yarding’s are starting to show signs of the spring flush. September totals for Victoria are currently sitting at 5% above year-ago levels and this is providing a boost to east coast numbers. The total east coast yarding’s were 151,018 for the week. Although 17% lower than 2017, it’s still sitting 8% above the 5-year average for this time of year (Figure 1).

The rising throughput is flowing through to affect the Eastern Indicators. The Eastern States Trade Lamb Indicator fell 19¢ on the week to see it at 773¢/kg cwt. Heavy lambs weren’t able to hold onto their levels for another week, posting a 35¢ drop to 783¢/kg cwt. Restockers were the exception to the falls, managing to finish the week slightly higher (4¢). There’s still a long way to go before we see these prices close in on last year figures.

Mutton prices were again able to largely avoid the fate of lamb prices. The mutton indicator ended the week at 489¢/kg cwt, down just 2¢ on last week. The holding sheep prices in the face of declining lamb prices appears to be encouraging some supply forward. East coast sheep yarding’s have jumped a massive 57% higher in the last week, thanks to spikes in NSW and Vic (Figure 2).

What does it mean/next week?:

As covered in this week’s analysis article, we can’t see lamb supply matching last year’s levels through all of spring. This immediate rally in supply is likely to be mopped up relatively easily by processors.

If supply does continue to increase due to dry conditions, there will be some pressure on prices, but this impact should be short-lived.

The quid pro quo is that with available numbers more likely to be less than the 2017/18 season, tight slaughter supply is likely to maintain upward pressure on prices. The spring flush of supply could again have a limited corresponding decline in spring lamb prices, similar to the past two seasons.

Wool market creeps up.

The AWEX report captured the wool market sentiment this week – it “crept up.” On the first day of sales the EMI pushed close to the 2,100-cent level, before easing slightly on the final day, but in the end, it had regained the minor fall of last week.

 The Eastern Market Indicator (EMI) rose, lifting 6 cents for the week to finish at 2094 cents in AU$. With the AU$ finally having a stable week, the EMI in US$ terms also lifted 6 cents to settle at 1,503 US cents (Table 1).

The current market level is encouraging sales, and wool producers are obliging with minimal pass-in rates. This week at auctions only 2.7% didn’t meet growers reserve. This resulted in a clearance to the trade of 33,160 bales, passing in only 900 bales. This caused a reduced dollar value compared to last week of $82.85 million, with a combined value of $679.8 million so far this season.

In the six auction weeks since the winter recess, 216,780 bales have been cleared to the trade, 20,760 fewer than the same period last year. While there would have been some reserve grower stocks inflating last year’s figures, the average 3,500 bales per week fewer this year is worrying for processors (Figure 2).

The combination of the drought causing reduced fleece weights predicted for the coming months, as well as the significant sheep slaughter this year, looks likely to be all negative for wool supply going forward.

While buyers bid strongly to secure wool, growers can accept strong prices across the board and look forward with some confidence.

As for the Merino section, X Bred lifted slightly, skirtings followed in their wake while cardings were slightly easier.

The week ahead

The offering this week was 4,000 bales fewer than last week, next week a slightly larger offering is rostered of 36,500 bales with all centres selling.

Lambs tank but only to OTH levels.

Lamb markets continued to tank this week. It shouldn’t really come as a surprise, with the previous 850¢+ levels clearly unsustainable. Interestingly, over the hooks prices rallied, with saleyards and direct prices converging.

All lamb prices were smashed this week. The east coast indicators finished Thursday between 97¢ (restocker) and 43¢ (light lamb) lower, all back in the 700s, except for heavy lambs which managed to stay at 818¢/kg cwt.

Prices are, however, still way above the same time last year. The Eastern States Trade Lamb Indicator (ESTLI) has fallen 92¢ from the high but remains nearly 200¢ above the same time last year.  Prices may be down, but they are still very good.

Over the hooks prices continued to move higher this week, following saleyards in order to get supply. With the ESTLI falling back to a comparable level to over the hooks rates (Figure 2), processors should be starting to get some more lambs direct. Perhaps this is why saleyard values have lost some ground.

Mutton prices were stoic in the face of falling lamb values. As noted last week, mutton prices are still relatively cheap and processors are no doubt trying to fill up kills on animals which might still be making some sort of margin. The National Mutton Indicator rallied 10¢ for the week to a two month high.

It looks like lambs are starting to move in the West as well. Trade lamb prices fell 28¢ to 633¢/kg cwt, while mutton lost 34¢ to 428¢/kg cwt. With prices still historically very strong, there shouldn’t be any complaints about the lower values.

What does it mean/next week?:

The question now is how far lambs prices can fall. Supply can ramp up, but only to a point as we know the ability to finish lambs this year is limited. Values above 750¢ are likely to continue to encourage anything that is at trade weights to hit the market, but if they fall below 700¢, sellers might take a punt on putting more weight on and looking for upside.

Improved prices lift yarding, but not by much.

A 1.5% gain in the Eastern Young Cattle Indicator (EYCI) has encouraged a lift in yarding of young cattle, with the highest weekly throughput of EYCI eligible cattle recorded in fifteen weeks noted this week. Improved prices for most categories of East coast cattle saw the broader yarding figures lift too, but levels still remain below the normal range.  

The weekly and yearly change in East coast saleyard cattle prices are highlighted in Table 1, which shows all bar Trade steers managed an improvement. On a yearly basis, it is only the EYCI eligible cattle that are underperforming in any significant manner despite the 7.25¢ gain achieved this week to close at 495.75¢/kg cwt.

Heavy steers and Medium cows continue to lead the pack, both in terms of weekly gains and their price level compared to the 2017 season. Medium cow managed a 6% gain to 221¢/kg and Heavy steers posted a 4% rise on the week to 294¢/kg lwt, with both categories sitting around 10% higher than this time last year.

The mid-month weather update from the Bureau of Meteorology (BOM) was released yesterday showing a continuation of the drier than normal rainfall pattern is expected for much of the country over October, although some parts of the Eastern seaboard are beginning to revert to a relatively normal October pattern. However, it’s not until November that the season starts to look more promising for much of the South Eastern quarter of the nation (Figure 1).

Improved prices across most cattle categories this week has prompted a 7% lift in East coast yardings to nearly 38,000 head. Despite this, increased throughput levels are still trending below the normal range for this time in the season and are around 20% below the seasonal five-year average for mid-September (Figure 2).

Next week

The rainfall outlook for next week returns to limited falls across most of the nation, except for coastal Victoria, so it’s unlikely to see any further rainfall inspired price gains. If the improved prices encourage further lifts in throughput back toward more normal seasonal levels, we could be in for a slight easing of prices as we head toward the last week of September. Particularly with the prospect of a drier than normal October just around the corner.

Global supplies up but local take no notice.

The second of the major supply reports of interest this week was the World Agricultural Supply and Demand Estimates (WASDE), released on Wednesday night. The United States Department of Agriculture (USDA) surprised the market by lifting production estimates for good crops, more than it cut estimates for bad crops.

The USDA stripped 2mmt off the Australian crop and 1mmt off Canada. Both being major exporters of wheat, this could be expected to initiate price support. However, the cuts were offset by a 3mmt lift in Russia and 0.5mmt in Kazakhstan. Apart from being the home of Borat, Kazakhstan is also an exporter of wheat. Both Black Sea countries are reporting good harvests to date, so the lift was somewhat on the back of actual supply, rather than estimates.

The impact on global supplies was a 0.5% lift in production and 1% lift in ending stocks. Figure 1 shows the stocks to use ratio sits at 35%. Down on last year but still very strong. It’s little wonder the CBOT Soft Red Wheat market fell back to 503¢/bu, a two month low.

To local markets, it seems the CBOT Dec-18 fall to around $270/t in our terms was of little consequence. Local markets actually gained ground, with wheat rallying to new highs across many markets.

In terms of international markets, we are now more interested in what they can do for us in the 2019-20 market. With CBOT at $285 in our terms, we might have to wait a little longer for it to hit the magic $300 mark.

What does it mean/next week?:

There doesn’t appear to be a lot of downside for local markets at the moment. As outlined in the ABARES report earlier in the week, supply relief isn’t likely to appear until at least the northern sorghum crop appears in March. That will require some rain, which is yet to appear on any forecasts.

Can solid processor margins spark a rally in the EYCI?

Processor margins remain elevated and have moved back above the upper end of the normal range during August. The healthy margins appear to be encouraging processor optimism at the saleyard according to the behaviour of the spread pattern so far this season. However, is the optimism enough to spark a rally in the EYCI.

The Mecardo processor cut-out model shows that margins have improved over the month to see the average margin level lift from $81.50 per head in July to $180.65 in August. The rebound in the processor margin places the August figure back above the normal margin range, as identified by the grey shaded region in Figure 1 – which represents where the margin has fluctuated for 70% of the time since 2000.

The improvement in processor margins this season began in March and have been recording above-average returns since. Underlying data of buyer behaviour at the saleyard for EYCI eligible cattle shows the weekly spread processors have been prepared to pay above or below the EYCI has been improving since March. It has moved from a discount of 7% in March to a peak of 4% premium in August (Figure 2).

The EYCI processor spread has softened over early September as the EYCI rallied from 444¢ to 490¢. This suggests that processors aren’t inclined to chase the market up despite the good margins being achieved but are more comfortable to provide buying support on dips.

Analysis of the long-term EYCI processor spread pattern, based off the monthly average spread movements since 2004, shows we are nearing all-time highs at a premium spread of 2%. The last time processors were paying average monthly premium spreads in the 2% premium region was during 2014 when offshore demand from the USA was booming and processor margins reached nearly $400 per head monthly (Figure 3).

What does it mean?  

It’s hard to see processor activity driving the EYCI higher in any sustained manner, given we are already near extreme historic levels with regard to the spread behaviour. Despite the robust processor margins being achieved at present, they are still a fair way short of the margins that were being made during 2014. Even processor margins over $300 per head weren’t enough to get the processor spread premium extending higher.

A more likely scenario is to continue to see processors actively supporting the young cattle market anytime we see a price dip towards the 420-450¢ level while their margins remain above average.

Key points:

  • The monthly processor margin has lifted from $81.50 in July to $180.65 in August, per head of animal processed.
  • Improved margins have seen processors more willing to pay up for cattle at the saleyard with the processor spread narrowing from a 7% discount to a 4% premium from March to August.
  • Robust processor margins are more likely to provide firm price support on any market dips rather than spark a fresh rally.

Is mutton due for a moment in the sun?

The Eastern States Trade Lamb Indicator (ESTLI) eased this week despite declining supply at the saleyard and low slaughter figures, suggesting softening demand. In contrast, mutton prices have managed to gain ground despite stubbornly high throughput numbers for the last month and very much above average slaughter figures. Perhaps there’s something other than saleyard volumes and slaughter levels impacting the price at present.

The weekly trend in throughput for the 2018 season for lamb and sheep is highlighted in Figure 1, along with the respective five-year average pattern for yarding levels. Lamb throughput has dropped 30% from the previous week and sits 23% below the seasonal average. The low supply of lamb at present is replicated in the weekly lamb slaughter figures which are running 25% under the five-year average.

In contrast, sheep yarding has been holding firm above the average trend for eleven weeks now and currently sits 57% higher than the seasonal average. High saleyard numbers of sheep are flowing through to elevated mutton slaughter levels with the weekly sheep slaughter running 50% above the five-year average level.

Despite the alternative supply scenario for mutton and lamb, this week prices have responded against conventional wisdom with the ESTLI dropping 3% to close at 855¢/kg cwt while East coast mutton has managed to firm 2% to hit 481¢/kg cwt.

Perhaps the missing element is demand and more specifically offshore buying. Recent trade figures have shown declining volumes for lamb exports while mutton export levels have managed a stellar performance over August.

What does it mean/next week?:

A clue to the waning offshore demand for lamb and the firmness of offshore mutton markets could be the relative historic levels of each commodity in foreign currency terms.  The ESTLI is US$ terms has been approaching levels unseen offshore since the 2010/11 peak at around 670US¢/kg cwt (Figure 2).

In contrast, the offshore mutton price in US$ terms is only marginally higher than this time last season and remains over 100US¢/kg below levels recorded during the 2010/11 highs (Figure 3).  Perhaps there is some further upside for mutton in the short term, particularly if supply begins to tighten. At the very least, mutton prices may be able to hold their ground in the face of a weakening ESTLI as the Spring flush gets underway.

Heavy cattle and WA showing strength.

Despite more upside for the Eastern Young Cattle Indicator (EYCI) it, along with restocker markets, are still languishing behind last year’s levels. The same can’t be said for finished cattle markets, which have moved well ahead of the same time last year.

The EYCI managed a 4.5¢ rise this week to 488.5¢/kg cwt thanks to another week of tight supply. EYCI yardings were at just 10,403 on Thursday, with Roma contributing 23% of the numbers. There was a bit more rain about in NSW which obviously helped keep sellers optimistic and cattle at home.

This time last year Heavy Steer prices were on the decline. Dry weather saw plenty of cattle coming to the market. This year, the lack of feed over the last 6 to 12 months is seeing fewer grassfed cattle available and higher Heavy Steer prices despite the dry (Figure 1).

The NSW Heavy Steer has only been higher in one week since July last year. The same goes for the Victorian indicator, although it is slightly stronger at 556¢/kg cwt.

The WA Young Cattle Indicator (WYCI) jumped higher this week, with Figure 2 showing it is now matching the 90CL Frozen Cow indicator. The WYCI is now strongly outstripping its east coast counterpart, with more grass and cheaper feed grain adding demand to tight supply.

Export prices have been remarkably steady for the last 12 months, even during the drought-induced heavier supply. This is good news for continued support for prices.

What does it mean/next week?:

With some more rain forecast for some key areas of the NSW slopes, it’s hard to see increases in supply or decreases in price. As with recent falls, it won’t be drought-breaking, but it will at least provide some hope that it can rain and might again.

Normal seasonality has been thrown out the window. This year it’s more of a case of where fair pricing is, and when the rain comes to take values back there.