Lambs continue to flow to the market, keeping a lid on prices. However, mutton values have been on the rise and narrowing the gap, as despite the dry weather, the supply of sheep is either not there or being held tight.
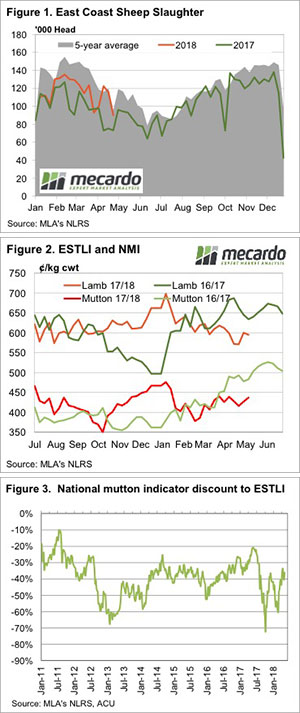
Figure 1 shows that sheep slaughter remains well above last year’s levels, with the short week kill roughly equivalent to the full weeks this time last year. However, the usual autumn slaughter downtrend is in place as supplies remain similar to the five year average.
Lamb slaughter hasn’t been falling, it hit a peak in the week before Anzac day, and last week was 14% above the short weeks at Easter.
The result of lower sheep slaughter, and stronger lamb slaughter, is a narrowing gap between the pricesFigure 2 shows a mild upward trend for mutton since February, with the 10¢ gain this week pushing it to 437¢/kg cwt.
The Eastern States Trade Lamb Indicator (ESTLI) eased marginally this week, losing 5¢ but remaining above the lows hit a fortnight ago.
The mutton discount to the ESTLI has held above 40% for the last three weeks. Mutton isn’t as strong as the 20-30% spread seen this time last year, but given the season, the relative tight supply might tell a story.
Either there are not the sheep out there to sell in response to the dry weather, or growers are confident enough about prices, and profitability to feed sheep through the feed gap.
The week ahead
There is again a little bit of rain moving through Victoria. Enough to confirm a break in some areas where there are a lot of sheep, but likely not widespread enough to see sheep supply tighten dramatically. Lamb supply can’t really rise from here given the extraordinary levels we’ve seen, but prices could continue to track sideways for a little while yet before the winter premiums kick in.
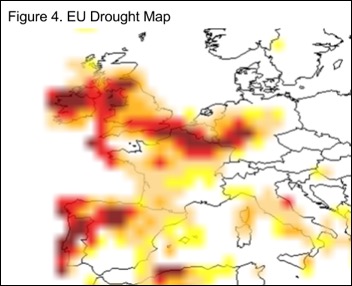
 the majority of the worlds crop being in the growth phase. After six years of strong production, the weather strikes back.
 going forward.

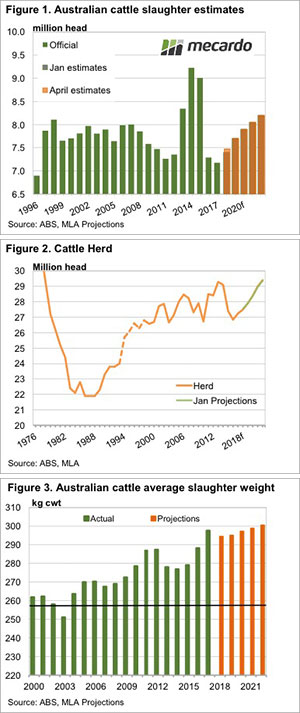
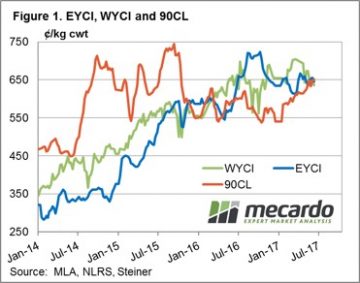 The Eastern Young Cattle Indicator (EYCI) just 1.8% softer to close at 643.25¢/kg cwt. It’s Western cousin a touch heavier with a 2.3% fall to 635¢, while the key beef export benchmark 90CL frozen cow managed a slight 0.9% gain to 652¢/kg CIF – figure 1.
 The sideways price action demonstrated by most cattle categories somewhat unsurprising given the broadly unchanged weekly slaughter and yardings numbers. East coast slaughter for the week ending 2nd June only 83 lower than the prior period and just shy of 136,000 head. East coast yarding posting a 1.8% gain on the week to see 54,940 head change hands – figure 3.
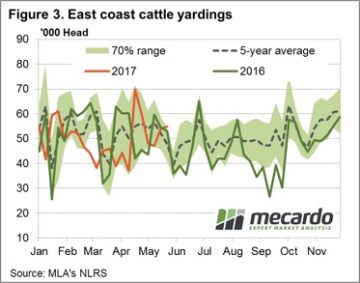
 Australian Wool Innovation has stated it will progress with its Wool Exchange Portal (WEP) beyond the scoping stage and is now moving to the “discovery stage” where the portal is built. Expected industry benefits are $38 million over the first 15 years. In this article Mecardo puts this expected benefit into perspective.
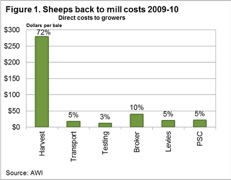
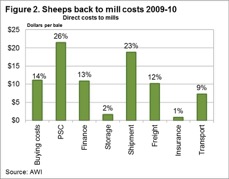 Costs incurred by growers after the wool has been delivered to store (excluding shearing and delivery to store costs) were $72 per farm bale in 2009-10. Figure 2 shows a breakup of the costs associated with purchasing wool (direct costs to mill) in Australia which totalled $75 per farm bale in 2009-10. In total it cost $175 per farm bale to sell wool in 2009-10, through a system with no counterparty risk.
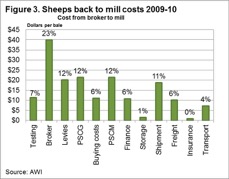 In Australia in 2017, around 1.5 to 1.6 million farm bales will be sold annually through the auction system. In May the average gross value per bale was $1670. For the past three years the average gross value per bale sold has been $1411.
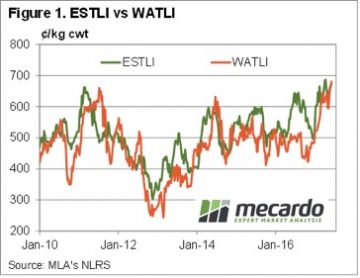 WA doesn’t have the most expensive lambs in the country, but with the Western Australian Trade Lamb Indicator (WATLI) hit a new record this week. The WATLI gained 17¢, to hit 681¢/kg cwt (figure 1), stronger than the ESTLI (670¢) but weaker than Victorian Trade Lambs, which sit at 695¢/kg cwt.
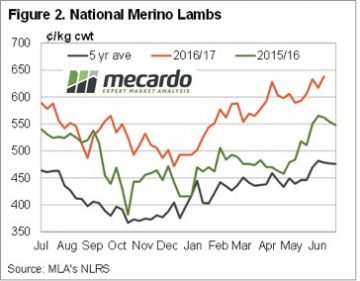 It’s interesting to see lamb slaughter remaining relatively steady over the last five weeks (figure 3), at levels similar to last year. As we said a couple of weeks ago, the same supply, and prices 12% higher, suggest demand has strengthened.
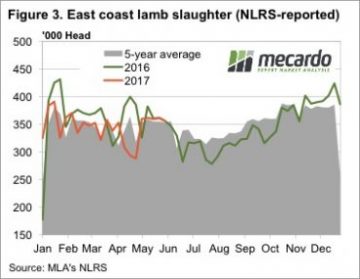
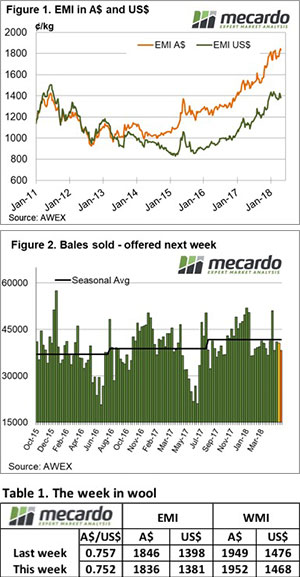
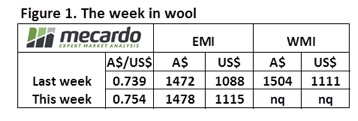 Normal market drivers and influences were turned on their head this week. On Wednesday, the A$ fell and so did the market, while on Thursday the market rallied with the A$ ending the week up by almost US$0.015 cents.
 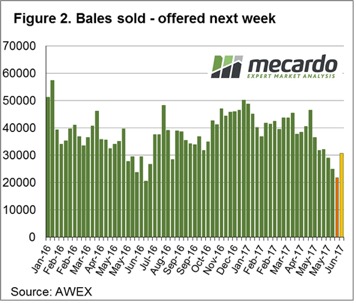 To compare with the same period last year, wool sales; more specifically “clearance to the trade”, are on average 4,000 bales per week lower.
 The opportunity for wool growers is to apply a strategic approach to sales; that is use the wool broker to identify types that are selling well as well as types that are over supplied or lacking demand; and then sell or hold back as your situation allows. The recent market activity shows that a weak market one week is quickly replaced by a rally. It is also a time to have any unsold wool listed on Wool Trade where buyers can access if required.
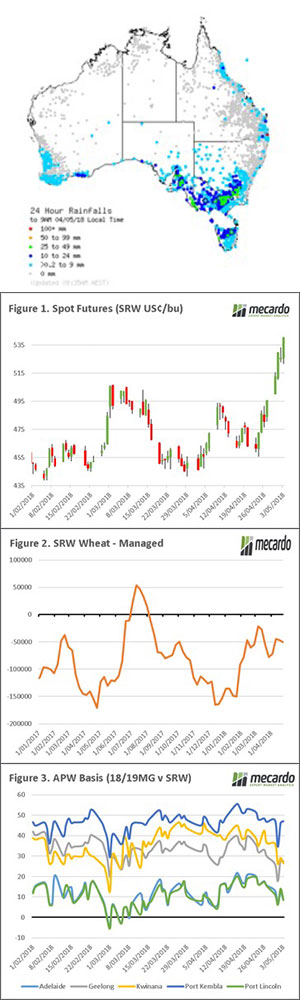
 In our grain article yesterday, we picked out a few bullish factors at play in the market. Our view is that based on current market factors that pricing is close to the floor. In this weekly comment, we look at current pricing and the situation in Spain.
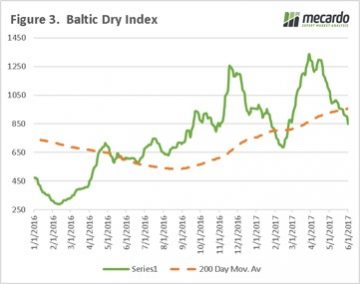
 In the past week, we have also seen the Baltic Dry Index (BDI) fall below the 200-day moving average (Fig 3). The BDI is considered a leading economic indicator as the cargoes typically transported by bulk vessels are commodities requiring further processing (iron ore, coal, grains etc) to create an end product, thereby giving an insight into future economic performance. The poor economic data in China, and declining Iron Ore returns could place further pressure on the A$.