Tag: Sheep

Strong finish to a momentous year.

Exporters would be pleased with the final selling week; a solid finish before the break provides opportunity to write new orders for the re-start in 2019.

The market rose on each of the selling days, providing a sense of stability to an otherwise volatile ride for the wool market in 2018.
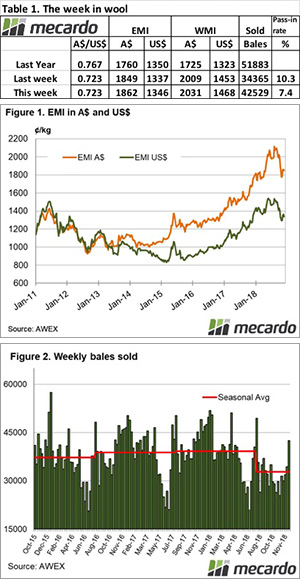
The Eastern Market Indicator (EMI) rose, ending the week at 1,862 cents. The Au$ was slightly stronger, closing at 0.723 US cents. That put the EMI in US$ terms at 1,346 cents, a gain of 10 cents (Table 1).

In the west, the Western Market Indicator (WMI) also rose over the week to end at 2031 cents.

Compared to the original roster posted last week, 46,003 of the 48,700 bales intended for sale this week came to the market. The stronger market meant growers only passed in 7.6% of bales offered. This resulted in a clearance to the trade for the week of 42,529 bales (Figure 2). In the auction weeks since the winter recess, 618,752 bales have been cleared to the trade. For the period up to the Christmas break, on average almost 9,500 per week or 181,400 fewer bales have been cleared to the trade compared to the same period last year.

The dollar value for the week was $83.88 million, for a combined value of $1.56 billion so far this season.

The large crossbred offering again resulted in a mixed result, with early sales for the weak softer before improving by the end of the week.

The oddments market again fell between 30 and 50 cents with Fremantle most affected.

The week ahead

This is the last sale for 2018, with a three-week recess.

The strong finish in the auction to 2018 bodes well for next year, although there are mutterings from exporters that buying orders are spasmodic and on a “just – in – time” basis.

Of note is that the forward market activity is pointing to a solid start to 2019 also.

Throughput levels and price volatility.

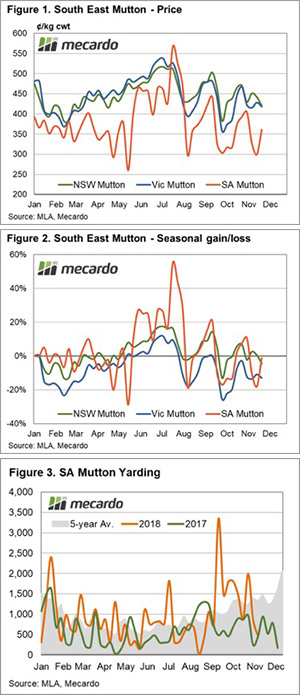
South Australian mutton displays a higher degree of price volatility than their counterparts in NSW and Victorian markets. Indeed, over the 2018 season, SA mutton has experienced a range in price more than 300¢ compared to the 135¢ to 180¢ range displayed by NSW and Victorian mutton, respectively.

Analysis of the price behaviour of mutton in the southeastern mainland markets highlights the close relationship between mutton prices in Victoria and NSW. Since the beginning of 2018, the weekly mutton price in Victoria and NSW hasn’t been more than 40-50¢ apart and have followed each other relatively faithfully (Figure 1).

In contrast, while the broad trend for SA mutton has been following the pattern set by Victorian and NSW markets, there have been times in the season where SA prices have diverged wildly. There have been several occasions throughout the current year when SA mutton prices have moved beyond a 100¢ discount to Victorian/NSW prices and one time when the discount breached 220¢.

Measuring the relative weekly gain or decline in mutton prices for the three states from the beginning of the season in percentage terms helps to quantify the volatility inherent in SA mutton price movements (Figure 2).

SA mutton has seen price falls extend to nearly 30% during May and gains as high as 55% during this season. Victorian mutton prices have been as much as 26% below and 12% above the January opening price. NSW mutton has fared slightly better over the season, posting a 13% price decline and an 18% gain.

What does it mean/next week?

Analysis of weekly throughput levels this season shows that in NSW mutton numbers have averaged around 15,000 head. The higher volumes seem to help reduce price variability as individual lines of stock contribute a smaller proportion to the average prices reported in any given week. As a result, a poorer or better sales outcome doesn’t impact the average price across all sales.

This inverse relationship between price volatility and throughput volumes is also evident in the Victorian mutton data. There has been an average of around 7,000 head of mutton a week at Victorian saleyards this season, which is just under half the NSW average. The price volatility in Victoria has been slightly higher than in NSW.

Similarly, SA reports average weekly mutton throughput of around 1,200 head and the price variability between weeks is significantly higher than other two states (Figure 3). The thinner volumes mean that average prices are more susceptible to influence by poorer or better sales outcomes on a given week. Yards with higher volumes will attract more buyers, bringing greater competition which in turn means that prices can’t be manipulated by a single buyer or small group of buyers with market power.

Key points:

  • Weekly mutton prices for Victoria and NSW are rarely more than 40-50¢ apart and show a lower degree of volatility than SA mutton prices, week on week.
  • SA mutton prices have ranged over 300¢ in price during the 2018 season, compared to 135¢ NSW and 180¢ for Victoria.
  • Higher throughput volumes appear to be synonymous with greater price stability.

Flush nearing completion.

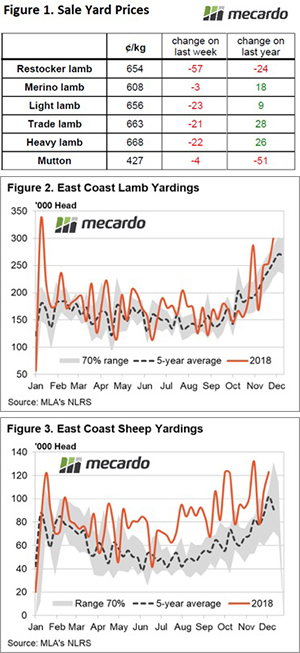
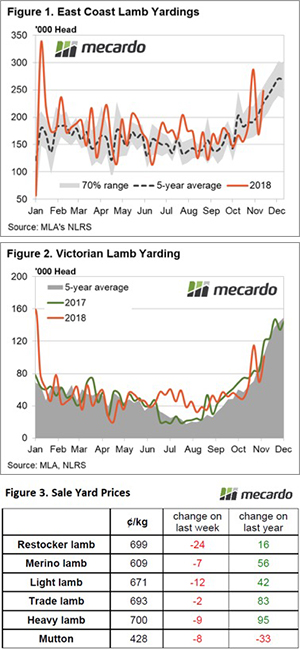
Victorian lamb numbers continue to swell, hitting levels similar to last year’s peak and pushing East coast lamb numbers to levels not seen since January 2018. Sheep numbers at the sale yard have also rebounded over the last few weeks and the result has been softer lamb and mutton prices across the board.

East coast sale yard prices for the commonly NLRS reported categories of lamb and mutton are outlined in Figure 1 and it shows that the increased throughput having an impact on all prices, although only minor falls registered for Merino Lamb and Mutton.

Restocker Lambs taking the biggest hit with an 8% drop to close at 654¢/kg cwt. The Eastern States Trade Lamb Indicator (ESTLI) posting a more modest 3% fall to finish the week at 663¢/kg cwt. Interestingly, we are now nearing the area we originally suggested the ESTLI was likely to bottom out once the Spring flush was competed.

Back in October we released an analysis piece suggesting the bottom would be found around the 630-650¢ level in late November. Granted, we are little late with the timing but its near enough now to call the bottom for the ESTLI given there can’t be too much more of the Spring flush to play out.

Victorian lamb yardings gaining 25% week on week to see 148,298 head recorded. This time last season the Victorian yardings peaked at 147,363 so it is fair to expect there can’t be much more lambs to come in the next few weeks. East coast lamb yardings boosted by the Victorian flow, registering just short of 300,000 head presented, to see the highest weekly total throughput since the start of the season – Figure 2.

A similar story for east coast mutton throughput too this week with a 15% gain in numbers week on week to see nearly 123,000 head yarded. A surprising number of sheep still being offered up, given the elevated yarding we have been seeing along the east coast since the middle of the year.

What does it mean/next week?:

The next week has some pretty good rainfall forecast for much of Victoria and Southern NSW, with up to 50mm expected across a broad area. This is likely to encourage any remaining stock to be held a little longer by producers so expect prices to stabilise and don’t be surprised to see a little kick higher as we head toward the Xmas break.

Merino carries on but crossbreds concede

Last week we saw the wool market settle and this week was much the same for the Merino market. Although, that can’t be said for the whole wool market, the crossbred section ran to it’s tipping point and conceded significantly on previous levels.

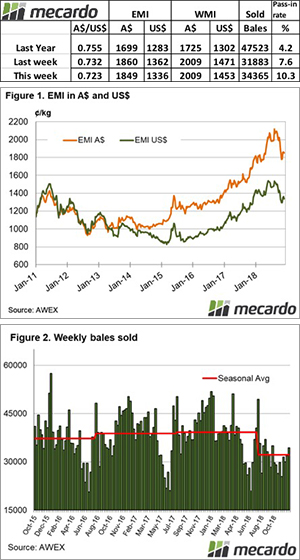
The Eastern Market Indicator (EMI) fell slightly, ending the week at 1849 cents. The Au$ was weaker, closing at 0.723 US cents. That put the EMI in US$ terms at 1,336 cents, a loss of 25 cents (Table 1).
In the west, the Western Market Indicator (WMI) was unchanged on the week at 2009 cents.

Compared to the original roster posted last week, 38,315 of the 39,500 bales intended for sale this week came to the market. The solid market meant growers only passed in 10.3% of bales offered. This resulted in a clearance to the trade for the week of 34,365 bales (Figure 2). In the auction weeks since the winter recess, 580,389 bales have been cleared to the trade.

The dollar value for the week was $69.98 million, for a combined value of $1.47 billion so far this season.

The crossbred sections rally came to an end this week. Wool greater than 30 micron lost between 50 and 130 cents. AWEX reported that the sharp reduction in price was met with firm seller resistance with nearly 20% of crossbred wool being passed in.

Merino fleece had a solid week, particularly in the North. Most microns posted small increases.  The oddments market fell between 10 and 20 cents.

The week ahead

Christmas is just around the corner, at least for the wool market, with 1 more week of sale prior to the break. 48,777 bales are on offer across the three selling centres on Wednesday and Thursday.

Weekly Wool Forwards for week ending 7th December 2018

Increased activity noted in the wool futures market this week with seven contracts traded in total through mid and course fiber categories.
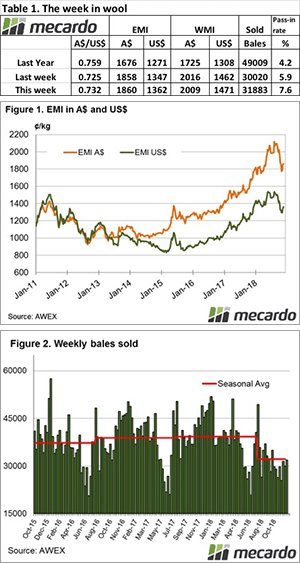
The 19 micron fibres had one contract traded for January 2019 for 2160¢.

21 Micron fibres had two contracts traded. 12 December 2018 at 2,125¢ and March 2019 at 2100¢.

28 micron fibres saw two contracts traded for March and April 2019, both at 900¢. Similarly, 30 micron fibres saw two contracts traded for March and April 2019, both at 730¢.

No minimum price contracts or 18 micron futures contracts were traded this week.

Resilience in wool market

Probably the right result this week in the wool market, where after the turbulence of the previous weeks the market had a settled tone to it.

The two volatile aspects were the strengthening Au$ and the crossbred section where significant demand saw this end of the market rally strongly.

The Eastern Market Indicator (EMI) improved marginally by 2 cents or 0.1%, ending the week at 1,860 cents. The Au$ was stronger by almost 1.0%, closing at 0.732 US cents. That put the EMI in US$ terms at 1,361 cents, a gain of 1% or 14 cents (Table 1).

In Fremantle, the market returned a steady result with the Western Market Indicator (WMI) easing 7 cents to end the week at 2009 cents.

Compared to the original roster posted last week, 34,513 of the 36,000 bales intended for sale this week came to the market. The solid market meant growers only passed in 7.6% of bales offered. This resulted in a clearance to the trade for the week of 31,883 bales, 1863 more than last week (Figure 2). When we look back to the 2017 season, for consecutive weeks 15,000 fewer bales have been sold.

The dollar value for the week was $60.9 million, for a combined value of $1.34 billion so far this season.

In the auction weeks since the winter recess, 546,024 bales have been cleared to the trade, 156,886 fewer than the same period last year. The average shortfall cleared to the trade compared to the same time last year continues to grow and now sits at 9,228 bales per week fewer.

This week it was the Crossbred sections time to shine, Melbourne 28 MPG up 10% for the week with reports of 80 to 100 cent rises as buyers scrambled to obtain wool.

Across the board the Merino section held the line in the face of the stronger Au$, however, there was a varying demand observed for poorer styles and wool showing the effects of the drought. The lower NKt and poorer yielding wool is struggling due to the excessive volumes coming through. This is unlikely to change anytime soon.

The week ahead

With just 2 weeks of selling prior to the Christmas break 39,500 bales on offer across the three selling centres on Wednesday and Thursday.

A steady result would bode well for the New Year opening and what will be an interesting balance between a reduced supply and a healthy appetite for wool from processors.

Mutton still dragging the chain.

With some wild variation in lamb and sheep markets this year it is unusual to see a relatively steady week. But this is how it panned out this week, with relatively steady prices across the east coast indicators. However, delving deeper into state data hints at what may be to come.

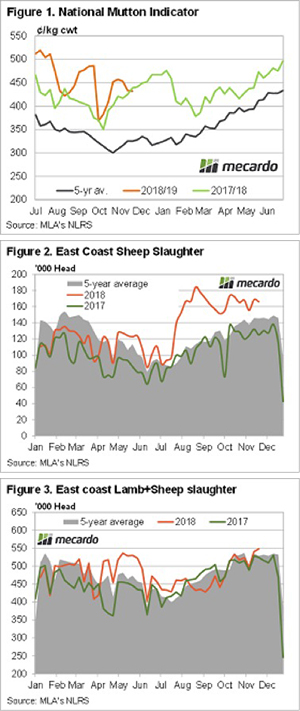
Mutton prices remain well above the five-year average (Figure 1), but this week have again fallen below last year’s levels. With the National Mutton Indicator at 431¢/kg cwt, it was well outstripped by NSW Mutton this week, which sits at 460¢.

Dragging the national average back was Victoria (404¢) and South Australia (336¢). In the West, the Mutton market is close to the national average at 421¢/kg cwt.

Still, Mutton is being slaughtered hand over fist. Figure 2 shows mutton slaughter 33% above the same time last year and 14% above the five-year average. The last time we saw slaughter at this level in the spring was in 2014.

Total Ovine slaughter is shown hitting 548,000 head in Figure 3. It has been four years since the supply of lamb and mutton has been this strong. At that time the Eastern States Trade Lamb Indicator (ESTLI) was at 466¢ and mutton at 295¢. This is a good snapshot of how far demand has come.

The ESTLI finished Thursday at 684¢/kg cwt, supported by NSW where Trade Lambs were 728¢, but dragged lower by all the other states.

What does it mean/next week?:

Rain in NSW this week should continue to help boost demand and should start to limit supply. The flow of mutton has been very strong and we suspect it can’t continue once grass is available. With lamb price still well above last year’s levels, we expect mutton to make up some ground before lamb makes its next move higher.

Increased yardings, easing prices.

A rebound in lamb yarding levels along the East coast was noted this week as the sales program returns to normal post the Victorian Spring Carnival events. The increased supply is weighing on prices marginally, despite the support offered by some reasonable rain to the Eastern half of Victoria and NSW.

Lamb throughput levels increased 47% on last week’s lull in saleyard offerings, to see it back above the seasonal average by 10% as nearly 250,000 head changed hands (Figure 1). All mainland states contributed to the increase in lamb yarding with NSW lamb throughput levels showing uncharacteristically high volumes for this time in the year, sitting 36% above the five-year average.
South Australian lamb yardings saw a gain of 37% on the week but appear to have reached their spring flush peak a fortnight ago, now sitting 12% under the five-year seasonal average trend. Victorian lamb throughput is back on track for a Spring flush peak during November/December, staging a 46% rebound from last week to see over 101,000 head yarded (Figure 2).

The increased supply of lamb is weighing slightly on prices across the East coast with all NLRS reported categories of lamb registering falls between 2 – 24¢. The Eastern States Trade Lamb Indicator (ESTLI) lost the least ground in the face of the additional lamb numbers, closing yesterday at 693¢/kg cwt (Figure 3).

In the West, trade lambs are continuing to play catch up to the Eastern states prices with a 17¢ increase on the week to close at 641¢/kg cwt. The WATLI managed to climb despite lamb throughput levels running 54% above the seasonal average.

What does it mean/next week?:

With rainfall for the next week mainly confined to Southern Victoria, there isn’t an obvious catalyst to get lamb and sheep prices probing higher. The Victorian spring flush still has a few more weeks to run, so price pressure on lambs is likely to continue to persist into the short term but don’t expect them to drop away too far. Consolidation in price at current levels is probably the most likely scenario over the next few weeks.

Is it a cat or a bull?

Last week we reported the market managed to find a point to stabilise and post a modest rise. It was a different story this week, with a strong market evident from the outset and all categories participating.

Buyers seemed to blink first and they bid up strongly for a smaller offering as recent high pass-in rates seemed to cause concern for mill supply.

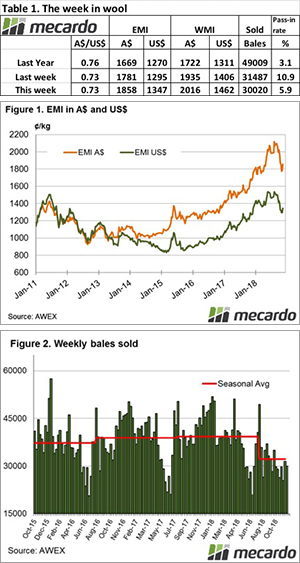
The Eastern Market Indicator (EMI) gained a whopping 77 cents or 4.3%, ending the week at 1,858 cents. It has now regained the losses of the past three weeks. The Au$ was marginally softer, closing at 0.725 US cents. That put the EMI in US$ terms at 1,347 cents, a gain of 4% or 52 cents (Table 1).

In Fremantle, the strong demand was also evident with the Western Market Indicator (WMI) rising an impressive 81 cents to end the week at 2016 cents.

Compared to the original roster posted last week, only 31,889 of the 35,000 bales intended for sale this week actually came to the market. The reduced offering producing a stronger market meant growers only passed in 5.9% of bales offered. This resulted in a clearance to the trade for the week of 30,020 bales, 1467 fewer than last week (Figure 2). When we look back to the 2017 season, this week saw 15,000 fewer bales sold, reflecting growers decision to hold wool out while the market was falling as well as reduced supply caused by the drought.

The dollar value for the week was $60.9 million, for a combined value of $1.34 billion so far this season.

In the auction weeks since the winter recess, 514,141 bales have been cleared to the trade, 141,857 fewer than the same period last year. The average shortfall cleared to the trade compared to the same time last year continues to grow and now sits at 8,866 bales per week fewer.

The most impressive moves came in the mid-micron categories, while the carding indicators rose strongly for the second week with increases between 23 cents in Fremantle and 80 cents in Sydney.

The week ahead

The roster for next week shows 36,000 bales on offer across the three selling centres on Wednesday and Thursday. The following weeks are looking at 36,500 and then 40,000 bales.

The question for the market is are we on another “bull run”, or was this week a “dead cat bounce”?

Offshore mutton demand underpins prices despite high supply.

The Department of Agriculture and Water Resources (DAWR) mutton trade figures were released recently for October and showed that offshore consignments continue to run at levels significantly higher than previous seasons. The solid export demand has come at a beneficial time for producers given the higher than normal sheep turnoff experienced from July to November, providing a buffer for domestic mutton prices.

Monthly consignments of mutton exported offshore totalled 20,406 tonnes swt during October, an increase of 7% on the September figures. This places the October result as the highest monthly total on record (our monthly export data goes back to 2000) and is 19% more than we saw during October of 2017 and 31% more than the five-year seasonal average for October (Figure 1).

Fueling the growth in offshore demand for mutton during October has been increased flows to the USA and China. Indeed, since June, average monthly exports of Australian mutton to the USA have been 137% above the five-year average level and Chinese flows have been 82% higher (Figure 2).

During the June to October period, the combined USA and Chinese mutton shipments accounted for about 50% of the flow of mutton out of Australia, so growth in demand from these two destinations is significant.

Abnormally dry conditions this season have seen mutton slaughter running at elevated levels since the middle of the year as producers try to manage stock numbers. As shown in Figure 3, the weekly sheep slaughter levels reported by Meat and Livestock Australia (MLA) show the 2018 trend extending well beyond the upper boundary of the normal seasonal range.

What does it mean/next week?

Normally such an increase to the supply of sheep being turned off would be expected to act as a headwind on price. However, it appears the surging demand out of the USA and China has been a counterweight to the higher supply. Since the start of July 2018, mutton prices have been averaging 11.5% higher than during the 2017 season, despite having 43% higher weekly slaughter volumes than last year.

Key points:

  • The October mutton export volume was the highest monthly total recorded at 20,046 tonnes swt.
  • Since June, average monthly offshore demand for Australian mutton being sent to the USA and China has been well above the five-year seasonal average at 137% and 82%, respectively.
  • Approximately 50% of Australian mutton product exported has gone to the USA or China since June 2018.