Month: August 2017

Rate of decline declines.

Last week Mecardo looked at when the Eastern Young Cattle Indicator (EYCI) might find a base after a long fall.  While prices still eased this week, the rate of decline has slowed, suggesting some support might be found soon.

Technical analysis isn’t a strongpoint, but we do know that when the pace of a rally, or a decline, slows, the market is usually getting close to changing direction.  Over the 12 weeks to last Friday the EYCI has fallen 112¢ at a rate of 9.3¢ per week (figure 1).

This week the EYCI lost ‘only’ 4.75¢ to hit yet another 22 month low of 538.75¢/kg cwt.  At a dressing percentage of 54%, the EYCI currently sits at 291¢/kg lwt.  The National Trade Steer Indicator sits at 299¢/kg lwt, while the National Feeder Steer Indicator is at 300¢.  With both Trade and Feeder steers at a premium to the EYCI, it suggests restocker type cattle, and heifers are discounted to the EYCI, to drag the average down.

Cattle prices were generally lower despite the weakest yardings for a full week in 11 months (figure 2).  It’s interesting to note that at least in the yards cattle supply has been on the decline for nearly two months, and now sit well below last year and the five year average.

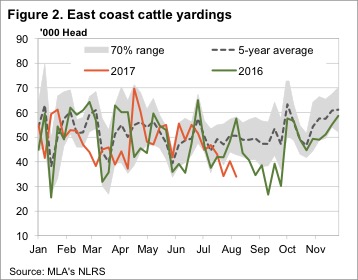
Weakening prices amid weakening supply is a pretty good indicator of weaker demand.  For young cattle we can blame restockers, who have pulled back after driving the market for two years.  For finished cattle the abundance of cattle on feed is helping to keep a lid on finished cattle values.

The week ahead

With no real precipitation on the forecast, it’s unlikely we’ll see cattle prices rising any time soon.  We do think that we’re likely to see some support soon, and cattle prices tracking sideways for a period.  From there we will be looking for a northern wet season to kick-start the market, with 10% upside achievable.

Lamb never more expensive for consumers

Every quarter the Australian Bureau of Statistics survey retail meat prices as part of the construction of the Consumer Price Index.  Meat and Livestock Australia (MLA) have a formula for converting the numbers from the indices into average retail prices.  Given the levels of saleyard lamb prices in the June quarter, it should come as no surprise to see that at a retail level, lamb has never been more expensive.

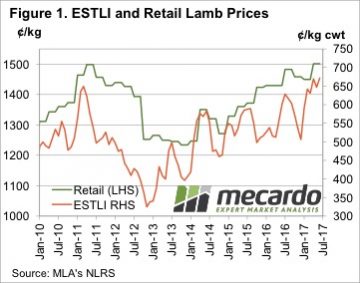
The sharp rise in saleyard and over the hooks lamb prices in the first half of 2017 took a while to translate into strong retail lamb prices, but it did eventually push them to a record.  The average retail lamb price increased 51.77¢, or 3.6%, to move to 1501.37¢/kg rwt.

The retail lamb price in the June quarter sat 4.2% above the same time last year.  This was dwarfed by the increase in saleyard lamb prices.  During the June quarter in 2017, the Eastern States Trade Lamb Indicator (ESTLI) averaged 106¢/kg cwt higher than 2016.  This equated to a 19% rise, so we can see that obviously the rise in saleyard values has not been fully passed on to retail values.

However, things were not as bad as they have been in the June quarter for retailers.  For the two years from July 2013 to June 2015 retail lamb prices averaged a premium to the ESTLI of 792¢/kg (figure 2).  In the June quarter this year the premium was 839¢.

During the very strong price period in early 2011 retail lamb prices didn’t quite break the $15 mark, pulling up at 1498.47¢ in the June quarter.  During this period there were reports that the high retail prices were impacting lamb consumption at domestic and export level, and we subsequently saw a sharp fall in lamb prices.

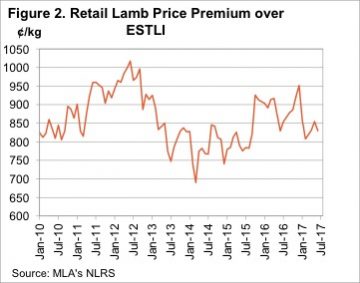
Things are a bit different this time.  Obviously in real terms lamb remains cheaper than it was in 2011, and compared to its main red meat competitor it is not yet in the expensive range.  Figure 3 shows retail beef prices remained strong in the June quarter, and despite the rise in lamb values, beef it still at a 22% premium.  In 2011 the beef premium shrunk to just 4%, and this put considerable pressure on lamb demand.

Key points:

  • Retail lamb prices reached a new record high in nominal terms in the June quarter.
  • The retail lamb price premium to saleyard prices fell, but it has been lower in the past.
  • Beef still commands a strong premium to lamb at retail level, so pressure on price from consumer level is unlikely.

What does this mean?

At this stage it looks unlikely that we’ll see a push back from consumer level to record high retail lamb prices, given that it is still competitive relative to beef, and the margin to saleyard values is still well above levels we’ve seen in the past.

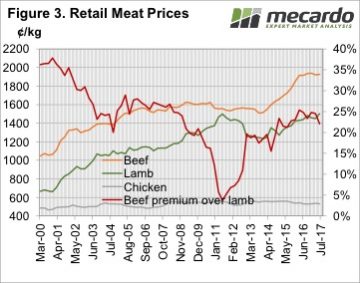
There remains some concern in the expensive red meat prices relative to static cheap chicken prices, and this is being borne out in consumption levels.

The issue will come when lamb supply recovers, and this extra meat has to find a market.  If export market can’t take it we might see lamb prices ease at retail and then saleyard level in order to claw back some market share from the white meats.

Anomalies in the lamb job

Just when we were expecting the lamb market to continue its late winter and spring slide into the mid-500s, demand seems to have found some life.  This week the lamb market rallied back to 5 week high despite increasing slaughter rates.

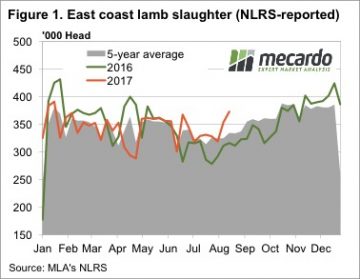
Markets can sometimes defy even the most rusted on seasonal trend.  A couple of anomalies caught our eye this week.  Figure 1 shows the massive jump in lamb slaughter over the last two weeks, to the point where for the week ending the 18th August, we hit its highest level since the third week of 2017.  In fact lamb slaughter last week was the third highest for the year.

The 5.4% increase in east coast lamb slaughter was driven by a 10% increase in Victoria, with the 372,731 head the highest August weekly slaughter on record, by a margin of 3%.

Despite the increasing supply, lamb prices managed to post a counter seasonal rally.  The Eastern States Trade Lamb Indicator (ESTLI) gained 24¢, or 4% to 618¢/kg cwt (figure 2).  The rise was on the back of increases in all states, 29¢ in NSW, 36¢ in SA and 8¢ in Victoria.

The higher ESTLI took it to within a few cents of the forward contracts released back in May and June.  Up until now the forwards had been well in front, but stronger demand might see the markets in front next week.

WA continues to lead the market, with the Trade Lamb Indicator gaining 6¢ to 666¢/kg cwt this week.  WA Mutton values eased, but remain the most expensive in the country at 440¢/kg cwt.

The week ahead

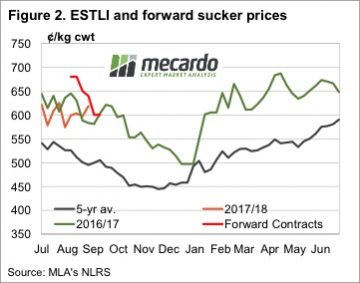
There has been some talk around about slow lamb growth rates impacting on the supply of finished lambs early in the selling season.  While this could explain continued strong prices, the high slaughter rates suggest supply is ok, and demand may be pushing prices higher.

We often say higher than normal slaughter early in the year bodes well for prices later on, and this is even more so when prices remain so strong.

Carried by the wool market, yet again

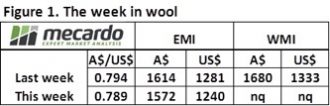
The optimism that was evident following the last two weeks of strong wool market sales suffered a reality check this week. With the market only selling in Melbourne & Sydney, and with the sale conducted on Tuesday & Wednesday due to “Wool Week” activities, it was a sharp correction across all types that occurred.

The EMI fell 42 cents in A$ terms to settle at 1,572 cents, while in US$ terms the market corrected 41 cents (figure 1). The finer types (19 MPG and finer) suffered falls in the order of 2%, held up by superfine wools (16.5 MPG) which valued at an 8 cents gain in the Northern market, the only plus for the weeks close. While the other Merino types were down 3% on last week.

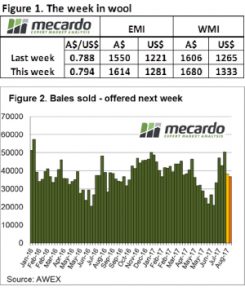
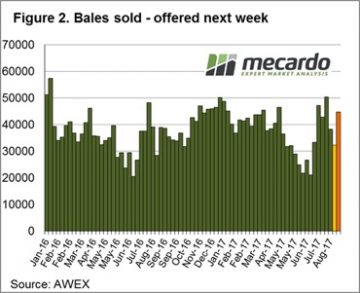
The response from growers was to pass-in14% of the offered wool, resulting in 32,342 bales sold for the week, well down on the average for this season. It is an interesting situation with the market trading at historic highs and yet we have a pass-in rate that is high by any measure. Growers are clearly comfortable holding out, despite these historically good prices, suggesting their not too concerned that any major correction will occur in the near future.

While any correction is disappointing for sellers, it should be noted that the wool market is still well above levels of this time last year.  Reports from Northern brokers on Wednesday proposed that the market may have found a short term base.

Cardings have fallen in both Sydney and Melbourne, by 8 cents and 33 cents respectively. While Crossbred, after performing strongly in recent weeks, is now sitting 538.5 greasy c/kg, taking a slight retraction but still not as strongly hit as merinos.

The week ahead

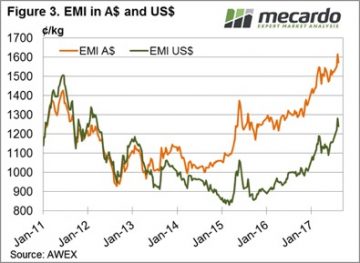
Next week Fremantle rejoins the selling roster and 44,750 bales are rostered (Figure 2). The pattern over recent months has been for the market to rally, then correct but quickly recover as growers hold wool back from sale. This is likely to be the pattern going forward so next week there is an air of optimism from sellers that we can see the market at least hold.

The Russians at the gates

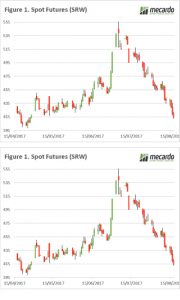
In recent times, there have been accusations of Russian tampering in western politics. In the wheat game, the Russian crop is interfering with our grain pricing! In this week’s comment, we highlight the Black Sea, and its impact on global pricing.

In figure 1, the spot futures are plotted. It’s not a pretty chart. The Chicago futures market has lost 142¢/bu or approximately A$66 since the peak of the season in July. This rally has provided many of our readers with good opportunities, for those who covered swaps or confidently contracted physical forwards. It is important that when we have such an oversupplied market that, when markets rally substantially, we begin to lock away price. We must make sure we don’t aim to hit the top of the market, as you will be perpetually disappointed.

The recent fall in the market can partially be attributed to growing expectations of the Russian wheat crop. The recent WASDE report, alongside many private forecasters have tipped that the Russian crop will be the largest the country has produced at 77mt (figure 2), 7% above last year and well above (+40%) the ten-year average of 55mmt. Although, the Ukrainian crop has marginally dropped year on year, it also remains large at 22% above average.

The expectations of an immense Russian crop, alongside a low rouble, has resulted in Russian wheat becoming extremely attractive with an A$/mt terms 12.5% protein wheat pricing at $233 fob. The Black Sea crop will continue to place pressure on prices, as their export program will be substantial this year, and will be competing into similar markets to Australia.

Next Week/What does this mean?

This year seems to have parallels with the past two seasons, however last year the majority were gifted with strong production in Australia.

The focus at a local level will firmly be on the crop, at the moment the rain is coming in leaps and bounds. How long will this continue, and how much surety in the crop do we have. At present estimates of the overall crop have improved from the end of July, and it wouldn’t be unexpected to reach the upper end of the 17-22mt range.

Lamb price doesn’t want to die

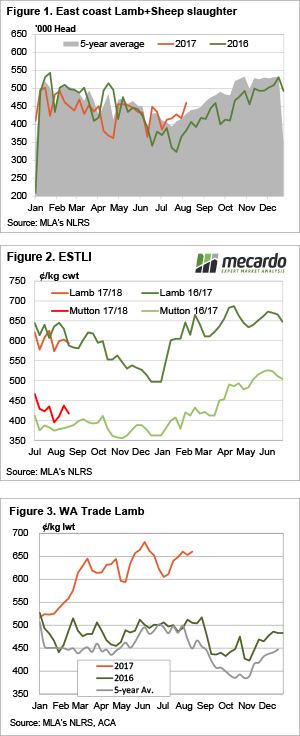
Average trade lamb prices continue to track around the 600¢ mark on the east coast, and higher in the west. Lamb and sheep slaughter has rallied and is sitting well above last year’s mark, but demand appear to be keeping pace with supply.

In the week ending last Friday lamb and sheep slaughter tipped over 450,000 head, and reached its highest level since March (figure 1). Ovine slaughter sat 20% above the same week in 2016, and was largely driven by much higher lamb slaughter in SA and Victoria. In NSW there was an extraordinary 65% year on year rise in sheep slaughter.

The good news is the stronger supply this year isn’t sending prices lower. Figure 2 shows the Eastern States Trade Lamb Indicator (ESTLI) and the National Mutton Indicator (NMI). The ESTLI is at almost exactly the same level as last year, despite lamb supply being stronger, while the NMI is 8.6% above this time last year.

In WA the market continues to outpace its east coast counterpart, sitting at 660¢/kg cwt this week (figure 3). In SA trade lambs are at 524¢, which for a 20kg lamb equates to a difference of $27/head. It doesn’t happen often, but it’s almost worth trucking lambs to the west.

Figure 3 also shows that the precipice is coming for WA lambs, as they there is a very reliable price decline at this time of year. How far WA lamb prices fall is the hard part, it’s hard to see them going back to 500¢, but that is where they came from in January.

The week ahead

Lamb and mutton price should decline further in most markets over the coming month. They are, however, showing stubborn resistance to lower level, even in the face of stronger supply. This is good news, but the tipping point is coming, with the only question being how low they will go. My moneys on a 525-550¢ range in September.

NZ flock still in decline, but stabilising


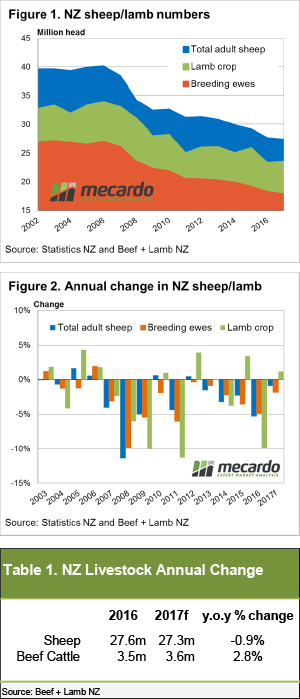
Beef and Lamb NZ’s mid-year stock number survey shows the Kiwi sheep flock and number of breeding ewes continuing to decline into 2017, albeit at a lesser degree than in previous seasons. Although, good pasture and ewe condition throughout the breeding cycle has seen an improvement in the anticipated lamb crop for this year.

Figure 1 shows the decline in total sheep, breeding ewes and the annual lamb crop numbers since 2002, with a noticeable levelling off in the gradient of decline for total sheep during the 2016 to 2017 period, to see the NZ flock expected to finish the year at 27.3 million head.

Breeding ewe numbers mirroring the decline in the total sheep flock, posting a 1.9% fall from 2016 levels to see 17.8 million head recorded for 2017. Although, the total sheep flock has been given a boost by increasing trade and replacement ewe hoggets over the period to see a 1.7% lift in hoggets for 2017 to 8.7 million head. The net impact of reduced breeding ewes being offset by higher numbers of ewe hoggets being paired with rams and improved pasture availability, leading to improved ewe condition during the mating cycle, has seen an increase in the lamb crop of 1.1% anticipated this Spring to 23.5 million head.

The decreasing annual rate of decline in total sheep and breeding ewe numbers evident in figure 2, with the year on year percentage change from 2016 to 2017 pretty obvious. Indeed, for 2016 total lamb numbers declined 5.3% compared to a 0.9% drop expected for 2017. Similarly, the 4.9% fall in breeding ewes in 2016 has narrowed to a 1.9% decline anticipated for the current season. However, the biggest year on year improvement reserved for the lamb crop with a 9.9% decline in 2016 against a 1.1% rise forecast for 2017.

What does this mean?

The reduction in the rate of decline for sheep numbers in NZ isn’t robust enough to point to a return to favouring sheep/lamb production. Although, it is useful to keep an eye on how the industry is trending over there, particularly with reference to supply, as NZ are our only serious export competitor. Indeed, reduced NZ sheep production over the last decade has helped support overseas demand for the Australian product.

Declines in farm gate dairy prices over the last two years have seen the NZ dairy industry contract slightly, but remains NZ’s largest export sector and continues to fight for acres with sheep producers. Similarly, relatively high cattle prices and a favourable season is expected to see the NZ beef industry continue to expand into 2017 (Table 1) further hampering the ability for the NZ sheep industry to return to a significant expansion phase.

Rain helps support Victoria and WA

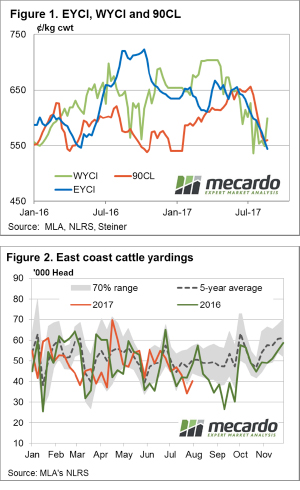
National Trade Steers holding up reasonably well this week, supported by price lifts in Queensland, as most other categories of cattle take the lead of the Eastern Young Cattle Indicator (EYCI) and continue to probe lower. Although, prices out West and in Victoria buck the trend as continued rain provides a bit of support.

Figure 1 highlights the 9.2% lift in the Western Young Cattle Indicator (WYCI), a solid recovery but not as strong as WA cows, with Heavy Cows up 12.7% to 188¢/kg lwt and Pastoral Cows posting a 26% increase to 110¢/kg lwt. In contrast, the EYCI continued its slide to shed 2.6% on the week to close at 543.5¢/kg cwt, while the 90CL frozen cow was largely unchanged at 559¢/kg CIF. National saleyard indicators all softer, with the exception of Trade Steers, posting a 1.1% gain to 568¢/kg cwt. The biggest falls in the national market reserved for Medium Cow and Heavy Steers, off 5.3% (393¢/kg cwt) and 4.6% (497¢/kg cwt), respectively.

A 17% lift in East Coast cattle yardings noted, although it must be noted coming off a fairly low base from last week, to see just over 40,000 head change hands – figure 2. Comparing the weekly cattle throughput figures on a state by state basis showing relatively higher yarding levels in Queensland persist, with figures here just 8% below the five-year average levels for this time of the season. In contrast, compared to their respective five-year average levels, NSW throughput is 20% under, Victorian yarding sits 36% below and SA is 40% below.

The week ahead

The rainfall distribution we have seen over the last few weeks continues again for the week ahead, with much of NSW and all of Queensland missing out, while Victoria and parts of WA continue to get a soaking. National cattle price movement likely to remain in a consolidation phase as softer prices in drier areas are offset by firmer prices for those regions enjoying some rainfall. The stabilisation of the 90CL in the last few weeks also likely to lend some support to the EYCI in the short term.

A plunge, a peak and a pretty happy market

Last week the market kicked off for the season with full force and we expected week 2 to be a little lacklustre in comparison. But no, the Australian Dollar plunged, the auction price peaked and those with the patience to hold on past the first week came out grinning.

All forces lined up to lift prices right across the wool market. The EMI broke into the record books, rallying 64¢ for the week to an all-time high of 1614¢ in A$ terms. In the West, the indicator finished at 1680¢, up 74¢ (Figure 1). The record prices seen on the auction floor largely have movements in the Australian dollar to thank. Earlier in the week the dollar plunged down to the low 78US¢ region, hitting the lowest level we’ve seen in the last month. This encouraged strong demand on the export side with offshore buyers making the most of the low foreign conversion rate before the currency rallied again toward the weeks’ end. In US dollar terms, the EMI finished 60¢ higher, a substantial 28% gain on this time last year.

It was on Thursday that the market really jumped, with demand clearly exceeding supply. Pressure was particularly high in the 21 to 23-micron range in the East. The 21micron reaching 1668¢ in the North and 1663¢ in the South. Demand for fine wool broadened out between the Northern and Southern markets. 16.5 MPG saw a real win in the South, receiving a 118¢ rise on the week. This was only outshone by the 18.5 micron in the West which gained 120¢ to 2081¢.

As anticipated, volumes leveled down this week after the post recess splurge (Figure 2). 39,126 bales were offered up across the nation with just 2% pass in rate owing to the drop in supply since last week. To compare with this time last year, volumes being pushed out to market are still considerably higher.

Week Ahead

Anecdotal evidence from brokers is suggesting that demand at these levels might be a petering point for mid fibres wools, particularly with the A$ regaining some value again. The chance for similar magnitude gains as experienced this week is probably slim in the coming few weeks. Particularly so, if the Australian dollar remains around its current levels and slows down orders from overseas.

The offerings will continue to decline next week with Fremantle on break. Sydney and Melbourne are both selling but on a Tuesday and Wednesday roster due to Wool Week with 36,888 bales on offer.

USDA launches nuke, and brings the fire and fury

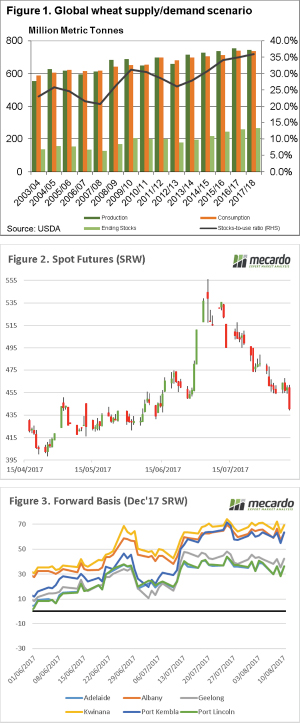
In the past week there has been significant posturing from both the Donald, and North Korea threatening to bring ‘fire and fury’ upon one another. It looks like the USDA might have fired the first salvo, with the release of the August WASDE report. In this week’s comment, we will look at what the fallout has been.

The World Agriculture Supply and Demand Estimates were released overnight. The reports in the middle of the year can provide some surprises, this is due to the fact that this period of time clarity is being achieved on the northern hemisphere market. This month’s report did not disappoint in that respect.

In articles in recent weeks, and presentations around the country I have commented that wheat quantity is not the biggest issue in the world. The main concern faced is quality, there are tightening stocks of high protein wheat around the world. This is reflected in the USDA report, which shows that wheat ending stocks for this year are to increase by 2% to 264.69mmt (Figure 1).

This is the highest world stock levels in history. Many may discount this number by the fact that China hold 48% of the world’s stocks. When we remove Chinese stocks, world stocks are still high. Since 1960, world stocks excluding China have only been higher in 8 seasons.

The report was more bearish than many commentators had expected, this has resulted in overnight prices diving (figure 2). In A$, the Chicago futures spot contract fell around $7, and have fallen A$55 since they mushroomed in late June/early July.

At a local level basis levels have remained somewhat stable over the past few weeks (figure 3) as buyers become reluctant to purchase at higher levels, and recent rains increase a small amount of confidence. Although there is still quite a way to go until harvest, and the crop could easily go either way.

Next Week/What does this mean?

The trade will be continuing to assess the impact of issues on the northern hemisphere, but as each week progresses more clarity is achieved and if nothing major happens upside (on low protein) is limited.

The key factor will be if Australia can achieve high protein wheat this harvest, and the rest of the world has a deficit then we are looking down the barrel of strong premiums. If the rain continues, and low proteins emerge from our crop then our prices and local basis will largely be driven by the domestic market.