
 Local and international wheat markets continued to edge higher this week. Local markets are still trying to get a grip on where the crop will end up, as it shrinks by the day. The international market remains awash with wheat, but a rising rouble gave unlikely support.
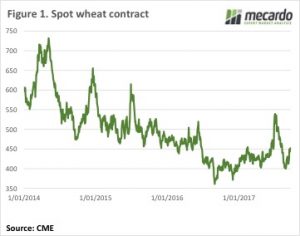
Regular readers will be aware of the heavy wheat crop in Russia, and subsequent cheap exports emanating from the Black Sea. This week those exports became a little dearer, as the Russian currency, the Rouble, rallied against the US dollar.
This helped lift CBOT wheat futures to a five week high, with the December contract gaining 8¢ for the week to get back to 452¢/bu last night (figure 1). The Aussie dollar is not doing grain producers many favours, it’s stuck at 79US¢, putting December Swaps at $210/t in our terms.
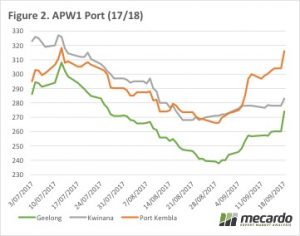 Locally the dry spell in NSW continues to run down the potential crop, with prices responding accordingly. ASX East Coast wheat, which we must remember is now deliverable in Victoria, was quoted at $283/t yesterday, up around $10 for the week. Interestingly Geelong continued to lag a bit, although it was up around $14 for the week to $274/t (figure 2).
The more stricken zones of Newcastle and Port Kembla hit $321 (figure 2) and $316 respectively. A good price but unfortunately there won’t be much wheat to deliver at these prices.
Barley prices are lagging significantly in the north, priced at $268 (Newcastle) and $250/t (Port Kembla), but in Victoria they are at a more normal spread, about $40 behind APW, at $240/t.
 Canola values are also at a premium in the northern cropping zones, but not as much as you would think. Newcastle Canola is priced around $550, with Geelong just $15 behind, at $535/t. It’s hard to see much canola being produced in NSW, but there might have been enough carry over from last year to satisfy local crushers.
The week ahead
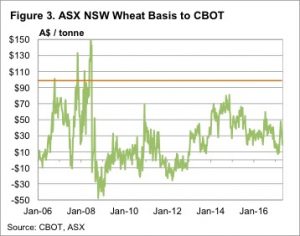
While it remains dry the question is how much more of a premium can local wheat markets get on Chicago. In Port Kembla APW basis to CBOT broke through the $100/t mark this week. The old ASX wheat contract, which was deliverable only in NSW (figure 3) only went higher than $100 premium to CBOT during the 2007/08 harvest.
 The headline Eastern Young Cattle Indicator (EYCI) finished softer again this week, but not before staging a slight gain off the mid-week low of 513.50¢/kg cwt as saleyard throughput numbers decline in the face of the lower prices.
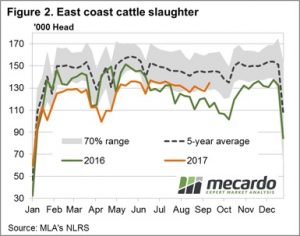

 On Thursday, I will be presenting to the Crop Science Society of South Australia on the topic of GM crops, and the markets associated with them. I thought this was therefore an opportune time to look at the GM moratorium, and whether the promised premiums are available.
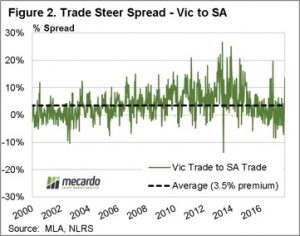 The South Australian government may point to a knock-on effect where other commodities are receiving a boost. In that case, we thought it was worthwhile checking how strong the premium for cattle and lamb had been due to being from a GM free state.
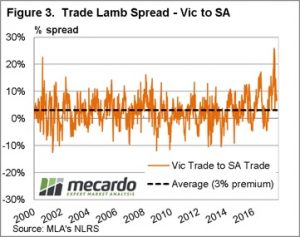 The South Australian ban on GM cultivation is providing little if no extra premium to prices of livestock and canola. There may be premiums in other sectors such as the seafood and wine industry, however this is of little comfort to canola producers.
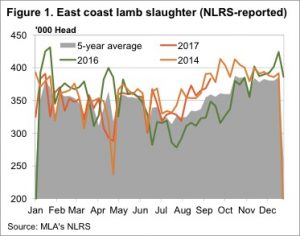 The lamb market is throwing up some interesting data at the moment. Meat and Livestock Australia’s (MLA) weekly slaughter data is telling us lamb slaughter is at a record for this time of year, yet prices remain historically strong.
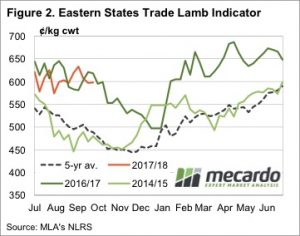 In 2014 rising lamb supplies saw prices fall heavily in August, and stay there until December. Apart from prices easing from extreme highs in June, we still haven’t really seen prices deteriorate in response to stronger supply.
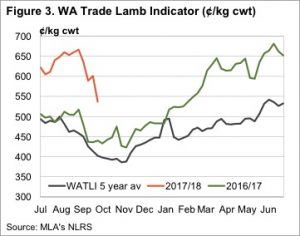 In the last few years the 400,000 head mark has been the trigger point for heavy falls in prices. Lamb slaughter appears to be headed that way, but could just as easily track sideways for a month or so. Does this this mean prices will also track sideways? It’s hard to say, but demand appears to be very resilient.
 In commodities, and particularly in agricultural commodities, a stable market is generally a good sign, especially if the market is at the top of its recent trading range. The wool market can best be described as “steady” this week, however, as usual there were some exceptions with the fine wool and crossbred selections in Melbourne underperforming the market.
 A total of 40,699 bales were offered for sale this week. The steady market encouraged growers to more readily meet the market, with the pass-in rate of 6.9% well down from last week’s significant 15.5%. (Figure 3).
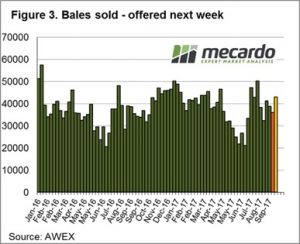 The market has been a bit “bouncy” up to this week, we wouldn’t predict either stable or unstable for next week, its “one of those times” in the wool market!
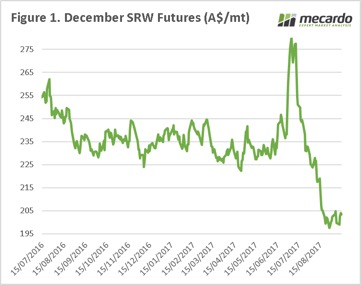 The Australian east coast crop is a tale of two continents, with the bulk of NSW and QLD in a poor state, and Victoria/ East SA developing. The market is well and truly capturing the status of the crop, and the domestic market is pricing accordingly. This creates an issue of premiums being available (half full), but being unable to take advantage of them (half empty).
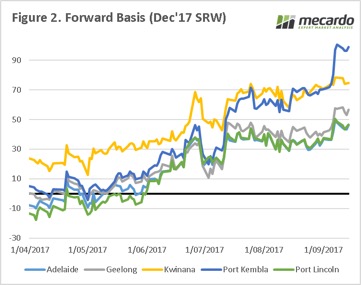 If a grower in Port Kembla had taken out a swap during the height of the July rally, then their overall price today would be >$370, which shows the value in strategic marketing using derivatives.
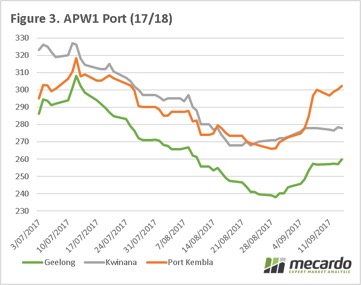 In the next week will we see the speculators continue to view the market as bearish, or will we start to see additional profit taking?
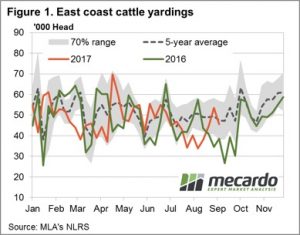
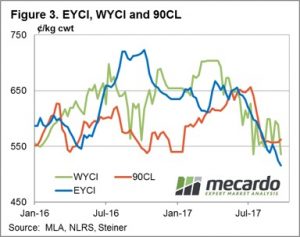
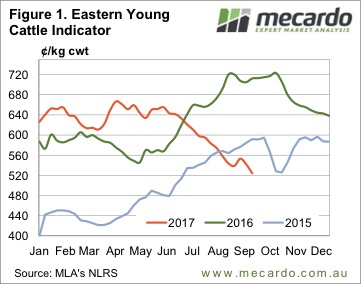 A couple of weeks ago we wrote in this column that the Eastern Young Cattle Indicator (EYCI), and cattle prices in general, might have found a floor. Turns out we were wrong. Figure 1 shows the EYCI falling below the spring lows of 2015, and heading towards 500¢.
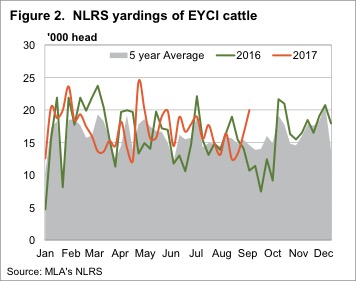 Over in WA the Western Young Cattle Indicator (WYCI) has also weakened, but only eased 6¢ to 589¢/kg cwt. Unlike the EYCI, which is sitting 26% below this time last year, the WYCI is just 4.7% lower, so things aren’t too bad for WA producers.
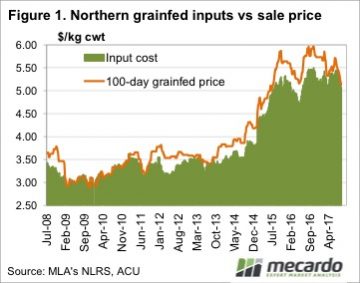 Grainfed cattle prices have fallen in line with the rest of the market, with the consistent decline putting pressure on lotfeeder margins. With pressure on lotfeeder margins comes lower feeder cattle prices, although, on a relative scale, they are performing ok.
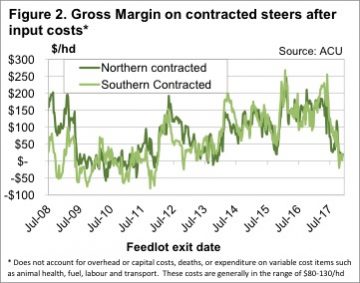 The situation is a bit different now, compared to 2009-2011. Back then cattle on feed numbers were low, with cattle going through feedlots at break-even to keep the doors open. Currently there are plenty of cattle on feed, and we have seen over the past couple of years that weak margins don’t last long.
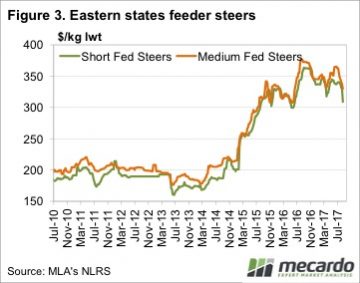 It’s not unusual to see tight feeder cattle supply causing low lotfeeder margins at this time of year. The question is what happen when supply improves in September and October. Under current grainfed cattle and grain prices, feeder prices will have to fall 20¢/kg lwt for lotfeeder margins to improve back to $100/head. Figure 2 shows that $100/head is more in line with recent history.
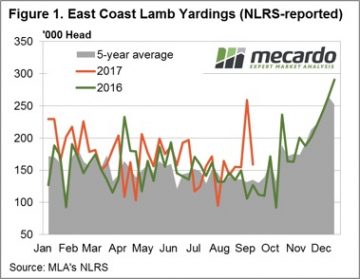 Mild price declines across the board noted for all categories of national saleyard lamb and sheep this week despite lower numbers at the saleyard. The headline Eastern States Trade Lamb Indicator (ESTLI) down 2.6% to close at 597¢/kg cwt, while National Mutton off just 1.2% to 400¢/kg as gains in NSW and Tasmanian mutton offset falls elsewhere.
  National saleyard lamb categories all softer this week with falls noted between 1-4%, Merino lamb leading the decline with a 3.8% drop to 539¢/kg cwt. National Trade and Heavy lambs the better performers, only down 1.8% (596¢) and 1.6% (601¢), respectively. The lower prices on the back of a reduced saleyard offering indicative of slightly weaker demand.
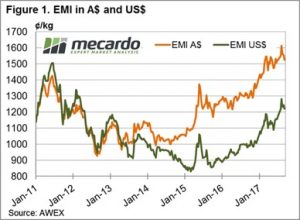
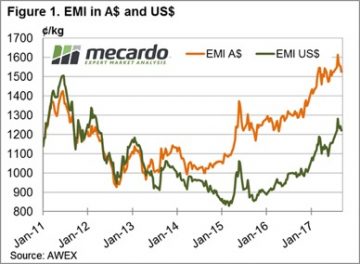 The Eastern Market Indicator dropped down 31 cents to 1,525 cents in A$ terms this week (Figure 1). The market in the west followed a similar path, falling 30 cents out to 1570 cents close (Figure 2). Our dollar is still holding up against the US$, which meant the EMI fared slightly better in US$ terms finishing 22 cents lower on the week at 1221 cents. The A$ traded at 80.5 early and pulled back as the week progressed which was reflected in the market as prices stabilised on the second day of auctions.
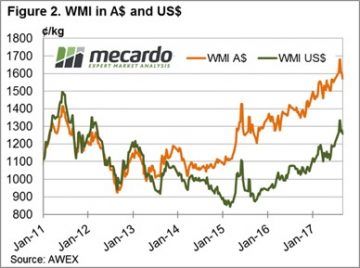 Merino skirtings and crossbred wools also felt a quick early blow in the market before stabilising on day 2. Recovery was slightly better than for Merinos, with losses of 15 to 30 cents for crossbreds and an average of 20 cents on skirtings. Cardings were the only category that managed a positive move by gaining just a few cents on the week.