Key points:
- Forecast global market share for Australian sheep meat exports are anticipated to increase into the next decade and outperform NZ exports.
- Global sheepmeat consumption is forecast to increase, particularly from developing nations.
- Increased demand for sheepmeat imports is anticipated from some of Australia’s key red meat importing nations over the next five years.
In our analysis piece earlier this week Angus pointed out that the recent period of high supply and firm prices point to stronger demand for Australian sheepmeat. This article takes a look at the OECD forecast for global sheepmeat consumption and demand out to 2026 to see where the opportunities exist for continued growth in demand for sheepmeat.
 Read the earlier analysis here.
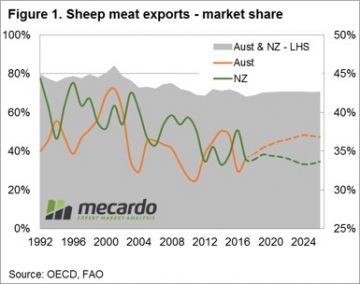
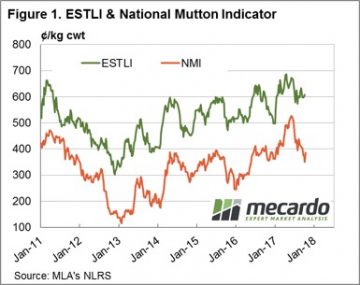
It is important to not that the OECD data provided by the United Nations Food and Agriculture Organization (FAO) includes goat as part of the global sheepmeat trade. Nevertheless, figure 1 highlights how large a share the combined New Zealand and Australian sheepmeat exports make up of total global exports, sitting reasonably stable at around 70% for much of the last decade.
The decline in the market share of NZ exports as a proportion of the total world exports since the early 1990s is reasonably evident, moving from 45% to 35% over the last three decades. Importantly, anticipated increases in production and exports in Australia over the next decade will see us wrestle a greater degree of market share away from NZ, such that by 2026 Australia will hold 36.9% of the global trade compared to New Zealand’s 33.6%.
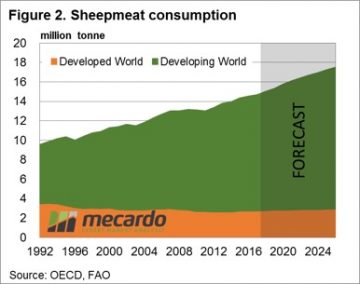 Turning to global consumption levels we can see that the majority of growth has been, and is expected to continue, coming predominantly from the developing world – figure 2. While sheepmeat consumption levels can be satisfied partially by domestic production the fact remains that for many countries their consumption will outweigh their production and the need to import sheepmeat will be required to satisfy the demand. This is important, particularly in relation to non-goat sheepmeat as the only two significant global exporters of sheep and lamb product are NZ and Australia.
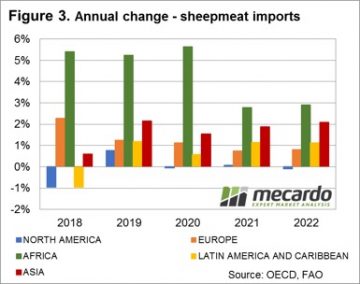
Figure 3 outlines the FAO forecast annual growth in sheepmeat imports by geographic region for the next five years and it shows significant growth in demand forecast for Africa, although from an Australian and NZ sheepmeat producer perspective this isn’t the key focus as much of this will be for goat. What is significant is the growth levels forecast for the Asian region. Although the year on year increases in growth are lower than Africa, Asia accounts for around 65% of the total global sheepmeat imports each year so the volumes going there are significant.
What does this mean?
 Further analysis of the breakdown of the forecast Asian sheepmeat import flows shows that much of the growth is anticipated to come from China, Malaysia, Saudi Arabia, Indonesia, and Vietnam. These are already key export destinations for our red meat products and strong trade ties already exist between Australia and these nations.
Given the forecast decline in market share for NZ sheepmeat exports, it places Australia in the prime position to capitalise on a growing population and burgeoning middle class in these nations and points to robust demand and relatively firm sheepmeat prices for years to come.
 Despite the beginnings of Spring flush being fairly evident at the saleyard this week, prices managed to gain across all categories of national lamb and sheep markets. Seemingly, a Friday the 13th close to the week a lucky one for ovines.
 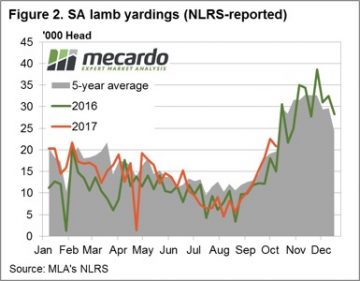 The firm prices were unable to be weighed down by increased volumes at the saleyard along the East Coast for both lamb and mutton with throughput levels up 2.1% and 28.5%, respectively. The lamb yarding pattern for SA and Victoria continuing to show evidence that the seasonal Spring flush is underway with both states continuing to trend above the 2016 trend, and higher than the long term average for this time of the year – figures 2 and 3.
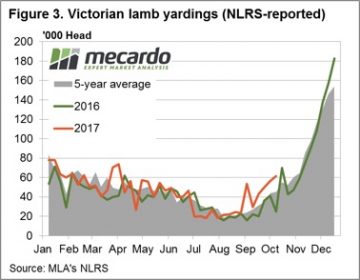
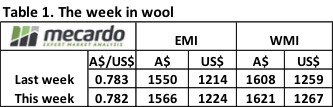 The continued good news regarding the wool market is providing a positive setting for wool producers; with some now locking in prices for future clips and making decisions to expand production. A quick look at relative prices shows the EMI is 248 cents higher year-on-year, while in US$ terms it is up 231 cents.
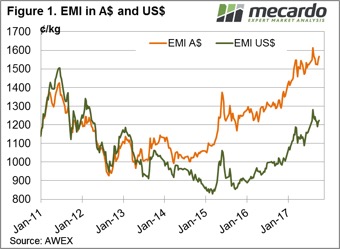 This week the market opened strongly on Wednesday then settled into a “firm” trend resulting in a good result for sellers; and they responded by only Passing-in 3.3% of the 38,103 bales offered- well below the season average of 7.3%.
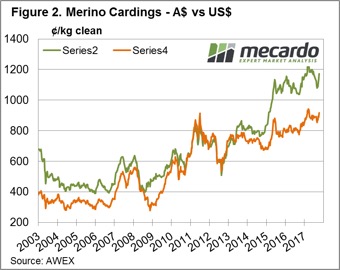 The scramble for “low mid break” lots resulted in these types at times posting extreme prices. AWEX report that up to 70 cent premiums are evident for wool with the “right” specifications. This is a response to the
 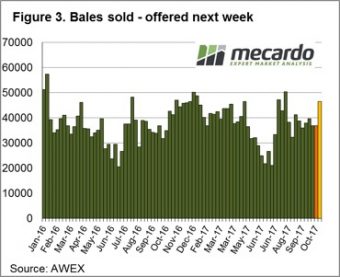 Despite an increasing offering that is normal as Spring shearing clips arrive, it is difficult to see anything but positive times (at least in the short term) for wool.
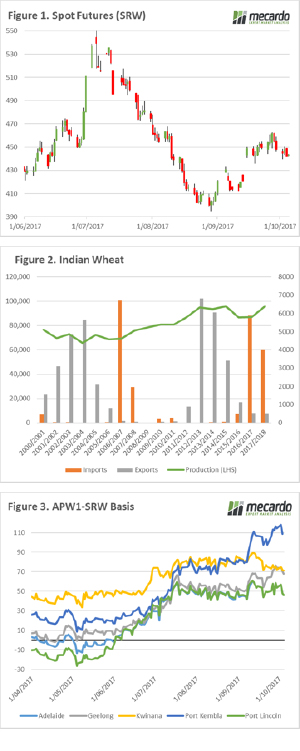 Futures markets edged lower this week, but were balanced by a fall in the Aussie dollar. In this week’s comment, we look at rumours of increased import duties in India, and local premiums over Chicago futures.
 Lamb prices have defied the odds to remain relatively steady for the fifth week straight. It’s highly unusual for prices to trade in such a narrow range for so long, and there is no doubt they will break out at some stage. Mutton prices haven’t had the same luxury, continuing to slide this week in spite of weather forecasts.
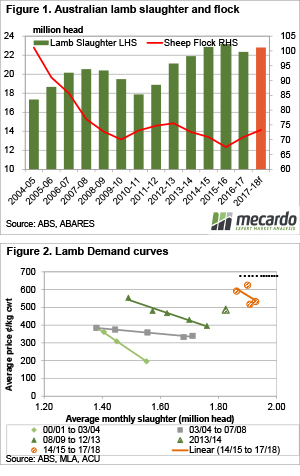 The Australian Bureau of Agricultural and Resource Economics (ABARES) have put out their quarterly Agricultural Commodities Report, and amongst the numbers there were some interesting sheep and lamb forecasts. This week we take a look at whether lamb prices can achieve another year on year increase, as predicted by ABARES.
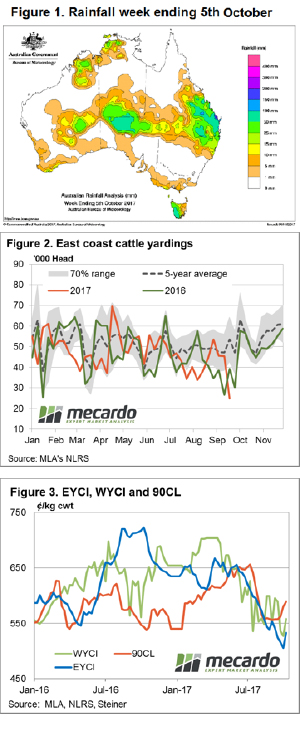 The Mecardo team have been suggesting a price bounce was imminent for the last few weeks given the rainfall forecast, recovery in export prices and falling supply at the saleyards. But as the old trading adage goes, “even a broken clock gets it right twice a day” so we won’t puff out our chests too much on this one.
 The “steady as she goes” reports on the wool market activity over recent weeks were thrown out the door at this week’s 2 day wool sale, with the market lifting significantly led by the Merino and including Cardings sections.
 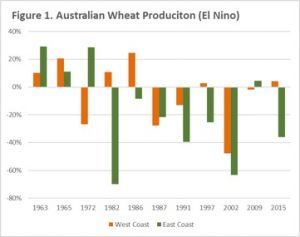 The US Climate Prediction Centre, is currently on La Niña watch with an increased likelihood of the little sister to El Niño occurring before the end of the year, and into 2018. This can have very positive results for Australian grain growers, in this analysis we look at how we may benefit.
 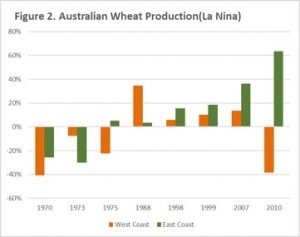 In figure 1, we see the year-on-year impact of El Niño split into east coast and west coast. In the period 1960-2015, 7 of 11 El Niño years have recorded a reduction in wheat production, with 6 of these years recording a > 20% reduction. In Western Australia the impact of El Niño has been less negative, with 6 out 11 event years recording an increase. However, only two of these years record > 20% increase. In addition, during the years of production decline, 3 of these years recorded large production falls of > 20%.
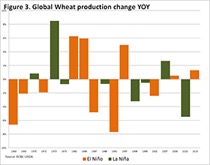 At present, the market is not yet overly concerned with La Niña. However, it does have the potential to impact greatly on the US crop through drier weather and eastern Australia through wetter than average conditions. If La Niña starts to impact on the US crop production, then we are likely to see risk premiums emerge in US futures markets, which will flow on to our own prices.
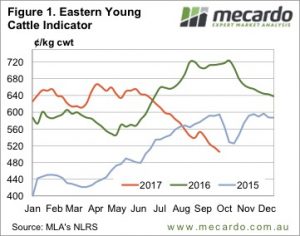 It was only in mid-July that the Eastern Young Cattle Indicator (EYCI) broke through 600¢. The downward spiral now has the EYCI looking down the barrel of a number with a four in the front. There has finally been some positive news on the climatic front, however, which could and should provide some support, if it eventuates.
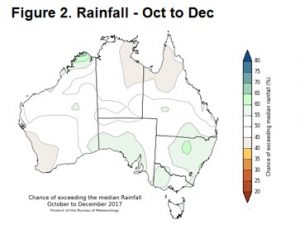 It was feeder steers which managed to defy the trend this week, gaining 8 and 7¢ in NSW and Victoria respectively, to move back to 286 and 283¢/kg lwt. It was trade steers that drove the EYCI lower.