Month: May 2018

Cows rising against the young cattle trend

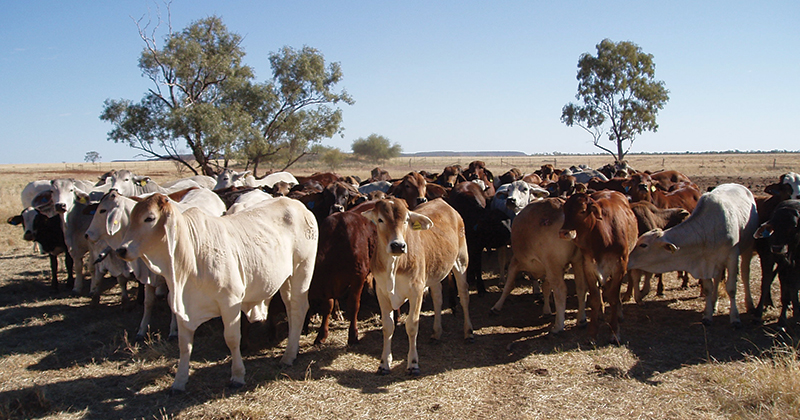
After a brief respite in the downward trend, young cattle prices continued their drift lower this week.  With grain prices on the up, hay in short supply and more depressing forecasts it is no surprise that sellers are taking advantage of what are relatively strong prices.

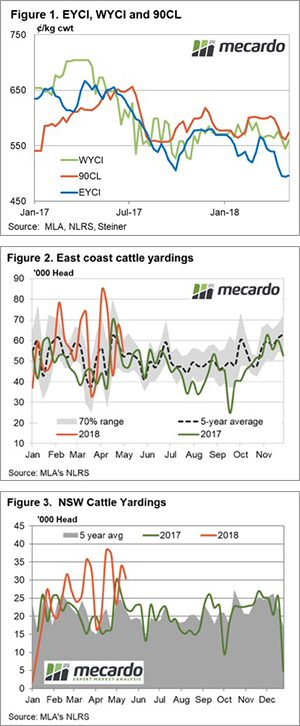
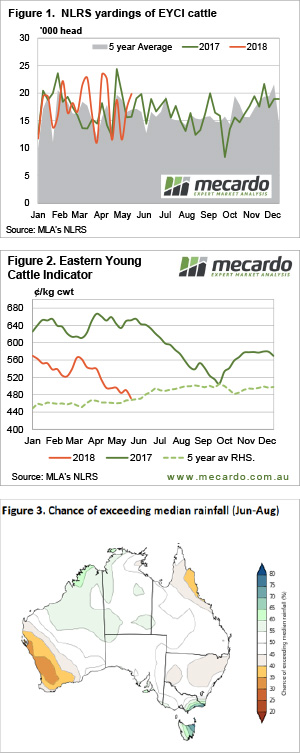
Young cattle yardings moved to a five week high this week, with EYCI saleyards selling 19,854 head (figure 1). The result of stronger yardings was a fall in price, the EYCI lost another 18¢ to hit a new three year low of 472¢/kg cwt (figure 2).

The lower prices were largely driven by restocker supply increasing and demand weakening. The NSW Restocker Steer Indicator hit 252¢/kg lwt this week, 24¢ below the feeder indicator and 19¢ off the Heavy Steer. There are plenty of little light weaners on the market at the moment, and buyers aren’t exactly lining up.

There was one shining light  Medium Cows in saleyards gained ground in Victoria, NSW and Queensland, pushing the National Indicator 13¢ higher to 370¢/kg, cwt a six week high.

In WA markets are stronger than on the east coast, with the WYCI sitting at 536¢/kg cwt and Cow prices at around 400¢.

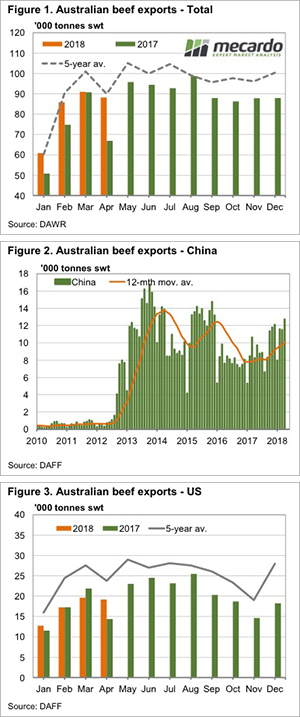
Export prices were steady to slightly weaker this week, the strength in the Aussie dollar saw the 90CL Frozen Cow fall 1¢ to 586.5¢/kg cwt. If it does ever rain the market will have some catching up to do.

The week ahead

There is some more rain forecast for Victoria and the border with NSW this over the coming week. While not enough to constitute a break it might be a start when added to last week’s rain, and importantly, if there is more to come.

The three month forecast is not all that positive for dry parts of NSW, and looks dire for WA. For east coast values to rally, somewhere near median rainfall would be needed over the winter in northern NSW, and there is a 40% chance of that. In WA, there is only 25-40% change of median rainfall, which will raise concerns for grass and grain supplies in the West over the coming year.

Prices succumb to elevated supply

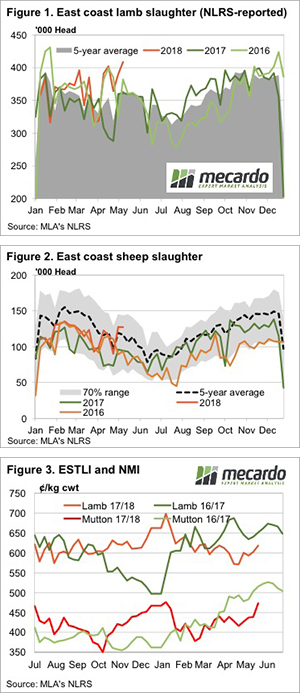
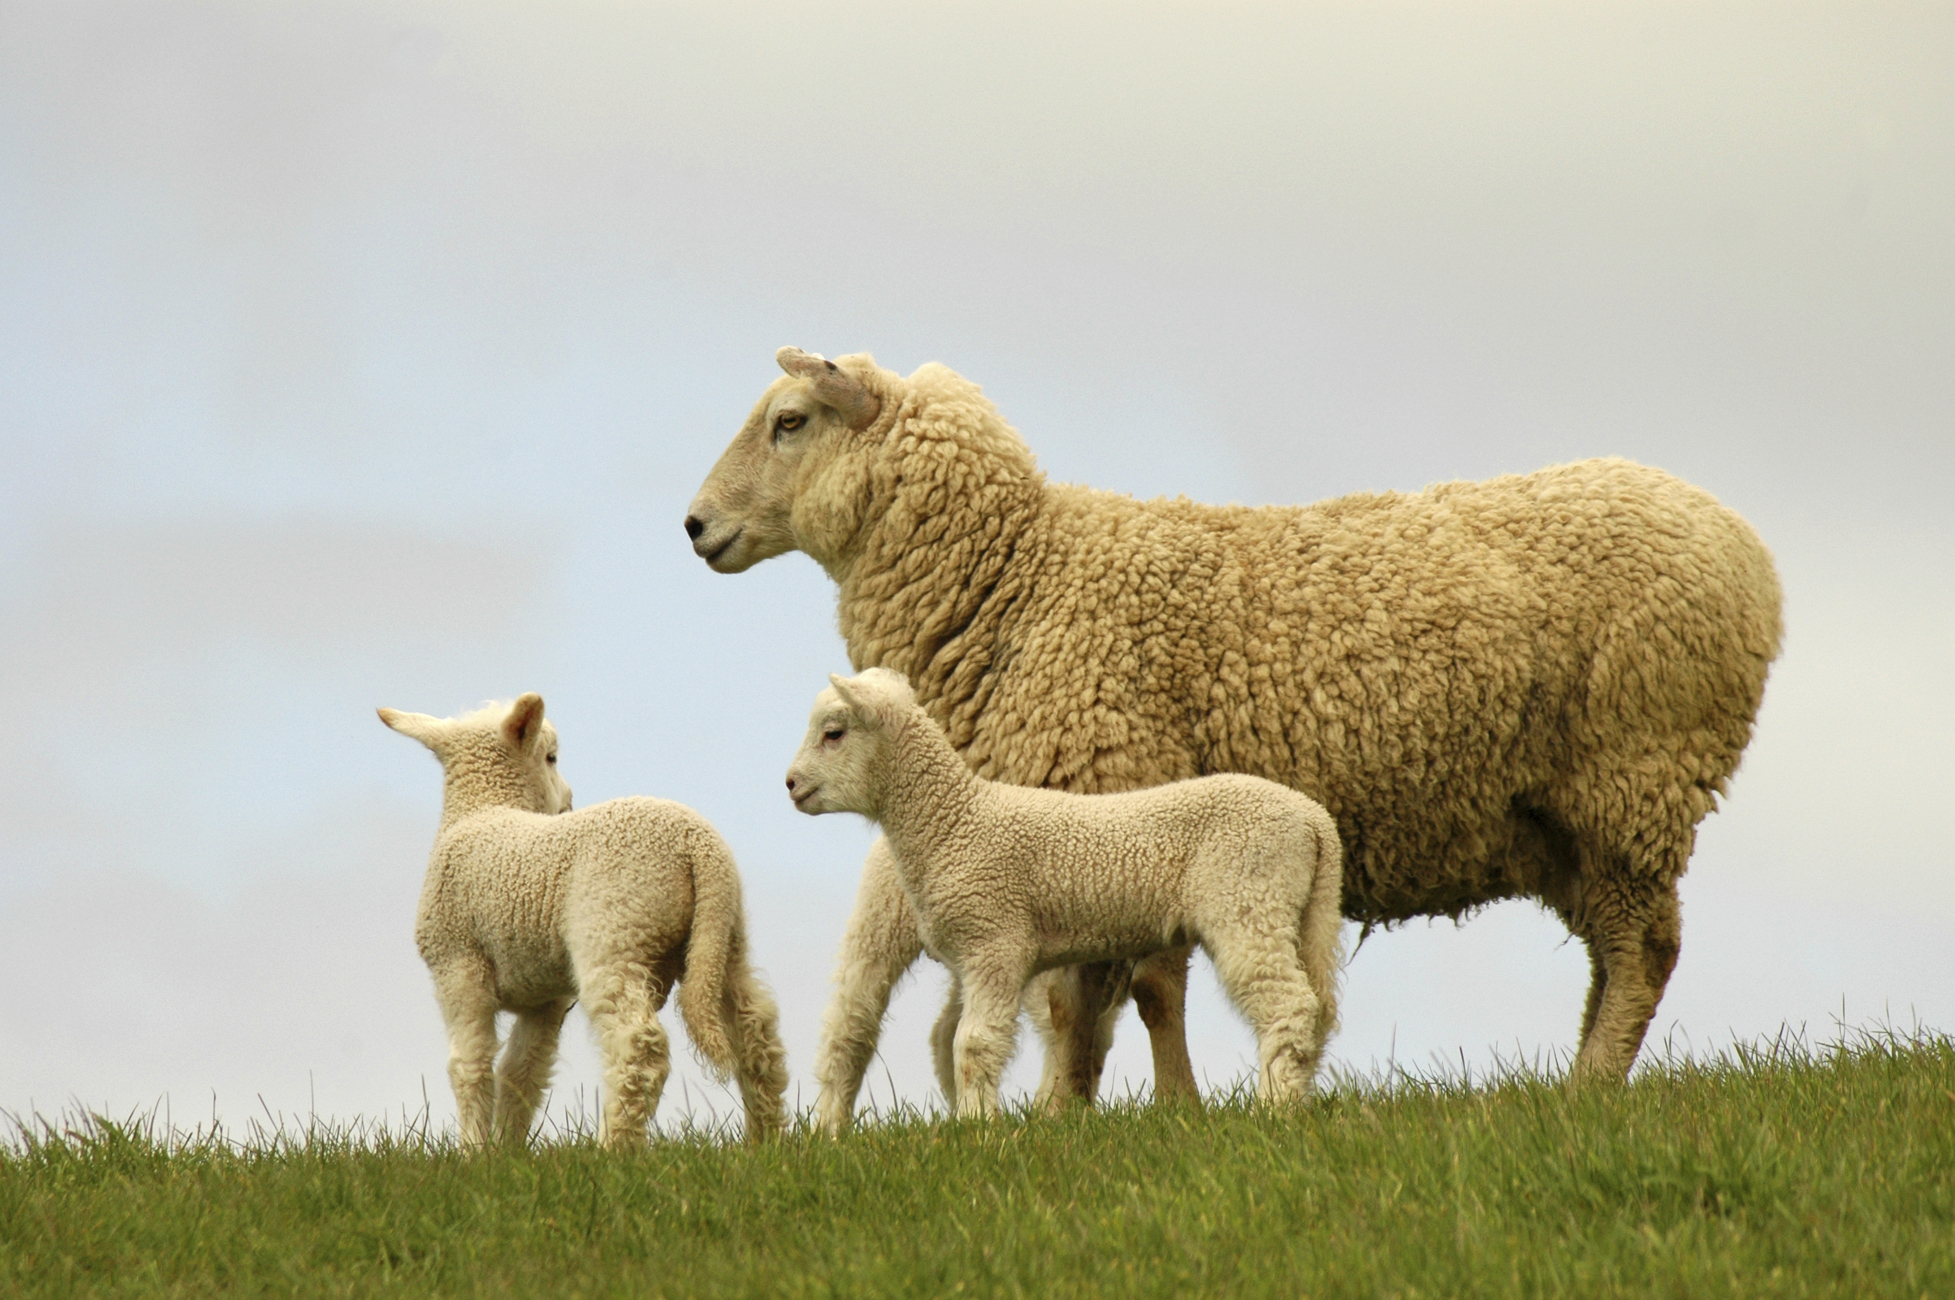
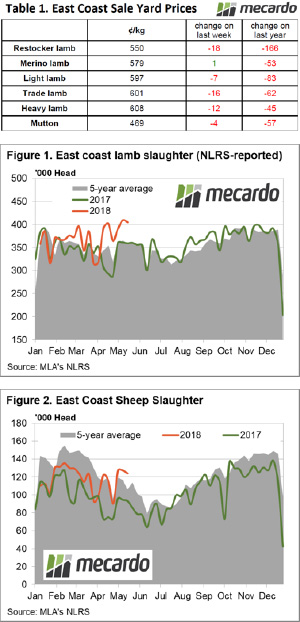
In the commentary last week, we noted that demand for lamb and sheep was keeping sale yard prices supported. Alas, it seems that supply has got the upper hand this week with East coast prices broadly softer. The Eastern States Trade Lamb Indicator (ESTLI) off 2.5% to 601¢/kg cwt and East Coast Mutton shaved off 1% to close at 469¢/kg cwt.

Table 1 outlines the price movements at the East coast sale yards, with Merino Lamb the only category to hold its ground this week. A booming wool price is helping to keep them in favour – perhaps. Restocker Lambs are feeling the weight of the extended dry Autumn, particularly in NSW, posting the greatest decline to see it off 3.1% to 550¢/kg cwt.

State based sale yard indicators for Restocker Lambs are clearly identifying NSW as the key culprit in dragging down the East coast indicator with NSW Restocker Lambs off 10.1% in mid-week sales to see them hit 542¢/kg cwt.

The seasonal pattern for East coast lamb slaughter is continuing to hold above 400,000 head – Figure 1.  Average lamb slaughter levels for the last month across the East coast are trending 12% above the five-year seasonal average and 14.5% higher than over the same period last season. The persistent elevated supply is getting the upper hand this week to act as a headwind on prices. A similar story for mutton, with East coast slaughter levels for the last month 7.1% higher than the seasonal average and 31.4% above the same time frame in 2017 – Figure 2.

What does it mean/next week?:

The most widespread rainfall for the last month or so is forecast to hit the south of the country in the upcoming week, with some decent falls noted for the West Australian coast. Victoria and Tasmania continue to receive some reasonable falls but NSW still yet to benefit in earnest, with most regions in NSW lucky to get 10mm.

It’s hard to see prices gain too much traction with supply remaining so elevated, and the rainfall forecast isn’t providing a great deal of confidence that supply can ease. This suggests sideways price action to continue this week with a slight downward bias evident.

Where are the winter lambs coming from?

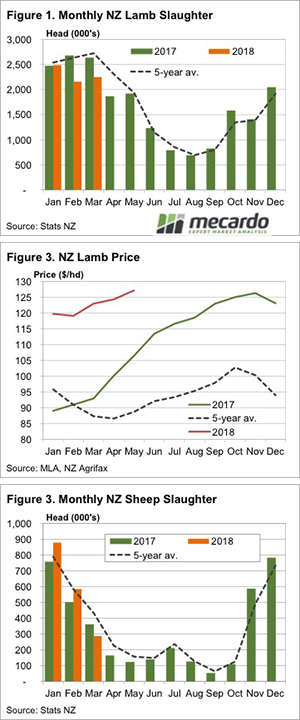
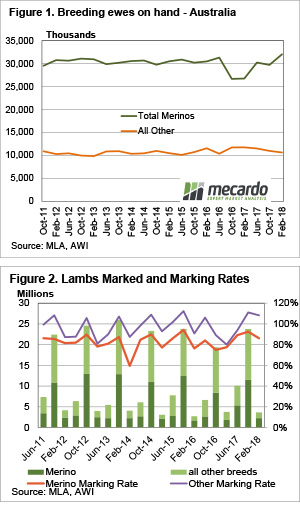
Winter officially arrives next week, and with it, we expect lamb slaughter to decline from recent record highs. Traditionally lamb supply throughout the winter is sustained by the last of the old season lambs, and the arrival of new season spring lambs out of NSW in the second half of July.  With the dry continuing, we ask whether these lambs will finished on time, and whether they’ll be there at all.

Lamb supply has been exceptionally strong so far this year, and we know that it has been a factor of fewer lambs being killed at the end of last year and dry weather forcing some sales. We know that NSW becomes the major supplier as we move into winter. But as the dry in NSW continues, and grain prices rise, there is some doubt as to the number and condition of winter lambs.

Meat & Livestock Australia (MLA) have released the February MLA and AWI Wool and Sheepmeat Survey Report with little fanfare, and it gives us a few clues.

Firstly, the data in the Wool and Sheepmeat survey appears to be quite volatile. This is likely due to the number of sheep producers filling out the survey being around 10% of the total number of producers. It’s a good sample, but results can move around depending on who has time to do the survey.

The survey does show some interesting trends. Figure 1 shows the number of breeding ewes on hand for both Merino and ‘Other’. According to survey results, the Merino Ewe flock hit a seven year high in February, with just under 32 million head roaming Australia. This is a 19.7% increase on February last year, which seems a little over the top.

They do split the Merino flock into those joined back to Merinos, and those joined to ‘other’ rams. 22.1 million head (up 24% year on year) are to be joined to Merinos, and 9.8 million (up 10.4%) to be joined to other.

The ‘other’ ewe flock, which consists mainly of breeds used for lamb production, is down 9.4% on February 2017. The total number of ewes (Merinos and Other) on hand, as of February, to be joined to a breed other than Merino is down 1% on last year.

This tells us that there should be a lot more Merino lambs born this year, more first cross lambs, and less ‘other’ lambs.

The survey data on lambs born from November to February somewhat confirms the ewe data. November to February is the smallest lamb marking period, but it’s still worth looking at the data.  There were apparently 3% fewer lambs marked over summer (figure 2) compared to last year, but Merinos were up a massive 21% to 2.25 million head, and ‘other’ down even more, 27% lower at 1.04 million head. Around half the lambs marked from November to February were Merinos in NSW.

What does it mean/next week?

If we consider that there were apparently fewer ‘other’ lambs marked over summer, is suggests lamb supply at this time of year should be waning. Last week we concluded that a lot of NSW is likely to have been grainfed, so some of these lambs might have exited the system already.

More importantly, there are fewer ‘other’ ewes to producer the early new season spring lambs which appear in saleyards in July. These lambs would have been born in March and April on little feed, which doesn’t bode well for survival or growth rates. It suggests fewer and lighter lambs to fill the June, July and August supply void.

What’s on offer? Record prices but not much wool

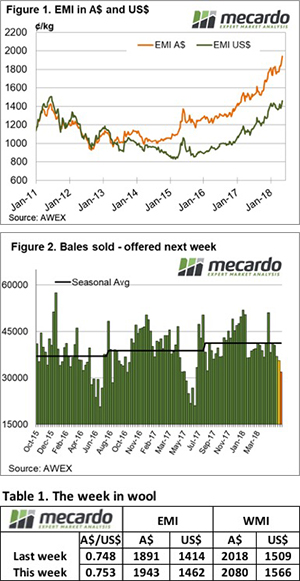
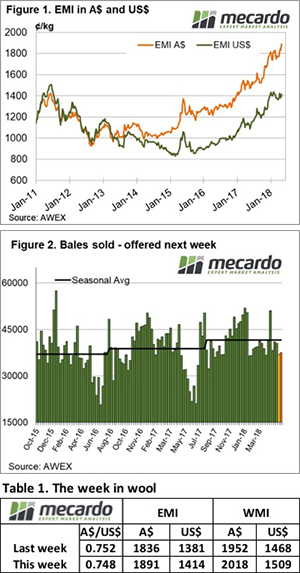
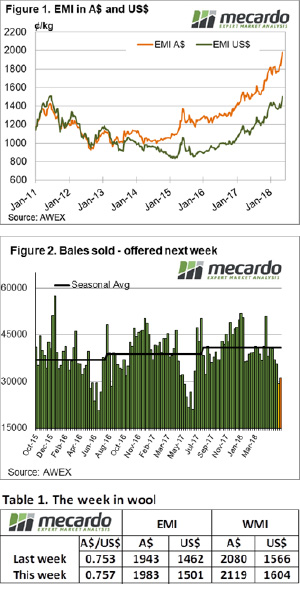
Another week, another record. The wool market was again lit up with green across the board. But where one wins, one must loose. We’re seeing the effects of what has been a remarkably strong season play out on supply, and this means buyers are having to fight it out.

This weeks offering was a hefty 6,310 bales lower than last week, with just 30,053 offered to the trade. At a pass in rate of 2.2%, this meant 29,392 bales were cleared. AWEX reported that lower yielding, lesser style wools were again prominent. Despite this, buyers were willing to pay up to secure stock, indicating an air of nervousness about the levels of supply.

The Eastern Market Indicator (EMI) gained 20 cents on the first day of selling, and lifted a further 19 cents on Thursday to close at 1893 in Au$. Smashing last week’s record to an all new high. Records appear to be the new norm for the wool market. The weeks rise was on par in US$ terms, increasing 39 cents to hit 1,501 cents (Figure 1). This was supported by a stronger Australian dollar, trading at US$0.757.

There was little variation in the market movements between microns this week. 50 to 80 cent increases were typical for 17 to 22-micron wools in Sydney and Melbourne, although fine wools were the stand out performer in Melbourne this week with gains up to 90 cents.

The Western Market Indicator (WMI) rose 39 cents on the week to 2119 cents.

Merino skirtings made an improvement on the week as well. Well-formed lines received gains of 60 cents. Cardings had a strong week as well with the indicators up on average 30 cents.

Crossbreds were the only category that failed to see prices increase all round. While the 26 micron rose 42 cents on the week, 28 and 30 micron fibres fell back in the range of 5 to 10 cents.

The week ahead

The roster for the next few weeks points to the offering remaining thin. Next week just 31,336 is on offer, while the following week, a skimpy 25,119. This is well under the offering during the same weeks last season.

If this week’s bullish market, driven by buyer uncertainty is an indication of how the market is feeling, we could certainly see it reach higher levels in the coming weeks.

Thank NZ for strong export lamb demand

We recently had a query as to whether there was much seasonality in New Zealand lamb slaughter.  We have covered this before, but given New Zealand are our only major competitor in lamb export markets, it’s worth another look.

Australian lamb slaughter has some seasonality, with the five year average low month, July, coming in 18% lower than the peak in October.  In New Zealand they have real seasonality.  The lowest slaughter month of August is 75% lower than the peak in March.  That is, a quarter the number of lambs are slaughtered in August, than are slaughtered in March.

Figure 1 shows that January to March slaughter is usually very strong.  To put NZ into perspective, their January to March slaughter averages over 2.5 million head.  Australia’s highest slaughter month on record in 2.2 million head.

As well as illustrating annual seasonality, figure 1 gives us some idea as to why export demand for lamb has been strong this summer and autumn.  The falling NZ sheep flock and lamb crop has seen a heavy fall in lamb slaughter.  While January slaughter was similar to last year, February and March were down 19 and 14% respectively.

Lower lamb supply out of New Zealand simply means that prices are going to be higher there, which can see demand shift to Australia.  Heavy Australian slaughter has helped fill the hole left by New Zealand.

Lower slaughter has seen record lamb prices in New Zealand.  Figure 2 shows lamb prices for 17.5 kgs cwt lambs in NZ has been rising to record levels at a time of year when they normally hit their seasonal lows. Over the first five months of 2018 lamb prices have averaged 24% higher than 2017.

Sheep slaughter shows similar, but more pronounced seasonality in New Zealand.  Figure 3 shows monthly sheep slaughter.  The peak month of January is eight times larger than the lows of September.

What does it mean/next week?:

It seems whenever we look at New Zealand sheep and lamb its positive for our market.  In the short term we can expect export demand for Australian lamb to remain strong as New Zealand slaughter enters its seasonal decline.

Lower lamb slaughter this year might indicate the start of a flock rebuild, which in the medium term is negative for export demand.  Sheep slaughter has been stronger, which might will put a dampener of the flock rebuild, especially as there were supposedly fewer lambs born last year.

The curious case of rising slaughter and prices.

Regular readers will no doubt be aware that we like to base our analysis in basic economic theory.  Supply, demand, price, that sort of thing.  It also piques the interest when a market behaves in a way contrary to the normal rules, and we’ve seen a bit of that this week.

Rain in South East South Australia and Victoria has seen lamb and sheep markets rally this week on the east coast.  So we went looking for the ‘smoking gun’, which is usually declining supply.  But we couldn’t find it.

Admittedly we were frustrated by the week old yarding data, so we turned to slaughter.  Also a week old but usually less volatile.  Wheat we found was that rather than seeing a declining trend in lamb and sheep slaughter, we found lamb slaughter parked at an all-time high for May.  In fact, there have only been 3 weeks in history when lamb slaughter has been higher, all of them in 2006 (figure 1).

So it must be sheep which are in tight supply, opening up space for more lambs.  Where is that sheep with the smoking gun?  Nowhere to be found.  While sheep slaughter (figure 2) is within the historical range, it was 35% higher than 2016 and 2017 last week, and the week before.

It was demand.  Despite producing very large amounts of sheepmeat, demand continues to push prices higher especially for mutton (figure 3), which is nearing a 12 month high in Victoria and NSW.

The week ahead

There is no real rain on the 8 day forecast, so we might expect the flow of sheep and lambs out of NSW to continue.  At least they are getting good prices for them.  Well finished lamb supply is likely to wane, however, which might help push the ESTLI back toward the highs of last year.  If it does ever rain it’s going to be interesting.  It might be a case of the irresistible force (demand) meeting the immovable object (growers trying to maintain flocks).

And the wool market marches on.

The wool market set another record this week, it is looking settled at these previously un-attained price levels. Probably another record was set when wool producers in the Sydney catalogue sold 99.9% of bales offered in the first day. Growers are enjoying this market!

After last week clearing 40,000 bales, this week only 35556 bales were cleared to the trade, from a total offering of 36398 bales. The impact on the market was significant, with the Eastern Market Indicator (EMI) lifting by 21 cents on the first selling day and a further 31 cents on Thursday to see it close for the week at 1943 cents, while in US$ terms the EMI found an additional 49 cents to settle at 1462 cents (Figure 1).

The AU$ was slightly stronger to settle at $0.75, while the Western Market Indicator (WMI) gained 62-cents to 2080 cents.

Many of the MPG’s only started in 2011, so comparisons of the market are often made from this date. Currently, all indicators 28MPG and finer are at their record high levels since 2011. This is a remark able market.

Merino skirtings posted improved levels each day and closed the week on a very solid note.

Merino Cardings had another good week, all centres showing stronger prices with an average lift of 22 cents.

The week ahead

Next week fewer than 32,000 bales are offered, a decrease on this week’s sales.

The large clearance in the first week after Easter provided an insight into the current demand and this has certainly carried through in subsequent weeks. It must be keeping exporters awake, will the make continue to rise, consolidate at current levels or retreat after consecutive increases.

Southern rain provides limited relief

The beginnings of the Autumn break in the South has placed a floor under cattle prices during the last week with the Eastern Young Cattle Indicator (EYCI) gaining 1.3% to sit just below 490.5¢/kg cwt. Victoria has received some good rain in recent days but the benefit of this change in weather has not been able to extend further North into NSW.

Across the national sale yards most categories of cattle have gained value. The National Trade Steer indicator increased 3% to see it sitting at 284¢/kg live weight, although outclassed by Medium Cows that managed a 5% rally on the week to 357¢/kg live weight. National Heavy Steers one of the few classes of cattle to soften this week albeit marginally, staging a drop of 1% to 267¢/kg live weight.

East coast cattle yardings are 20% softer week on week, reflective of the improved conditions in the South – Figure 2. NLRS report East coast cattle yarding levels of 54,360 head which now sit comfortably within the normal seasonal range for this time in the year and is only 3.6% above the five-year seasonal average.

However, NSW is yet to benefit from the recent rains in any meaningful manner and cattle prices will struggle to gain significant traction while it remains dry here and NSW cattle yardings remain elevated. Figure 3 outlines the recent pattern in NSW cattle yarding with current throughput levels 40% higher than the five-year seasonal average and 37% above the level set this time last season.

What does it mean/next week?

The rainfall forecast for the next week shows light falls are set to continue in Victoria and along the Eastern seaboard of Northern Queensland. Unfortunately, the rest of the country (and sadly NSW) miss out again.

It’s difficult to see a decent mid-Autumn rally in cattle prices beginning while it remains so dry in much of the country. Further sideways price consolidation is anticipated for the week ahead, despite improving beef export prices offshore.

Basis on the rise

The weather continues to be the biggest driver of the market both globally and now increasingly at a local level. The Australian crop is currently on the precipice, with a huge degree of risk currently being priced in. In this weekly comment, I take a look at the weather forecast and basis levels.

Figure 1 displays the December wheat futures contract since the start of the year. This contract aligns with the Australian harvest and is typically the most appropriate for hedging purposes (for producers). As we can see much of the gains of early May have been lost. At it’s highest point in May the December contract was at A$279/mt, although in recent days the market has gained some traction, the current level of A$261/mt is not an insubstantial fall. The market however is prone to volatile behavior at this point of the year, and large market swings can potentially occur.

Our biggest concern for both grain producers and consumers in Australia, are the local conditions. The BOM released their rainfall forecasts for June to August (see map). This map details the change of above median rainfall. Our concerns are growing for the majority of the wheatbelt, but especially NSW and WA. Our hope is that the forecasts are wrong, and that a deluge is imminent.

Let’s take a look at basis levels (Aussie premium or discount over CBOT). As we all know, our basis level will increase when weather conditions deteriorate. In figure 2, the spot (old crop) basis is show, as we can see the basis level has increased dramatically in the past week. This is as a result of both the weather premium, and demand for the shrinking stockpile of old crop, especially in northern feed demand areas.

In figure 3, the new crop APW1 MG basis is displayed. The basis level has increased to it’s highest point this season. Although there is still a long way to go before harvest, if weather conditions remain dire, then this basis level will increase. This will provide minimum solace, as high prices and poor yield is a poor outcome for everyone.

If you are interested, I was asked to give a summary of the market to the Sky News Ag Show. The video is on the link below. However, please note I am not a seasoned TV personality!

https://www.weeklytimesnow.com.au/agribusiness/the-ag-show/the-ag-show-featuring-auctionsplus-chief-executive-anna-speer/news-story/6c3256aef5e4a96b32a6b6ecb1709280

What does it mean/next week?:

Let’s just keep an eye on the weather. Although cash prices are currently high, it is prudent to think strongly about physical risk, and washouts at present.

All systems go for the wool market

The wool market bounced out of the blocks this week, from outset the buyers were forced to compete vigorously to secure any volume. A weaker Au$ assisted but there was no denying the urgency of the buyers as they bid up.

The Fremantle market got a mention last week, and the positive sentiment it left on the previous weeks market certainly carried through to the open of this week.

With a smaller offering compared to last week of 42,794 bales, the Eastern Market Indicator (EMI) gained 55 cents to 1891 cents, while in US$ terms the EMI was up 33 cents over the week to settle at 1414 cents (Figure 1). In the Fremantle sales, the Western Market Indicator (WMI) rallied 45 cents on the opening day and a further 21 cents on Thursday to end the week at 2018 cents. This easily surpassed the previous record of 1965 cents.

The AU$ was softer, trading around the US$0.748 mark, slipping below the US$0.75 cent support mark.

In line with the stronger market in general, the pass in rate fell to 2.3%. Growers and brokers stepped up and delivered to a strong market resulting in 37,842 bales eventually sold, with only 886 bales passed-in.

Crossbreds also posted gains although more restrained than the rest of the market, while the cardings also felt the increase in the general market and lifted.

Skirtings were reported extreme for selected lots, with reports of 40 to 50 rises at the open which carried through the week.

With just over 36,956 bales sold this week, (season’s average 41,541) we expect supply will continue to be front and centre in buyer’s minds. There are 37,496 bales rostered for next week, however the roster falls to an average of 34,793 bales for the following weeks.

The week ahead

The demand looks solid, supply is tight and getting tighter and the currency looks like it wants to help also. This all points to a positive short-term outlook for wool.

We can only repeat last week’s outlook, this is a good time to be selling wool and it looks like the market still wants to improve.