Month: July 2018

Wool closes on a solid footing.

The wool market has now closed for the annual 3-week winter recess, and all industry players would have been pleased with the final sales.

A solid and well supported market leading into a break provides all with confidence, especially wool exporters travelling overseas to visit mills and set in place plans for a new season supply.

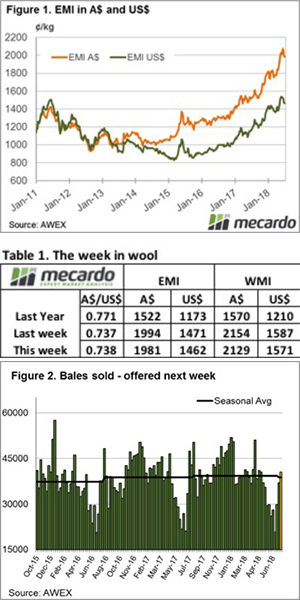
The Eastern Market Indicator gave up 13 cents over the week to settle at 1,981 cents AU$ terms (Figure 1).

The EMI was also weaker in US$ terms although not to the same scale as in Au$ terms, closing at 1,462 US cents, down 9 on the week.

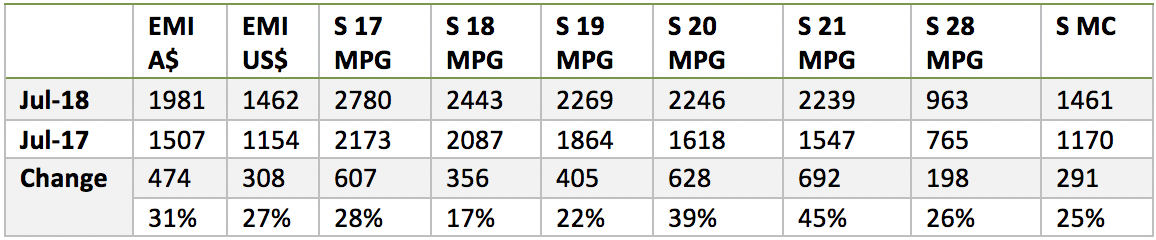
Comparing the wool market performance over the season, a 31% lift for the EMI is an excellent result. The bulk of the clip now sits in the 18 to 19 MPG range, and this area showed the least gains at 17 & 22% respectively, while 20 & 21 MPG which has seen continued decline in supply performed best.

Again, sellers exercised restraint, with 11.2% passed in on Wednesday and a further 5.3% on Thursday for a total of 8.5% over the week. Still a significant pass-in rate given the level of the market but well back on the double-digit figures of last week.

An offering of 40,544 bales resulted in 37,095 bales sold, well above the 27,000 averages for June but in line with the season average of 39,000 per week.

The first day saw a continuation of the softer trend of last week before a recovery on Thursday with Fremantle off the market. This was especially evident in the 19 and broader types, all quoted dearer, with the finer types fully firm although 16 & 17 MPG were irregular.

Crossbreds also finished on a solid note; with AWEX noting that better prepared lots sold best. This is now a feature of this market where poorly prepared or unskirted lots are not well regraded and buyers are selective.

Merino Skirtings eased in line with fleece wool, however lines containing >5% VM again were not keenly sought.

Merino Cardings also eased with the Cardings Indicator in Sydney – 17, Melbourne – 29 and -21 in Fremantle.

USDA Day

A relatively downbeat week in the grain trade, with the world watching and waiting for the next big driver of pricing. The big data release for the week was the USDA world agriculture supply and demand estimates.

There has been a high degree of volatility in the past week as traders scope for telltale signs of weather impacted yields in the northern hemisphere. The market has recovered A$5 overnight, but week on week the wheat futures market is down 6% or A$14 on the spot contract (Figure 1).

The July USDA report was released overnight. The report called major reductions for wheat production around the world. The global end stocks for the coming season were dropped to 250mmt, the lowest since 2016/17 (Figure 2).

The USDA has lowered consumption of wheat by 2.3mmt, however, this was more than offset by falls in production. Dry conditions around major crop growing regions are the driver of this downward movement in Australia (-2mmt), EU (-4.4mmt), Russia (-1.5mmt), Ukraine (-1mmt).

This report was generally bullish in nature and points towards a tightening global wheat market. Although global wheat stocks will still be the second highest on record, production by the main exporting nations is slipping.

What does it mean/next week?:

This week will see more certainty as the northern hemisphere harvest progresses. There are a few tenders in the next few days which will give some indication of pricing signals.

Locally in Australia VIC, SA & WA are forecast to receive reasonable rainfall events in the next eight days. It however, looks like NSW is set to miss out.

We continue to live in interesting times

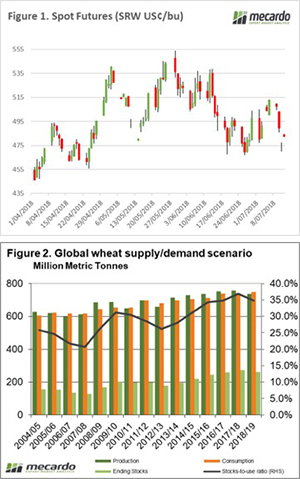
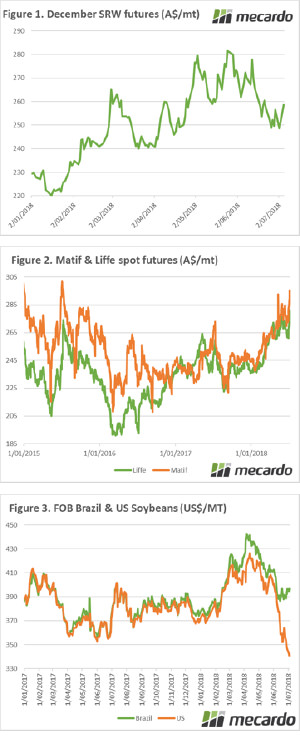
It is going to be a very interesting fortnight. All the major factors which impact grain pricing are likely to come into play, adding volatility. In this weekly update, we take a look at the two big uncertainties – geopolitics and European downgrades.

The US futures markets were closed for the 4th July celebrations. When they opened, they have done so with a bang. The December SRW futures contract is up 3% overnight or A$7/mt (Figure 1). This puts us back to slightly above the end of last week.

The rise can be attributed to the dry weather conditions in western Europe. The run of hot weather and poor rainfall has resulted in downgrades in Germany and France. The German crop was yesterday lowered to 41mt, the smallest since 2007 (and 9% lower year on year). In the past week, the French crop was reduced by 4mmt.

Even in god’s country (Scotland), I am hearing from contacts of yield expectations being the lowest in recent memory. The national farmers union have reduced the UK crop from 14.5mmt to 13.5mmt. These drops have led to a sudden rise in French wheat futures (matif) and London wheat (liffe) which can be seen in Figure 2.

The tariff scuffle between the US and China will likely kick up a gear today as tariffs are set to be enacted. The US government will commence tariff collection at 2 pm this afternoon, with China to begin retaliatory tariffs immediately after. In recent hours Trump has escalated concerns, commenting that $500bn in Chinese exports could be targeted. The Chinese threat of tariffs on US soybeans has led Brazilian supplies achieving strong premiums (Figure 3) – in fact, the largest premium since 2004.

Also, if you would like to hear my dulcet tones you can watch my market update on The AgShow on the link below:

Commodity market Update

What does it mean/next week?:

There are three main areas to keep an eye on during the next week:
-US/China tariff escalation. Any impact on the Chinese economy is likely to result in a fall in the A$.

-Rainfall. NNSW remains quite dry, with very little rain due in the next eight days.

-Europe. As the EU starts to harvest, will the old adage of a small crop getting smaller come into play?

Back through 500 for the EYCI but heavies doing better

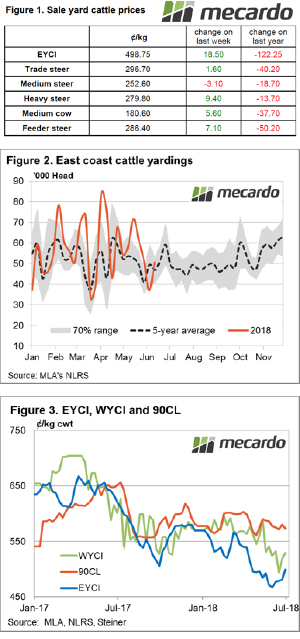
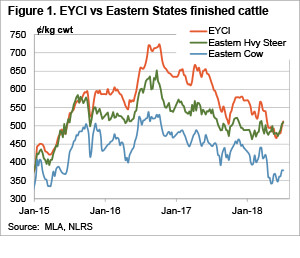
A bit of precipitation and weakening supply has seen cattle prices continue to rally this week, with the Eastern Young Cattle Indicator (EYCI) breaking back through the important 500¢ mark.  Slaughter cattle prices also improved, as supply goes into its usual winter hibernation.

It’s strange to look at the weekly eastern cattle indicators and see the EYCI at a 98¢ discount to this time last year, while the Medium and Heavy Steer Indicators are just 10¢ behind this time last year (figure 1).

While finished cattle are showing some strength, cows have also rallied, but are nowhere near their prices of last year, at an 80¢ discount. The bit of rain which has been seen in some parts of southern Queensland and northern NSW needs some serious follow up before we see the supply of cows weaken.

It was Queensland where the main price movements were this week.  The Queensland Heavy Steer gained 48¢ to hit 516¢/kg cwt.  This is still well behind NSW (562¢) and Victoria (533¢) where the tight finished cattle supply is hitting hardest.

Given the lack of grass available in NSW and Queensland there is unlikely to be a lot of finished grassfed cattle around for some time.  This might see prices continue to rally, or at least maintain strength, and also support grainfed prices.

The Western Young Cattle Indicator (WYCI) is still outstripping its east coast counterpart, gaining 10¢ this week to move back to 526¢/kg cwt.

Export prices remain solid, with the 90CL sticking at 571¢/kg swt, while the Grassfed fullset to Japan is at the same price as last year.  Little wonder Heavy Grassfed Steer prices remain strong.

What does it mean/next week?:

There’s not a lot of rain on the forecast, so the dry continues.  It’s hard to see the young cattle rally continuing under these conditions.  Strength should remain for anything heavy enough to feed or finished enough to kill, but the little light cattle might start to struggle again.

Export demand soaking up extra supply

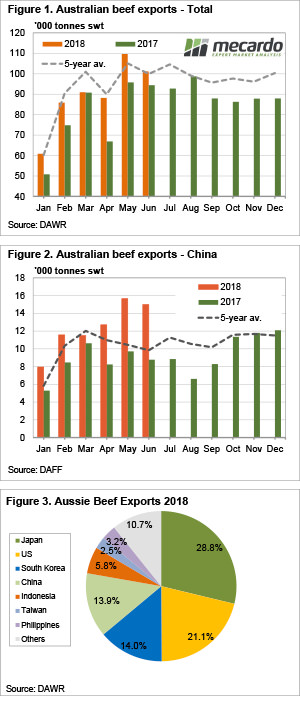
Cattle slaughter remained relatively strong in June, and this flowed through to export, which, while being down on May were still at their second highest level for the year. China maintained it’s very strong demand for frozen beef, helping keep export prices elevated despite cheaper cattle prices.

Australian beef exports fell 8% in June, but this was from a two and a half year high. As such, June was the second highest beef export month since the end of 2015. At just over 101,000 tonnes, beef exports were just above the five-year average and 7% higher than last June.

It appears that in manufacturing beef, China and the US are competing strongly. Figure 2 shows that exports to China only fell 4% and managed to post a 71% increase on June 2017. Exports to the US were down 3% in May and 10% on June last year. Increasing US beef production and increasing Chinese demand has seen less beef heading to our second biggest market.

Indonesia is another market competing for lower value frozen beef. Beef exports to Indonesia in June were up 63% on last year while being down 17% on May at 6,672 tonnes. Indonesia is now our fifth largest export market.

In higher value beef export markets Japan continues to dominate. Chilled beef exports to Japan totalled 10,839 tonnes, accounting for 45% of total chilled beef. Chilled beef exports to the US continue to rise, with demand for grassfed beef continuing to improve. The US took 23% of our chilled beef exports, while South Korea accounted for 11%.

Traditionally Japan, the US and South Korea would have accounted for 90% of total beef exports, but market diversification has seen smaller markets taking more beef. Figure 3 shows the range of markets we have exported to in 2018, which is good for competition, demand and prices.

What does it mean/next week?:

There is still plenty of demand for Aussie beef, with the weaker Aussie dollar obviously helping us compete with US beef in higher value markets and making our beef cheaper in the US.  The solid export market is helping support cattle prices in the face of dry weather and the strongest supply in three years.

Prices consolidate as supply wanes

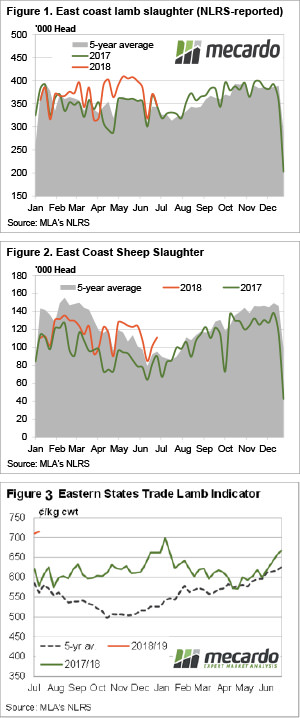
After the big spike in lamb prices last week the market steadied. There was plenty of talk about the high prices making things hard for processors, but lamb and sheep slaughter still managed to remain at or above last year’s levels.

Figure 1 shows weekly lamb slaughter starting to follow the 2017 pattern very closely. The fall in slaughter last week was no doubt part of the reason prices rallied so strongly as it was the lowest full week slaughter for the year to date.

Like last year the tighter supply and higher prices are likely to trigger slowdowns in production, but the way lambs have been killed in April, May and June, there might not even be enough lambs for that.

Despite higher prices, sheep slaughter ramped up last week (Figure 2). This tells us that perhaps there is more money in sheep at the moment for processors. Combined sheep and lamb slaughter is still 5% higher than the same week last year.

The high prices last week drew some more lambs into yards, and this week it was heavy lambs which made the best money. The Eastern States Heavy Lamb Indicator gained 29¢ to hit a record of 735¢, while the ESTLI was up just 5¢ to 715¢/kg cwt (Figure 3).

In the West, prices eased 10% for both lambs and sheep, to 607 and 398¢/kg cwt respectively. At that price, sheep will start to work their way east, where prices in saleyards this week averaged 517¢/kg cwt.

What does it mean/next week?:

It looks like the 720-750¢ level is the limit for lamb processors. There were some pens of lambs reportedly making 800¢ this week though, and these were the highly sought after well-finished lambs. There’s not many of them about at the moment. Interestingly, there might be potential for a little more upside for mutton.

The inevitable correction

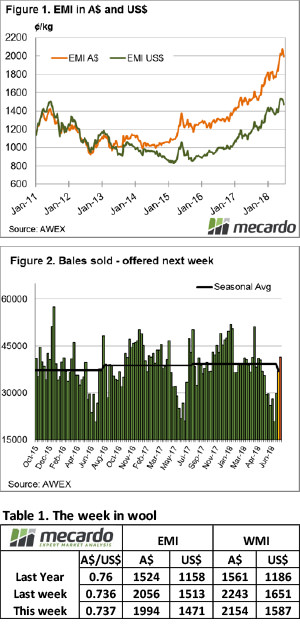
The wool market lurched into F19 with an overhang of wool producer’s bales looking to swing income from F18 to F19. If the plan was to reduce tax payable, the market assisted and pulled the market back in all centres and on both days.

By the end of the week the market had retraced 80 to 100 cents across all Merino types.

The Eastern Market Indicator gave up 62 cents over the week to settle at 1,994 cents AU$ terms. (Figure 1).

This week the Australian dollar traded steady ending Thursday at 0.737. The EMI was also weaker in US$ terms although not to the same scale as in Au$ terms, closing at 1,471 US cents, down 42 on the week.

The eagerness of sellers in the past month evaporated this week, with 14.3% passed in on Wednesday and a further 17.2% on Thursday for a total of 15.6% over the week.

Still, the large offering of 43880 bales resulted in 37,018 bales sold, well above the 27,000 averages for June but in line with the season average of 39,000 per week.

While all categories of Merino fleece were affected, it was the lower style and lots with poor measurements that really struggled, conversely any lots with good specifications were keenly sought. This trend is a replica of previous soft markets.

Contrary to recent sales Crossbreds escaped the full brunt of the market retreat on Wednesday, however took a turn for the worse on Thursday, with declines on the week averaging 30 to 50 cents.

 Merino Skirtings eased in line with fleece wool, however lines containing >5% VM found few friends.

Merino Cardings also eased with the Cardings Indicator in Sydney – 10, Melbourne – 10 and Fremantle -5 cents.

The week ahead

Next week all 3 selling centres will be selling, and a reduced offering of 41,431 bales are rostered for sale, significantly lower than this week.

This should take some of the pressure off the market although keen watchers will be looking for any negative trend developing should we see another week like this.

What do US soybeans and the Socceroo’s have in common?

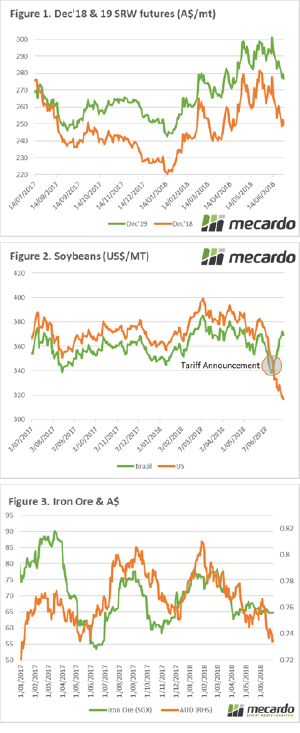
The past week has largely been void of new fundamental data to move markets. The big issues of the week are political in nature, with only one week until tariffs are in place against a multitude of US agricultural products. So, what do US soybeans and the socceroo’s have in common? They are both uncompetitive.

The wheat market continued to retreat over the week, with Chicago futures down 11¢/bu or A$3/mt. Northern hemisphere producers have started selling their crop, placing pressure on the market. Will this continue or will growers stop once they have met their cashflow requirements?

In Figure 1, the December futures contract for both 2018 and 2019 is displayed. As expected both contracts have experienced a decline in line with one another. In past analysis articles during April and May, we have outlined good hedging opportunities, especially for December 2019.

During this point in time, it would have been feasible to lock in A$295-300/mt. At even the most conservative estimate of basis, this would have led to a price well above $300/mt. At present, the Dec’19 contract has contracted to A$276/mt. Although a less attractive hedge, it would still provide an attractive price; using average basis levels this would likely lead to a $300-310 price.

We are one week away from implementation of Chinese tariffs against a multitude of US agricultural products (see here). China is set to implement a 25% tariff on US soybeans, this instantly makes US supplies uncompetitive versus other origins. The result can be seen in Figure 2, which displays both US and Brazilian soybean prices. Brazilian soybeans have moved from trading at a discount to the US, to trading at a strong premium (US$50/mt).

If the tit for tat retaliation between the US and China continues, we could see a reduction in global trade. Our currency in recent years has largely followed the economic performance of China. In the past week, we have seen the A$ drop to the lowest levels since early 2017 (Figure 3). It will be interesting to keep a keen eye on Iron ore pricing, as this can be an indicator of economic performance in China.

What does it mean/next week?:

There has been a lack of fresh data in the past week, however, there will be new data released from Canada and the US. Reports at this time of year can provide big surprises, as real data from the field flows into the analyst’s lap.

The rainfall in QLD/NSW this week was not quite as healthy as hoped however provided a lifeline. There are substantial falls expected for WA towards the middle of next week, which will hopefully provide a floor in yield.

Demand suggests plenty of cattle upside

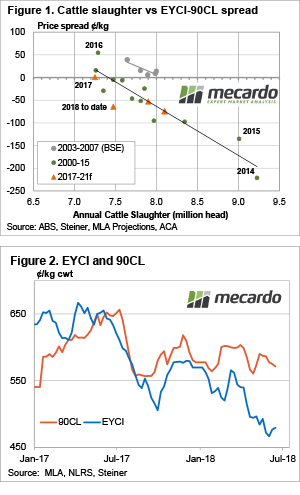
The cattle market appears to have found a base in recent weeks, and this is due to supply finding a top, and good processor margins seeing cattle being soaked up.  So where to from here?  This week we take a look at demand, and where the market will head when supply tightens up again.

The fact that beef is sold into a competitive international market means that supply and price have a variable relationship. As opposed to lamb, where shifts in supply are generally the driver of price, cattle markets are more subject to things beyond producer control.  Factors like beef production in competing nations, shifts in demand and exchange rates tend to be the main driver of cattle prices.

So a traditional supply and demand curve doesn’t exist for Australian cattle prices. However, a couple of years ago we discovered a supply and demand relationship which does tend to ring fairly true. If we take the 90CL Frozen Cow export price and deduct the Eastern Young Cattle Indicator (EYCI) it gives us a measure of how local prices are faring relative to the international market.

In Figure 1, we have plotted the annual cattle supply against the 90CL/EYCI spread. It shows that the higher supply is on the X axis, the lower the spread is on the Y axis, and vice versa. The extraordinary season in 2016 saw the EYCI rise above the trend line, with restocker demand holding the spread at more like the levels seen during the years when BSE locked US beef out of Japan and Korea.

The weaker EYCI relative to the 90CL during the second half of 2017 saw the 90CL/EYCI spread at close to zero, slightly below the 16¢ that the trendline predicts with the annual slaughter of 7.16 million head.

Figure 1 also shows Meat and Livestock Australia’s projection for cattle slaughter in 2018, along with the 90CL/EYCI spread for the year to date. Cattle slaughter is running a bit ahead of MLA’s schedule, which accounts for some of the larger than expected spread, but weak restocker demand is also depressing the EYCI.

What does it mean/next week?:

While the Bureau of Meteorology increased the chance of El Nino to 50%, it still leaves at least a 50% chance of getting rain in the spring, or early summer. With rain, comes restocker demand, and weakening supply of store cattle and higher prices. The question of how much higher is limited by export prices, but under current values, a return to zero spread would see the EYCI gain 90¢ (Figure 2).

With the herd rebuild being put on hold, and maybe some more liquidation taking place, total cattle slaughter is likely to fall, meaning the EYCI could again move to a premium to the 90CL and take prices back towards 600¢.

No World Cup dive for our cattle prices

It does seem fashionable to take an easy dive now with the World Cup in full flight. Alas, the Socceroos are out and our ovine market commentator was right, I was up bleary-eyed mid-week to see the crashing exit. But at least there is something to cheer about when it comes to cattle prices this week.

The Eastern Young Cattle Indicator (EYCI) is mirroring Messi’s last-minute breakthrough against Nigeria to see a solid 4% gain on the week to close just shy of $5 a kilo cwt. As noted in our beef comment from last week some rain in NSW and Queensland has helped the EYCI to lift. In addition, our analysis earlier in the month on improving processor margins suggested this could help see the EYCI recover toward the 500¢ level mid-Winter.

In other sale yard cattle categories prices were also improved this week with gains noted between 0.5% to 3.5%. Medium Steers were the only type to show some red ink (indeed as red faced as the Germans after their shock exit), closing at 252.6¢/kg lwt – Figure 1.

East coast throughput rebounded 37% this week to see it sitting comfortably within the normal seasonal range for this time of the year and slightly above the five-year average – Figure 2. NSW was the only state to record throughput levels above the seasonal average this week, suggesting the dry spell still having an impact there on sale yard cattle numbers.

In the West, cattle yardings have eased 16% and this has given the Western Young Cattle Indicator a bit of a lift too, posting a 2.3% gain to close at 529.5¢/kg cwt. In offshore markets the 90CL down a mere 1.3% and still sitting at good levels at 572.7¢/kg CIF – Figure 3.

What does it mean/next week?

Light rain forecast for Victorian and some central Queensland regions, along with some good falls for WA, should keep the cattle markets ticking along nicely. And with an early prediction for the World Cup final expect to see Belgium take on England, with the English taking the cup after a 52-year hiatus. You heard it here first…