Month: November 2018

What in the ag markets changed 254.7% overnight?

Recently there have been releases from both the US Department of Agriculture (USDA) and the National Statistics Bureau (China). There were some very, very big changes to headline numbers.

I have rightly or wrongly always been dubious of supply and demand numbers originating from China. The data reporting does not appear to be as rigorous as other nations and it can be very difficult to obtain a strong handle on what is happening on the ground.

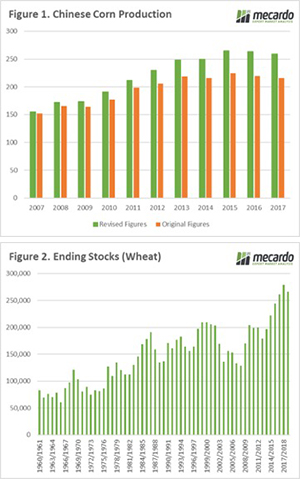
The National Statistics Bureau has revised Chinese corn production from 2007 to 2017 based on census data. This has resulted in large amendments, with production over the period increased by 259mmt (Figure 1). To put this in perspective, China has found 23.6mmt on average over the past decade. Coincidentally, this is the average Australian wheat production for the same period.

The USDA released their November World Agricultural Supply and Demand Estimates (WASDE) overnight. The USDA reflected the change and increased Chinese corn ending stocks by 254.7% between the October and November update. The overall global picture for corn stocks is 307mmt, versus 159mmt one month ago.

If these numbers are truly reflective, then this will reduce China’s need to import corn during this season, or at least until the mandated 10% ethanol in fuel regulation is implemented.

Wheat was also given the bearish treatment, with global end stocks increased by 6.5mmt. This would place world ending stocks at the second highest on record (Figure 2). As ever, we must be cognizant of the fact that 53% of world stocks are held in China and are unlikely to be available to the world market.

The Australian crop was reduced from 18.5mmt to 17.5mmt, which remains above trade estimates. There tends to be a two-month delay in the USDA expressing a change in Australian wheat production from what is happening on the ground. In the December update, it would be unsurprising to see a further reduction to 16.3-16.8mmt. However, this will already be taken into account by the market.

What does it mean/next week?:

As harvest rolls will we get more surprises or will harvest selling pressure bring some downside to pricing?

There is some light rainfall expected for most of the east coast in the next 8 days, which will be positive for the sorghum crop.

Its officially a rout

While AWEX comments on Thursday noted that the market had steadied there is no denying the market again suffered from a lack of buying demand. Reduced offering and falling prices across the board were the end result of what has been a perplexing 6-week period.

The Eastern Market Indicator (EMI) fell 76 cents to accumulate a 200 cent fall over the past 4 weeks, ending the week at 1,776 cents. The Au$ was again stronger up almost 2.1%; the EMI in US$ terms fell by 29 cents to end the week at 1,293 US cents (Table 1).

This puts the US$ EMI back exactly where it was one year ago, and with a dramatically reduced supply year-on-year the conclusion can only be that demand has fallen – at least for the immediate timeframe.

In Fremantle, the Western Market Indicator (WMI) lost ground, falling 74 cents on the back of the last two week’s 89 cents falls to end the week at 1931 cents.

Compared to the original roster posted last week, only 32,000 of the 35,000 bales intended for sale this week actually came to the market. Again, growers were unimpressed with the market and passed in 20.9% or 6,734 bales. This resulted in a clearance to the trade for the week of 25,455 bales, 4,359 fewer than last week.

The dollar value for the week was $48.9 million, for a combined value of $1.22 billion so far this season.

In the auction weeks since the winter recess, 452,634 bales have been cleared to the trade, 109,043 fewer than the same period last year. The average shortfall cleared to the trade compared to the same time last year continues to grow and now sits at 7,788 bales per week fewer.

Of note is that over the past 7 weeks the EMI has fallen 237 cents or 11.7%, while the clearance to the trade has been 82,000 bales fewer than the same period last year.

The only bit of positive news from the market this week was AWEX reporting that on Thursday there was evidence that buyers were reluctant to pass up wool with good specifications resulting in some “resolute bidding” for these types.

Cardings again struggled to find support, with the Melbourne sale noting a further 6.4% fall.

According to the AWEX roster, the next three weeks less than 40,000 per week are predicted, with 39,883 bales next week.

After what looked like a steadier market last week, the opening on Wednesday was again a case of an accelerated decline as buyers waited for the bottom of the market to appear. Again, it would be a brave call to predict a rally next week, the best result would be a cessation of the decline.

East coast lamb yarding levels off like a rocket.

The spring flush is well underway now and the increased numbers at Victorian saleyards this week contributed to an extra 100,000 head of lamb exchanging hands. Although swelling yarding levels weren’t contained to Victoria this week with SA, NSW and WA all posting increased figures.

The impact of the additional supply saw prices ease across the East coast for all NLRS reported categories of lamb. The Eastern States Trade Lamb Indicator took the biggest hit on a ¢/kg basis, with a 33¢ drop to close at 678¢ (Figure 1). Price falls ranged from 12¢ to 30¢ for the remaining lamb categories (Table 1).

East coast lamb yarding levels are up 55% on the week to see 286,762 head reported, well outside the normal seasonal range that could be expected for this time of the year and 49% above the five-year average (Figure 2). The additional lambs across the east coast came from all states, with NSW lamb yardings up 34%, SA up 99% and Victoria increasing 72% from the previous week’s figures.

In the West, lamb yardings were higher too, up 23%. However, the impact on price of the additional supply was restrained as trade lamb prices have been supported by the resumption of the live trade. Mid-week reports for the Western Australian Trade Lamb Indicator saw it gaining 50¢ toward 625¢/kg cwt. As we reported earlier in the week, the spread discount between East coast and West coast trade lamb has narrowed significantly since the return of additional buying competition in Western Australia with RETWA being granted an export license.

East coast mutton prices continue to hold firm, easing a meagre 3¢ on the week to close at 428¢/kg cwt. Mutton prices remain solid despite prolonged levels of sheep slaughter. Indeed, from July to November weekly mutton slaughter rates have been trending 30% higher than the seasonal average but it hasn’t been enough supply to soften prices significantly. Offshore demand is continuing to soak up the excess it appears – stay tuned for an update on mutton exports next week.

What does it mean/next week?:

As our analysis yesterday pointed out, it appears the Victorian spring flush for Bendigo is completed and Ballarat’s numbers are looking to peak soon too. That only really leaves Hamilton as the remaining saleyard to contribute to the final surge of lambs as we head toward the end of the year.

Downside for the ESTLI is probably going to be limited to the 630-650¢ region as outlined in our Mecardo analysis piece from 18th October entitled “A season spent at the edge of normal” and expect a recovery back above 700¢ reasonably quickly after the spring flush subsides.

Waning restocker demand waiting for more rain.

There has been more rain about this week, but it couldn’t stop the Eastern Young Cattle Indicator (EYCI) falling. Young cattle prices are coming off six-month highs, and we thought the Melbourne Cup was supposed to the stop the nation, but it only stopped a few thousand cattle.

Figure 1 shows there was a heavy fall in EYCI yardings this week, with 25% fewer young cattle hitting the yards. It wasn’t all on Tuesday in Victoria. In fact, yardings were down all up the east coast. Prices were also down in most centres, which is strange given the rain, but trade cattle prices were relatively steady.

Perhaps restockers have their fill of cattle for the time being and are holding off while waiting to see if more rain arrives.  The indicators do give the impression restockers cooled off.  The National Restocker Indicator fell 17¢ to 291¢/kg lwt, while feeders were relatively steady, and trade steers eased only 6¢ to 287¢/kg lwt.

Figure 2 gives a good indication why finished cattle prices aren’t falling with store cattle. The supply of slaughter-ready cattle is on the wane, which is unusual for this time of year. The dearth of grassfed cattle, along with cow retention with a bit of rain, has seen east coast cattle slaughter fall to its lowest full week level since March.

Lower Australian supply has seen a rally in export beef prices, they gained 7¢ in our terms this week to 562.5¢/kg swt. The rally was strong in US terms, but improving trade prospects saw the Aussie dollar rally above 72¢.

Next week?:

The cattle market is still waiting for that widespread rain which can sustain a price rise. At the moment restocker supply and demand is waxing and waning, seeing some volatility in the EYCI.  Finished cattle values have been much steadier and are unlikely to ease until there is a good supply of grassfed cattle again.

Bendigo nearly done but spring flush just begun.

We have been talking about Victorian lamb yardings for a couple of weeks now. Firstly, they were lower than normal, then they rapidly picked up last week, to be much higher than normal. We thought it timely to take a look at seasonal supply trends across the major yards, and what this might mean for supply, and price, in the coming weeks.

There is a strange dynamic in lamb markets, where for most of the year NSW contribute most of the east coast yardings, while Victoria has the largest slaughter. In the spring and early summer, Victoria briefly takes the mantle for strongest yardings, pushing east coast levels over 250,000 head.

Figure 1 shows east coast lamb yardings and the impact Victorian yards have during the last two months of the year. During October, lower Victorian yardings saw total east coast yardings track below last year’s levels and the five-year average. The October dearth seems to have been caused by weaker new season lamb supplies at Bendigo and Ballarat. The Ballarat lambs might still be coming, but we suspect the Bendigo lambs were never there.

The Bendigo spring flush is dwarfed when Ballarat and Hamilton get going in November and December. Figure 2 shows Ballarat last week was not far off its peak young lamb supply and the flow is just beginning at Hamilton, with 8000 last week and 11,500 head today.

In November and December 2016, Ballarat and Hamilton yarded 593,000 head of young lambs. In 2017 it was 587,000, which is remarkably consistent, but the seasons were similar in terms of good spring rain.

This year spring has been dry for Western Victoria, not disastrously, but dry enough to see plenty of producers contemplating turning off lambs which traditionally might have been shorn and carried through to the New Year.

We are already seeing a good supply of restocker lambs keeping a lid on prices. Figure 3 shows the National Restocker Lamb Indicator is only marginally ahead of last year, despite the recent very strong finished lamb prices.

What does it mean/next week?:

With a big flush of lambs still to come out of Western Victoria, don’t expect store lamb prices to improve too much before Christmas. We have seen restocker lamb indicators hold well relative to the recent fall in trade and heavy lamb values, and this can be put down to the forward contracts on offer.

However, if supply overcomes demand from restockers over the coming month or six weeks, restocker lambs might well become a hold as the spring flush of lambs ramps up.

Key Points

  • Victorian saleyards have been a bit slow in October, but supply from Hamilton and Ballarat is about to ramp up.
  • Restocker lamb prices are holding relatively firm at last year’s levels but will face supply challenges.
  • If restocker lamb prices fall there might be some tough decisions for those supplying lambs between now and Christmas.

Xie Xie Trump.

Social media continues to be an influencer in markets. In the last day we have seen big moves in the market in response to a tweet made by President Trump regarding China. In this week’s comment, we take a look at the markets it has influenced.

Donald Trump announced (through twitter) positive discussions with his counter part in China, Xi Jinping. During Trump’s election campaign, he had alluded to his desire to change the trade relationship with China. This resulted in the announcement of various tariffs by the US and counter escalations by China.

The biggest impact to the US was with agricultural products, especially soybeans. This resulted in US soybeans becoming uncompetitive versus other origins. This was covered in the article ‘What do US soybeans and the Socceroo’s have in common?’.  The Trump tweet has resulted in expectations that positive trade talks would result in an improvement in soybean exports which have been languishing of late. This resulted in strong rally in soybean prices (figure 1) of 4%.

It is important to note that at this stage, the relationship could easily change direction with little notice. As we have seen, the US president has been volatile at times. It’s not over yet.

Yesterday the A$ rose 1.87% rising from 0.7073 to 0.7205. This was its biggest daily jump since March 2017 (figure 2). The expectations of a thawing relationship between Trump and China, along with a positive Australian trade balance for September which was strongly above expectations.

The increase in the A$ technically makes Australian wheat less competitive from an export point of view, however at present we are well above other origins at present. The stronger dollar will provide some benefits for imported products.

What does it mean/next week?:

Trump could easily change his mind and go stronger against China. This would result in any gains and positive sentiment being lost.

The USDA will released their WASDE report next week, giving an indication of the final results of the season from the northern hemisphere.

This week also saw an increase in US wheat export sales (582.5kmt vs exp 200-500kmt), will we see this repeated for a second week?

The fall steadies but no light in the tunnel.

Wool producers did their best to support the market this week; of the 40k bales rostered only 35,700 were eventually offered for sale with a further 5,900 passed under grower’s reserve. Despite this, the market again fell.

The Eastern Market Indicator (EMI) fell 20 cents on top of the last two week’s 149 cents fall, to end the week at 1,854 cents in AU$. The Au$ rose almost ¾ of a cent; the EMI in US$ terms fell by 5 cents to end the week at 1,322 US cents (Table 1).

In Fremantle, the Western Market Indicator (WMI) lost ground, falling 28 cents on the back of the last two week’s 137 cents falls to end the week at 2005 cents.

Compared to the original roster posted last week, less than 75% of the 40,000 bales intended for sale this week were in fact cleared to the trade. Growers passed in 16.6% or 5,970 of the 35,784 bales that were finally offered for sale. This resulted in a clearance to the trade for the week of 29,814 bales, 3,500 more than last week.

The dollar value for the week was $62.06 million, for a combined value of $1.17 billion so far this season.

In the auction weeks since the winter recess, 427,179 bales have been cleared to the trade, 91,600 fewer than the same period last year. The average shortfall cleared to the trade compared to the same time last year continues to grow and now sits at 7,050 bales per week fewer (Figure 2).

Of note is that over the past 3 weeks the EMI has fallen 169 cents or 8.3%, while the clearance to the trade has been 45,000 bales fewer than the same period last year.

This is a serious correction with the EMI giving back 12% since it peaked mid-August at 2116 cents.

19 MPG and broader types while also easing have been less affected, with 19 MPG and finer not only feeling the brunt of the general market correction, but also the increased volume of drought influenced fine wool has tested buyer’s capacity.

Cardings have plummeted in recent weeks, going from being the “star” performers to now almost unwanted. The Melbourne Carding indicator has fallen from the August peak of 1558 to this week close at 1116, a 28% retracement. Despite the more affordable price, 25.5% of offered Cardings did not reach growers reserve, with only 3,819 of the 5,120 bales offered sold.

The week ahead

According to the AWEX roster, the next three weeks less than 40,000 per week are predicted, with 35,600 bales next week. Growers have decided they are comfortable holding wool so its unlikely this number will get to the auction next week.

While this week the fall was reduced compared to the past two weeks, it is still too early to call the bottom of this recent correction.

Hold, Hold, Hold, Now!

Those familiar with the movie ‘Braveheart’ will recall the scene where Mel Gibson and co are facing a cavalry charge from the English Army. Mel said ‘Hold, hold, hold, now!” and the Scottish rebel impaled the English horses on spears and subsequently won the battle. It’s a weak analogy, but with Victorian lamb producers facing encroaching dry conditions, they have held, and held, and held, until this week they raised their spears, but were themselves impaled. Metaphorically, not literally.

After Matt’s article last week, and earlier this week, looking at Victorian lamb yardings, or lack thereof, this week the lambs appeared (Figure 1). The lift in supply was felt across all yards, with Naracoorte in South East South Australia also seeing a big rise.

With plenty of lambs and sheep seemingly booked in over the hooks, prices tanked sharply. Normally we don’t see Victorian lamb yardings over 100,000 head for another month and so processors definitely didn’t have the space to kill them.

When supply overwhelms demand, prices fall. Although, there was some good news. The Eastern States Trade Lamb Indicator (ESTLI) fell 77¢ but only back to the levels seen three weeks ago. Processors and restockers were happy to buy lambs at the lower levels, even if they weren’t to be killed this week.

All lamb prices fell this week, but mutton ‘only’ lost 35¢ to sit at 431¢ on the east coast and 400¢ in the west. While in the west, lamb prices rallied, gaining 9¢ to 575¢/kg cwt. Still well behind the east, but on the way up.

Next week?:

The high prices of the last couple of weeks, along with dry weather, encouraged growers to offload lambs this week. The test will be whether supply continues to flow, or if it pulls back with lower prices. The Melbourne Cup usually sees lower yardings next Tuesday, so we might not get a real indication until the following week. The relatively strong prices in the face of heavy supply are encouraging, however, at least for well-finished lambs.

Canola & Rape futures.

Canola is starting to be harvested but a cloud hangs over the industry. With a massive hay program and dry finish, what will happen to yield and oil content? In this analysis, we take a look at canola basis versus Canada and France.

Two weeks ago, we wrote about canola pricing catching up with the drought conditions in the article “Canola: Finally catching up”. This week we will take a look at the canola futures market.

There is an Australian canola futures contract on ASX. However, it has no trading activity, therefore it is ineffectual. Farmers who are hedging using financial price risk management tools will then have to look overseas for a market.

If we are ignoring local derivatives, the main contracts are Canadian Canola futures (ICE) and French Rapeseed (Matif). The Matif contract is non-GM, whilst the ICE contract is GM.

In Figure 1, the Matif and ICE spot contract is displayed in A$/mt. The Matif contract rose through July-September as drought conditions impacted upon the German and French crops. The ICE contract also followed the general market. However, in recent weeks, the market has lost much of its momentum and is sitting below the average from Aug-Nov.

The drought in Australia has drastically impacted canola production, therefore we would expect that the local premium (basis) against overseas futures would rise dramatically. In Figure 2 & 3, the basis between ICE and Matif is shown. Recent weeks have seen a sharp rise in basis levels over both contracts.

The premium over ICE is at the highest level since 2014 and is the highest against Matif during this decade. Typically, when these peaks are reached the market tends to experience a correction, but will this be the case this year?

What does it mean/next week?:

A high basis level usually suggests that it is time to start selling physical. However, a huge amount of uncertainty remains around canola production levels (& oil content). The east coast has a likely deficit of supply which will place pressure on crushers as they move into the new year.

The risk of seed imports is low, however, oil consumers can easily switch to imported canola oil to meet their requirements.

I am confident of strong prices into the new year, however I would advocate for a bite sized selling program as the seed comes off the header.

Key Points

  • Canola prices have risen dramatically in the past month.
  • The price increase is attributed to local
  • Basis levels against both ICE (Canada) and Matif (France), are at their highest levels since the start of the decade.

Yarding boost provides headwind on prices.

The recent rain has provided a lift to cattle prices last week across the East coast and producers responded this week to the improved prices with increased offering at the sale yard. The extra numbers putting a bit of a dampener on the rally for most categories of cattle.  
The Eastern Young Cattle Indicator (EYCI) eased 1% this week to close at 535.25¢/kg cwt. Given that yarding of EYCI eligible cattle was up 40% on last week’s figures the magnitude of reduction in price isn’t too bad. EYCI eligible cattle averaged 18,636 head per day this week compared to the 13,303 head seen last week and yesterday saw the first yarding in excess of 20,000 head since July.

Across the Eastern seaboard cattle prices eased between 1-9% for most reported categories with Heavy Steers the only group to manage a slim price gain of 0.8% to creep back above 300¢/kg lwt – Table 1.

Increased yarding levels the likely culprit for the stalled rally with East coast throughput returning to average seasonal levels this week to see a 39% lift in numbers on the previous week to see nearly 49,000 head change hands at the sale yard – Figure 1.

Domestic and offshore prices have converged in recent weeks with the recent rain providing a boost to the EYCI. Improved demand for grinding beef from US buyers has seen the 90CL gain 1.3% to close at 555.4¢/kg CIF.

Next week

Further rain is forecast for much of the country next week, although it is a bit light on for Queensland and WA with less than 10mm anticipated there. The big falls (15-50mm) are reserved for NSW, SA, Tasmania and Victoria.

Expect the EYCI to hold its ground this week given the rainfall forecast and potentially probe a bit higher toward the 550¢ level to bring it more in line with the 90CL and young cattle prices in the west.