Month: March 2019

Where have all the good wools gone?

The prevalence of poor quality wool has dragged the market down for a fourth week in a row. Lower style types were discounted by around 20 to 40 cents from last week’s base and this was enough to pull most individual Merino categories down.

AWEX reported that many of the lower styles also possessed poor additional measurements. These styles made up the highest proportional level of the Merino fleece offering since 2010. This week’s analysis piece looked into the drought implications on this seasons wool specifications and is worth a read (view here).

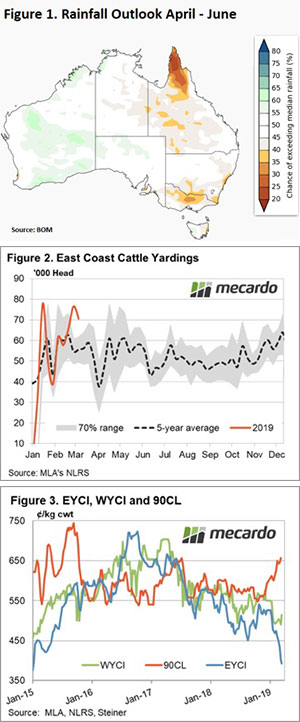
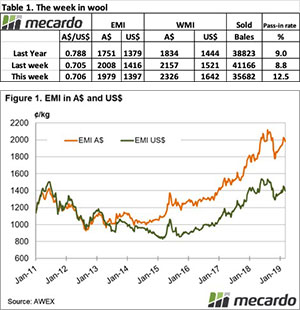
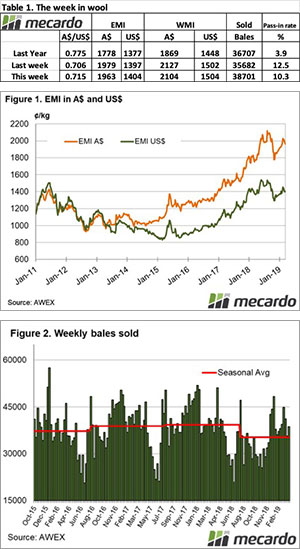
The Eastern Market Indicator (EMI) fell 16 cents to 1,963 cents. Improvements in the Au$, back above the US $0.71 mark, helped lift the EMI in US$ terms slightly. It rose 5 cents to end the week at 1,403 US cents (Table 1).

In Fremantle, the Western Market Indicator (WMI) declined by 23 cents to finish at 2,104 cents.

43,129 bales were offered for sale this week, 2,344 more than last week with the trade clearing 38,701. This is 3,019 more bales than last week, however, sellers are still not satisfied with the market levels, passing in 10.3% of bales.

In the auction weeks since the winter recess, 1,059,086 bales have been cleared to the trade, 191,241 fewer than the same period last year. The average shortfall cleared to the trade compared to the same time last year now sits at 6,374 bales per week fewer.

The dollar value for the week was $81.54 million for a combined value of $2.487 billion so far this season. A simple calculation of $ value divided by bales sold gives us $2,189 per bale across all types.

Crossbreds were the only category to see improvements this week. Gains of 10 to 20 cents were recorded in Melbourne. The Cardings sector felt the biggest cut of the week. Across the three indicators, declines of 30 to 70 cents were recorded from last week’s sales.

The week ahead

The roster for next week predicts an offering of 38,950 bales with further falls to 37,787 and 35,735 in the weeks proceeding. The lower offerings over the next few weeks may bring about added support for the better-quality wools. Whether there will be enough presented compared to the lower styles to lift the overall market remains to be seen.

Grain Traders: Another one bites the dust.

In this week’s market commentary, we discuss some good news in the barley market. Unfortunately, it is not good news all round though with the voluntary administration of mid-tier grain trader Lempriere Grain.

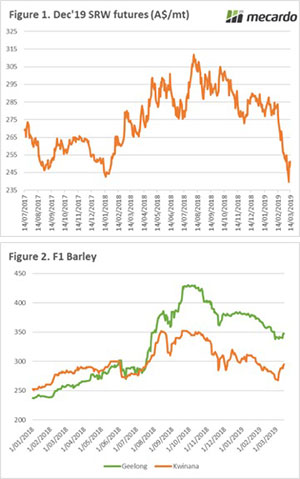
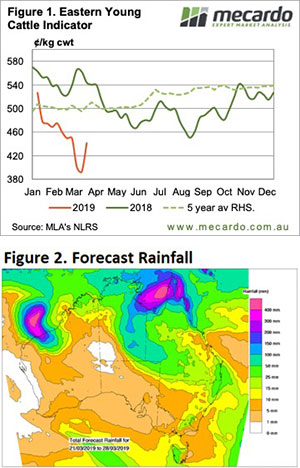
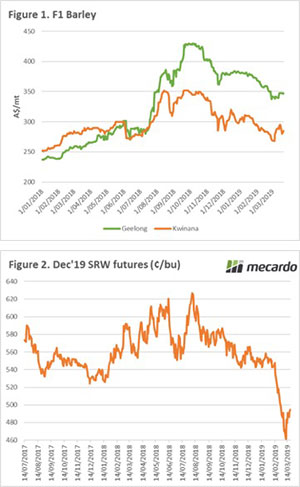
In recent weeks, we have been discussing concerns around the looming investigation by China into anti-competitive dumping of barley. If found against Australia, this will be negative for pricing which we have already seen with the deterioration of pricing (figure 1).

However overnight Saudi Arabia is tendering for a massive 720kmt of feed barley which will help with the demand side of the equation. These shipments are for the following periods

2nd half may – 180kmt red sea

1st half June – 240kmt red sea, 60kmt Gulf

2nd half June – 180kmt red sea, 60kmt Gulf

After falling for a number of weeks the wheat market has found its floor (at the moment) and has risen 2% since the start of the week, resulting in a A$2/mt increase in the December futures price (figure 2). The A$ has increased due to robust data and if the dollar was at the same level as Monday would have seen prices around A$1.6 higher.

In unfortunate news, the Victorian-based grain trader Lempriere Grain has entered voluntary administration. The business is owned by Starcom Resources (50%) and two companies owned by Will Lempriere. Their website has been removed, however, the archive is available on the link here.

There have been claims of slowing of payments in recent months. Then during the past week, the business stopped answering calls according to news reports. This was clearly of great concern to those who have outstanding debts with the business both to farmers and service suppliers.

It is likely that the losses will be substantial. Discussions with just a few trade participants would put the tally to at least $4m. The businesses impacted will now face a long and stressful slow to try and get their owed funds back.

I recommend that growers read the following two articles:

3 tips to minimise counterparty risk

Protect yourself from receivership with a PPSR

What does it mean/next week?:

The weather is the primary factor to keep an eye on in the coming week. There is substantial rainfall forecast across much of QLD and NSW, which will help provide some subsoil moisture to parched areas.

On the other side of the Pacific, the US is experiencing some big floods which although not yet impacting upon pricing, could delay spring planting.

Mutton firms despite elevated supply

A bit of a mixed bag for lamb price movements this week across the Eastern states, with Restocker, Trade Lambs and Mutton the only categories to see a price lift. Mutton prices remained remarkably strong in the face of elevated yarding and slaughter throughout much of March.

NSW saleyards are where the bulk of the sheep are being presented, with average weekly throughput levels during March sitting 43% above the five-year trend and 30% higher than in 2018. The increased NSW mutton yarding has helped to lift the overall East coast levels during March to see average weekly levels trending 22% above the March average pattern – Figure 1.

Throughput is not the only elevated supply measure for mutton with East coast mutton slaughter also remaining elevated during March – Figure 2. Both NSW and Victorian mutton slaughter are contributing to the increased East coast total slaughter. Average weekly NSW mutton slaughter during March have been running 27% higher than the five-year average, while Victorian mutton slaughter has been 23% higher. The two states combining to see East coast slaughter averaging weekly slaughter levels that are 11% higher than the five-year pattern.

Despite the weight of supply, mutton prices managed to gain nearly 5% this week to creep back above 400¢/kg cwt, closing the week at 413¢. The prospect of rain from tropical cyclones pushing further into the southern regions in the coming week also seemed to spur on Restocker Lamb prices to see them gain over 4% to close at 644¢ – Figure 3.

The benchmark Eastern States Trade Lamb Indicator (ESTLI) managed a milder 1% lift to see it close at 647¢/kg cwt.

What does it mean/next week?:

Remnant moisture from the cyclone activity in Northern Queensland is expected to make its way into Southern regions this week, with NSW benefitting from 10-25mm falls across much of the state. It is probably not heavy enough, nor going to be sustained for long enough, to make a significant impact upon price while supply remains elevated but could encourage some minor gains.

Season improving and reflecting in prices

It looked like cattle prices were headed into the abyss, but then sellers and buyers alike saw a bit of rain on the radar and started to think they were a bit cheap. And up prices go, quicker than they came down in fact.

After a brief foray below 400¢, the Eastern Young Cattle Indicator (EYCI) retraced the heavy losses of early March this week. Figure 1 shows the EYCI finishing Thursday at 441.25¢/kg cwt. With delayed yarding data it’s a bit hard to gauge if it was supply or demand.

Looking purely at Roma, the country’s biggest store market, calf supply fell from 1,032 head last week to 215 head this week. The good rain through parts of southern and central Queensland obviously had an impact on supply.

While store and restocker prices rallied, most other categories also found some upside. The most expensive indicator in the country remains the MSA yearling in WA, at 580¢/kg cwt. In the east, Victorian Heavy Steers gained 18¢ to get back to 511¢.

Live export cattle prices fell heavily this week, at least in Darwin where Light Steers fell 40¢ back to 300¢/kg cwt. In Townsville prices were steady, but remain cheaper at 285¢/kg lwt. The floods don’t seem to have impacted prices too much.

Export beef prices held steady this week, and remain at the top of their range.  It’s hard to see beef supply improving from here, and forcing export prices lower, but we know that local supply isn’t the only driver of world beef markets.

Next week:

Figure 2 shows follow up rain for parts of Queensland spinning out of cyclone Trevor.  There is a pretty good chance this rain will see cattle prices at least steady, and probably continue to move higher.

The season isn’t assured yet, but as prices suggest, it’s looking a lot better than it was just two weeks ago.

Stock levels at the importer level

The current projections for the global crop are relatively positive. World production could be high, however there is still a long way to go. In this update we look at the stock levels held by the major importers of wheat.  

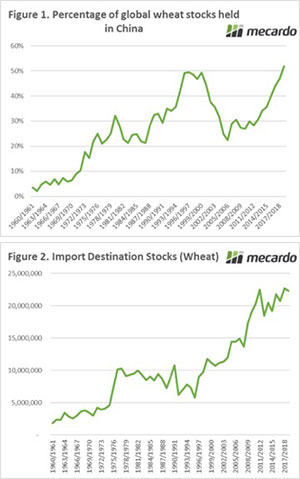
At present global wheat stocks are currently at the second highest level in history. However,  52% of the stocks are held within China (Figure 1). I have been discussing this as a growing issue for over a year (see here), so hardly a new piece of information to arrive in the market.

China as a nation is a large producer and have huge stockpiles in their inventory, yet it very rarely sees the light of day in the export market. The average exports from China since the turn of the decade have been 917kmt. The largest year of exports since 1960 was in 2007/08 with 2.8mmt. The high domestic price in China (Gov intervention) and historical precedence would point to China being unlikely to come to the aid of the global trade.

When Chinese stocks are excluded from the global situation, the world is sitting on similar levels of stocks to 2008/09 and 2012/13.

There was one big difference which isn’t regularly discussed. The stocks held by major importers of wheat. Agricultural markets work on a basis of supply and demand, however at times, we forget the demand side of the picture.

The major wheat importers in the world* seem to have learned some hard lessons from the past. The beginning stocks for this season are sitting at comfortable levels. The combined stocks at the end of this season will be the second highest on record at 22.3mmt.

Effectively import nations on a whole are better positioned for supply shocks, however a major distribution to supply would still result in price rises.

*Algeria, Bangladesh, Brazil, Egypt, Indonesia, Japan, South Korea, Mexico, Philippines & Turkey

What does it mean/next week?:

The world stocks (excl China) are at similar levels to 2008/09 & 2012/13, which were years when prices reacted strongly.

However, the import destinations are sitting on respectable stock levels.

Key Points

  • World stock levels excluding China are at similar levels to 2008/09 & 2012/13
  • The stocks held by major importers are at respectable levels.

What the.. rainfall.

When the Bureau of Meteorology (BOM) say their forecast accuracy at this time of the year is poor they aren’t kidding. Just a fortnight ago I was lamenting the poor rainfall forecast issued by the BOM in late February and just yesterday they issued a complete turnaround. Too bad it hasn’t flowed through to cattle market prices yet.

The April to June forecast shows a 50/50 chance of rainfall exceeding the median from April to June for most of the country, which is a pretty good outlook considering just a fortnight ago half of the country had a less than 20-30% chance of exceeding the median – Figure 1. Indeed, the only significant regions not likely to see rain is the far northern tip of Queensland and that’s a good thing given the recent soaking there.

Unfortunately, the extended dry conditions and the dire outlook from a fortnight ago saw many producers in Queensland and NSW offload cattle, such that East coast yardings have remained elevated for the last few weeks – Figure 2. Since the start of March average weekly cattle yarding levels have been 33% higher than the five-year average pattern across the East coast.

A breakdown across the Eastern states shows that in Queensland weekly yarding levels have been trending above average all season. The average yarding level in Queensland has been 46% higher than the five-year pattern since the start of 2019, but since the start of March this has jumped to 67% above the five-year average.

In NSW cattle throughput has been trending 12% above the five-year average pattern since the start of the year. However, since the beginning of March this has lifted to 50% above the average seasonal trend.

Victoria has been bucking the trend, with cattle yarding levels 23% below the five-year average since the start of 2019 and average weekly levels in Victoria since March haven’t been dissimilar at 24% below the long-term seasonal trend.

The supply of younger cattle in the northern saleyards has seen the Eastern Young Cattle Indicator (EYCI) slide to lows not seen since 2014 and has closed the week at 393¢/kg cwt. We are at crucial support levels now for the EYCI and after registering a mid-week low towards 385¢ managed to see price climb back towards 400¢ in the final days of the week.

In a further sign of optimism Trade, Medium and Heavy Steers along the East coast all managed a price gain this week to see them rally between 15-30¢/kg. Gains were also noted for the Western Young Cattle Indicator (WYCI) and the 90CL frozen cow export price, up 5% and 2% on the week – respectively (Figure 3).

Next week

The spread discount of the EYCI to the 90CL is now in excess of 260¢/kg cwt and is beyond levels that would be considered historically extreme. Indeed, the only time we saw the spread discount extend beyond these levels was during the depths of the 2014/15 drought and it only lasted there for a short time.

Given the updated BOM outlook for rainfall, the fact that we are at crucial support levels for the EYCI, and that the 90CL is continuing to hold firm I can’t help but think that we are at the bottom of the current cycle for the EYCI right now. As the BOM forecast shows we can always be wrong…  but I’ll eat my hat if the EYCI keeps dropping in the next few weeks.

Short sellers take profits.

After two months of almost continual declines, this week saw a strong rebound on profit-taking by short sellers. On Tuesday the Chicago market in A$/mt rose 5% or $11. The market was very short and the risks will now start to increase as the growing period progresses.

The volatile northern hemisphere market should now start to ramp up. The current outlook is reasonably favourable for the global crop, however, all that could change between now and August. Any bad news will be likely to see huge reactions, which will potentially provide pricing opportunities.

The Chinese government are yet to announce the result of their anti-dumping investigation, leaving us all on tenterhooks. In January barley exports to China were down 58%  compared to December, signifying de-risking by traders to avoid any potential un-costed tariffs/deposits.

However, pricing for feed barley has improved strongly in Western Australia (Kwinana) rising from $268 at the start of the month to $295 yesterday, back to levels in late January. Although according to sources in WA, there is little unsold by producers, it’s a good time to consider offloading old crop.

The BOM released their updated three-month rainfall projection yesterday. Although these projections can be highly dubious due to the nature of predicting weather events, they do point towards the majority of the country receiving median rainfall during the period April-June. Let’s hope they are wrong and we experience above average rainfall for this period and beyond!

Remember to subscribe to our new podcast:

Podcast

What does it mean/next week?:

Will the funds continue to close their short positions, or will we see a bearish tone descend back on the market?

Lamb prices experiencing a case of Déjà vu

Another week, and more of the same for lamb prices. While lamb producers should be happy that they’re not trying to sell cattle at the moment, many are still thinking about the prices they didn’t lock in earlier in the year, as prices drift along the same path as last year.

Since January lamb prices have been up and down. They are still better than last year but are following a similar trend and easing from January levels. Forward pricing has generally been anticipating a price rise at some stage, but it is yet to eventuate.

As outlined in our article earlier this week, lamb supply has been surprisingly strong and sheep supply has easily outstripped last year’s levels. Supply is keeping a lid on prices but, as we know, strong demand means prices have never been this strong at this time of year (Figure 1).

The only reason to really be disappointed with prices is if lambs were bought and fed. Selling these in the current market is likely to have resulted in a loss. Homegrown lambs have never made better money in March.

There is a little cause for optimism on the price front, however. The Bureau of Meteorology (BOM) is forecasting around a 50% chance of most of Victoria and NSW receiving median rainfall. Another way of looking at this is shown in figure 2. It shows the chance of getting 25mm in April. It’s pretty good for a lot of sheep country, if we raise it to 50mm, there is a lot less blue and a lot more brown.

What does it mean/next week?:

We received more correspondence this week regarding flocks consisting of fewer ewes having lower scanning rates. Again, we saw this last year and it really came home to markets from July through to September. Unfortunately to take advantage of high prices, lambs either have to be very late or very early.

What we do know is that those with the ability to carry lambs through winter, or get them up to weight early, will see some handsome payoffs.

Lamb price modelling

We’ve been working on upgrading our lamb price forecasting abilities at Mecardo and have recently developed an interactive modelling tool that allows us to forecast the annual average level for the Eastern States Trade Lamb Indicator (ESTLI) based on key supply and demand inputs.

In this analysis we take the model through a test run, playing out a handful of scenarios for the next few years to see the potential impact on lamb prices.

The forecast model uses predictor inputs such as the Australian dollar level, annual Australian lamb slaughter levels and demand metrics based on per capita gross domestic product (GDP) measures from some of our key export destinations to forecast an annual average ESTLI level.

Figure 1 shows how the model compares to the actual ESTLI since 1998, including a forecast based on financial market consensus for the A$ level over the next few years, the Meat and Livestock Australia annual lamb slaughter estimates from their 2019 Sheep Industry projections and the GDP forecasts from the International Monetary Fund (IMF).

It suggests that growing wealth from offshore consumers will keep demand strong for our lamb exports and underpin prices for the ESTLI to see it average around 840¢ in 2019, dipping to 806¢ in 2020 as lamb slaughter rates in Australia increase.

However, we can adjust the lamb slaughter levels in the model to play out a second scenario that would test what the impact of a dry 2019/2020 will have on the ESTLI if slaughter rates increase from 21.5 million head in 2019 to 22 million head and if the 2020 lamb slaughter lifts from 22.1 million head to 23 million head – figure 2. The result of the increased slaughter is to see the ESTLI forecast for 2019 drop from 840¢ to 795¢ and the 2020 forecast decline from 806¢ to 755¢.

We can also imagine a third scenario where the increased lamb slaughter levels coincide with a shock to world growth levels during the 2020 season that limits the demand for lamb exports from our key offshore destinations. This could be in the form of a Chinese credit crunch impacting upon the Asian region and/or increasing US interest rates flowing through to softer global GDP growth levels.

Scenario three forecasts the ESTLI dip in 2020 extending further on the back of the decrease in offshore demand to see it average 640¢ before recovering back above 700¢ as GDP growth recovers beyond 2021 – Figure 3.

What does it mean/next week?

Interestingly, the model predicts a continuation of historically good price levels for lamb into the next few years even after we account for unforeseen problems such as an extended dry period within Australia, resulting in higher than expected slaughter levels, and/or a short-term hiccup to world growth and red meat demand.

Indeed, the model doesn’t forecast an annual average ESTLI below 600¢ in the next four years under any of the three modelled scenarios.

Key points:

  • Price modelling for the ESTLI based on current MLA slaughter projections and global demand growth for lamb consumption estimates annual average prices above 800¢ for the next few years.
  • Assuming a drier climate and higher slaughter than currently forecast will place the estimates for the 2019 and 2020 season into the 800¢ to 750¢ range.
  • The inclusion of a demand shock due to falling growth levels could see the ESTLI annual average drop towards 650¢.

Lower style wool drags on the market

This is the third consecutive week where the market has recorded losses, with the blame sheeted home to the drought on the east coast and the subsequent diminished supply of better style wool.

AWEX report that the national average yield on Merino fleece for the week was 63.6%, the lowest level in over 10 years.

The Eastern Market Indicator (EMI) again pulled back over the week, falling 29 cents or 1.4% to 1,979 cents. The Au$ was slightly stronger, which didn’t assist buyers with the EMI in US$ terms down by just 18 cents to end the week at 1,397 US cents (Table 1).

In Fremantle, the Western Market Indicator (WMI) gave up another 30 cents on the back of 20 cents fall last week to settle at 2,127 cents.

40,785 bales were offered for sale this week, 4,345 fewer than last week with the trade clearing 35,682. This is 5,484 bales less than last week, however the cheaper market left sellers unimpressed with 12.5% or 5,103 bales passed in. This Pass-In rate is the highest since last November.

In the auction weeks since the winter recess, 1,020,385 bales have been cleared to the trade, 193,235 fewer than the same period last year. The average shortfall cleared to the trade compared to the same time last year now sits at 6,663 bales per week fewer.

The dollar value for the week was $74.77 million, almost $15.0 million less than last week for a combined value of $2.40 billion so far this season. A simple calculation of $ value divided by bales sold gives us $2,095 per bale across all types, exactly $100 per bale lower than last week.

Crossbred types weren’t missed either, losing between 25 & 40 cents for the week.