Category: Lamb

Lamb and sheep spreads across the states.

Price volatility, market uncertainty and climate variability across regions can play havoc with the normal seasonal spread behaviour between categories of sheep and lamb. With the Eastern States Trade Lamb Indicator (ESTLI) coming off record highs, the ongoing live sheep export issues facing WA producers and dry conditions affecting NSW producers we thought it time to assess the state of play with regards to state spread behaviour for a range of categories of lamb and sheep.

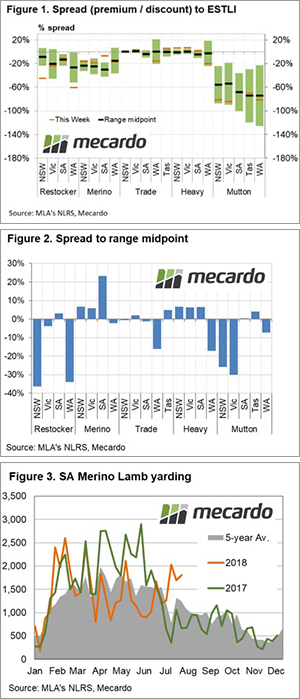
Analysis of percentage price spread discounts and premiums for a variety of categories of lamb and sheep across the states is shown in Figure 1. The orange dash signifies where the current price spread premium or discount is sitting relative to the ESTLI.

Overlaid on the chart is the historic mid-point for the spread, which gives an idea of the average seasonal spread level for this time in the year (black dash), and the normal seasonal range (green columns). The green columns show where the spread has fluctuated 70% of the time during this part of the season for the last decade.

The current discount spread for NSW Restocker Lamb shows that they are very much underpriced compared to the ESTLI with the spread level sitting well below the normal range at a discount of around 45% to the ESTLI. This is unsurprising, given the dry conditions facing producers in NSW now.

Interestingly, the WA Restocker Lamb spread shows a similar picture to the NSW situation, with the discount spread of around 60% to the ESTLI sitting below the normal seasonal range. The seasonal conditions in WA haven’t been as dire as those facing NSW producers but perhaps the uncertainty around the live export trade is giving WA producers second thoughts about building up flock size.

To get a quick snapshot of the categories of lamb and sheep that are significantly above or below the normal level we have produced a chart that shows the percentage that the current spread level is above or below the average midpoint level (Figure 2). Along with Restocker Lamb in NSW and WA it shows that WA Trade Lamb, WA Heavy Lamb and NSW/Victorian Mutton are all registering below par spread performance at the moment.

However, on a positive note, the South Eastern mainland states Merino and Heavy Lambs are faring relatively well, registering current spread levels that are 5-25% above the norm. The stellar performance of wool prices this season is underpinning Merino Lamb prices and is appearing to keep the Merino spreads to the ESTLI in good shape.

What does it mean/next week?:

The SA Merino Lamb spread is performing particularly well compared to the other state Merino classes. This seems to have drawn out a few more Merino lambs in SA in recent weeks with the yarding level trending around 45% above the seasonal average (Figure 3).

The additional supply of Merino lamb in the SA saleyards is likely to put pressure on the spread in the coming weeks to see it move back toward more normal seasonal levels.

Key points:

  • WA lamb and sheep spreads to the ESTLI have been underperforming in recent weeks which suggests that the uncertainty around the live sheep export situation may be having an impact on price.
  • NSW Restocker and mutton spreads showing the most impact from the dry conditions.
  • Merino and Heavy Lamb spreads in the South Eastern mainland states are performing best, with SA Merino Lamb doing particularly well.

A bit of red ink on the sheep.

The rally in lamb and sheep prices has come to an end, for now. Trade lambs lost a little ground, heavy lambs are as rare as hens teeth, and sheep supplies seem to have started to flow. Restocker lambs can’t find any friends, as expected in dry times.

We’re not sure if they are leading indicators, but restocker lambs and the mutton prices both tanked this week. Figures 1 and 2 show a drop for restocker lambs of 96¢ and 47¢ for mutton prices, both to levels near those of this time last year.

The Eastern States Trade Lamb Indicator (ESTLI) lost just 10¢, so still hasn’t managed to breach 800¢ yet. The ESTLI finished Thursday at 788¢/kg cwt, while Heavy Lambs remained the star of the show at 842¢. Weight remains king in the lamb market, and while mutton and restocker lambs are priced pretty well historically, rising feed costs means the cost of getting weight in lambs, or wool on sheep, is getting prohibitive.

Lamb slaughter for the week ending the 27th of July finally slipped below last year’s levels. We’re still thinking that a lot of light lambs are being slaughtered, which is propping up the number of head, but the production of lamb meat is likely to be back.

Mutton slaughter last week ramped up significantly (Figure 3), hitting the highest weekly level since December 2015. It’s little wonder mutton prices took a hit. Sheep slaughter doubled in NSW and was up 61% in South Australia.

What does it mean/next week?:

The Bureau of Meteorology (BOM) released another depressing three-month outlook earlier in the week, forecasting 20% chance of better than median rainfall across most of NSW and Victoria.  This doesn’t mean it’s not going to rain, it just means chances are there won’t be a lot of it.

As such, the current dynamics afflicting the market, being a good supply of light lambs and tight supply of finished lambs, is likely to continue.

Wool Economics 101

In our lamb analysis this week we have looked at the demand-based reasons as to why the Eastern States Trade Lamb Indicator (ESTLI) has been on the improve since the 2000’s. Given the market recess for wool, we thought a demand and supply retrospective would be of benefit too, in order to help explain one of the key drivers for surging wool prices.

The Mecardo Lamb analysis that focuses on demand curve shifts that have led to higher lamb prices can be viewed here.

The laws of economics state that demand curves have an inverse relationship to price. This means that as prices increase the quantity demanded declines and as prices drop the quantity demanded increases. This is outlined by demand curve D1 in Figure 1.

On the other hand, supply curves have a direct relationship to price. As prices rise so does the quantity supplied and as price falls the quantity supplied is lower, as highlighted by the supply curve S1 (Figure 1).

Market forces will act to push the price to an equilibrium level where the quantity demanded is equal to the quantity supplied. This is where the demand and supply curves intersect at a price level of 400 and a quantity of 22 units –  point E1 on Figure 1.

In the case of the wool market, there has been a steady decline in wool supply since the collapse of the Reserve Price Scheme in the early 1990’s and the gradual switch from wool production to cropping. As such, for every price level, the quantity of wool supplied is now lower. This can be represented on the demand and supply diagram as a shift in supply to the left, with the supply curve moving from S1 to S2 (Figure 2). The new equilibrium level (E2) under this scenario of reduced supply is shown as a price of 600 and a quantity of 20 units. In this circumstance, the price has been driven higher by a contraction in supply over time.

Analysis of the wool market supply (bales produced per year) and price (Eastern Market Indicator – EMI) since the early 1990’s confirms the theory that reduced supply has been a key driver of higher wool prices. As identified in Figure 3, annual total wool bale production has declined from over 4.5 million bales in 1992 to under 2 million bales in 2016, with the EMI more than doubling over that time frame from 600¢/kg clean to over 1200¢/kg.

Key points:

  • Supply of wool has been in decline since the early 1990s and is a key underlying reason as to why wool prices have been increasing over time.
  • The annual level of wool bales produced has more than halved over the last two decades which has coincided with wool prices more than doubling in value.
  • In recent years the wool supply has stabilised, yet prices have continued to climb suggesting demand led factors are behind the current market rally.

Lamb Economics 101

In last week’s piece on deflated lamb prices, we mentioned that the underlying reason behind the increased lamb prices we have seen since 2000 has been increasing demand. This analysis highlights the lamb demand curve and shows why prices have risen despite increasing levels of lamb slaughter and production.

Recap on the deflated lamb price article here.

Before we cover how the demand for lamb has shifted over time it is probably prudent to provide a summary of the basics of demand and supply curves. Economic theory states that demand curves have an inverse relationship to price, or as prices rise the quantity demanded falls and as prices fall the quantity demanded rises. This is outlined by demand curve D1 in Figure 1.

In contrast, supply curves have a direct relationship to price. As prices go up so does the quantity supplied and as price goes down the quantity supplied is reduced, as highlighted by the supply curve S1. In a market, the competition between buyers and sellers act to push the price to an equilibrium level where the quantity demanded is equal to the quantity supplied. This is where the demand and supply curves intersect at a price level of 400 and a quantity of 18 units –  point E1 on Figure 1.

Let us assume that in this market something happens, other than a change in price, that increases the demand for this product. This could be a successful advertising campaign for the product, an increase in income levels for the people that buy this product or perhaps a competing product become more expensive, leading to buyers shifting their preferences to this product. This would mean that for every price level, there is now more quantity demanded and this is represented by a shift to the right of the demand curve to a new spot, D2 on Figure 2. The new equilibrium point in the market is now established at point E2, at a higher price of 500 and a higher quantity of 19 units.

Effectively this has what has been happening in the lamb markets since around 2000 onwards. We have been seeing successive shifts to the right in the demand curve as the demand for lamb increases. We can see the plot of the demand curves for lamb as highlighted in Figure 3. Annual average price levels based on the Eastern States Trade Lamb Indicator (ESTLI) have been plotted against annual average lamb slaughter levels to estimate the situation of the demand curve at different points in time.

There are some more Economics 101 lessons in the Mecardo Wool analysis this week that focuses on supply curve shifts that have led to higher wool prices.

What does it mean/next week?:

The current surge in lamb prices suggests that the demand curve for lamb may have shifted further to the right again, fueled by a growing Asian middle class, a series of successful Meat and Livestock Australia marketing campaigns and a reduction in supply from our only export competitor, New Zealand.

The step ups in lamb prices, outlined in last week’s article on deflated prices tend to coincide with the shifts in demand outlined in Figure 3. Furthermore, the current demand curve shows that if there are no more shifts in demand in the coming years its likely lamb prices may soften back towards the mid 500¢ level for the ESTLI by 2022 as production and slaughter begin to increase. However, if the dry persists and the flock rebuild is delayed, the ability to increase production will be constrained, leading to sustained prices at current levels.

Additionally, if demand can stage another shift to the right beyond the next few years (as Asian buyers continue to become wealthier) there isn’t any reason why we can’t see an ESTLI of 900-1000¢ as we head towards 2025.

Key points:

  • Since 2000 the lamb demand curve has continued to shift to the right, signifying that factors other than price movements have been responsible for an increase in demand for lamb.
  • The shifts in the demand curve have coincided with intervals in time when the ESTLI has seen a step-up in the trading range.
  • Growth in Asian wealth, successful marketing campaigns by MLA for Aussie lamb and a reduction in NZ supply are all reasons why demand for Australian lamb has increased since 2000.

Hilltop lambs in the nosebleed section

Robust lamb prices have been encouraging Victorian producers to come forward with lambs earlier than usual, but a dip in throughput this week has seen the Eastern States Trade Lamb Indicator (ESTLI) rocket to a breath away from the 800¢ barrier.  

Trade lamb prices across the East coast during July have been averaging 21% above this time last season and the strong performance has been inspiring producers to come forward with stock, particularly in Victoria.

East coast lamb yarding levels have been trending 23% above the five-year pattern for the first three weeks of July as highlighted on Figure 1. East coast lamb throughput boosted by Victorian numbers which had been trekking nearly double the normal levels during July attracted by prices above 700¢.

However, this week East coast lamb yardings eased 9%, moving back into a more normal seasonal range and the result of the relatively tighter numbers at the sale yard was to see a 5% price spike for the ESTLI to close yesterday at 798¢/kg cwt.

In a classic example of text book Economics, East coast mutton did the exact opposite to lamb, as the increased numbers of sheep recorded at the sale yard this week pressured the mutton indicator down 7% to close at 480¢/kg cwt.

East coast sheep yarding continuing to trend well above the seasonal average and above the normal range that could be expected for this time of the year – Figure 2. Mutton yardings jumping 15% on the week to sit 48% higher than the seasonal average.

The jump in local lamb prices flowing through to higher offshore prices this week with the ESTLI in US$ terms climbing to 590 US¢/kg – Figure 3. It’s interesting to note though that during the 2010/11 season lamb prices in US terms have been higher than where they are now, despite the record local prices. Indeed, when the A$ was above parity against the US$ in 2011 saw the ESTLI in US terms peak at 673 US¢. Mathematically speaking if the ESTLI was to reach toward the 670 US¢ level with an A$ back at the 75US¢ level that would translate to an ESTLI in local terms of around 890¢.

What does it mean/next week?:

It’s unlikely that we will see the ESTLI get to 890¢ this season with the Spring flush approaching. Even if there are less Spring lambs around this season, which is quite likely given the dry conditions we should still start to see the normal seasonal Spring price decline as we head out of Winter.

Some reasonable rain falls for WA and Victorian sheep rearing country is expected for next week but probably won’t be enough to support another strong rally in prices with them already being up in the stratosphere as it is. We are in nosebleed territory at the moment with these high-altitude lamb prices so it wouldn’t take much to see a little bit of a dip back toward the mid 700¢ region in the coming weeks.

Lamb has been more expensive in US terms.

Earlier in the week, we looked at lamb prices in deflated terms, and they are indeed near record highs. We know that export markets are helping drive lamb prices, so it’s worth assessing whether lamb importers are also forking out record dollars for lamb.

When I started researching this article, I was sure that at some stage in the recent past there was an outlandish claim somewhere amongst the articles stating that lamb prices could get to $8. It took a while to find, but it was there (Read here).  The forecast was, admittedly, not made with a lot of conviction, but the thinking behind it was basically the price of lamb in US dollar terms.

Even with the Eastern States Trade Lamb Indicator (ESTLI) sitting just shy of 800¢, in US terms the ESTLI still isn’t at a record (Figure 1).  Back in 2011 when the Aussie dollar was at or around parity with the US dollar, the ESTLI in US terms was at 670¢/kg cwt. This week the ESTLI remains below this, at 588¢/kg. Lamb prices are not cheap in US terms, but they have been more expensive, albeit only for three months.

The peak of lamb prices in US terms is still 14% away in nominal terms, and obviously further in real terms. If the exchange rate stays steady, and the ESTLI reaches 670¢ in US terms, it puts the ESTLI in AUD at 905¢/kg cwt. Those who study Meat and Livestock Australia’s (MLA) saleyard reports will have seen plenty of lambs making more than 900¢, so it’s possible the indicator could get there, although unlikely.

For mutton, the upside seems to be stronger. Figure 2 shows the National Mutton Indicator (NMI) in US terms on a financial year on year basis. The current close to record mutton values are still 23% behind the record price in US terms set in autumn 2011.

While the dry weather has seen lamb supply tighten, it is still seeing sheep coming to market and keeping a lid on mutton values, to an extent.

What does it mean/next week?:

Looking at lamb prices in US terms helps go some way to explain how strong prices can be at the moment. While lambs prices are extraordinary in our terms, they are ‘only’ 20% above the levels seen for most of 2017 for importers. This might be sustainable for the short term and the good news is that it makes prices of 600¢ seem cheap.

There is still plenty of upside for mutton, especially when it rains. Strong lamb and wool prices are likely to see a real squeeze on the supply of older sheep over the coming years.

Key Points

  • Lamb prices in US terms are strong but have been higher back in 2011.
  • There is still a 10% upside for lamb to reach the 2011 records in US terms.
  • There is more upside for mutton prices than lamb, as it was 20% stronger in 2011 in US terms.

Heavy lambs closing on 800¢.

This time last year lamb prices were great, sitting north of 600¢ at record highs. Who would believe prices a year later could be more than 100¢ higher? It seems unbelievable, and still, we have slaughter higher than this time last year.

Lamb prices have continued to rise and in the last fortnight, it has been Heavy Lambs which have taken the lead (Figure 1). Heavy lambs gained another 50¢ this week, to within striking distance of 800¢, sitting just below at 793¢/kg cwt. The Eastern States Trade Lamb Indicator (ESTLI) is ‘languishing’ at 758¢ after having gained 34¢ this week.

Supply is not as expected, with lamb slaughter to the week ending the 13th of June actually 3% higher than this time last year (Figure 2).  We won’t be able to confirm until more data is available, but slaughter weights must be on the wane. Prices started from light and Merino lambs at 680 and 675¢/kg cwt respectively, with trade and heavy lamb’s streaks ahead.

The strong prices have drawn out a lot of lambs to the market, with very few left to fill the heavy lamb space, which explains the extreme values. Lighter lambs are being sold as soon as they make slaughter weights and as such prices are lower but still at historical records.

Mutton values have stalled just above 500¢, but they too are well ahead of this time last year (Figure 3).  Mutton will continue to come to market while the rain stays away, which means prices might not move too much higher until there is some precipitation.

What does it mean/next week?:

How many producers would have the guts to forgo a trade lamb price of 750¢ in order to put another couple of kilos on and get 790¢? Not many it would seem, but it has paid off over the last month.

Southern WA, SA and Victoria are in for some follow up rain this week, which is unlikely to help lift sheep and lamb supply. Nothing is on the forecast for NSW, so the sheep will continue to flow while prices are good. The question now is, where are the sheep going to come from when it finally does rain?  The sheep/lamb spread could get very narrow.

Is it viable to feed lambs yet?

We’ve fielded some queries this week as to when sucker lambs might hit the market. One option is to lot-feed lambs to get them finished quickly. This week we crunch the numbers on feeding lambs and see if there is money in it, or if there might be under a few different scenarios.

Last week, we analysed the NSW restocker lamb market relative to the Eastern States Trade Lamb Indicator (ESTLI) and the last week has seen it hit new lows. The NSW restocker spread to the ESTLI fell to negative 166¢/kg cwt (Figure 1). This not quite at the level of 2008, but the rise in the ESTLI to 744¢ and the fall or the NSW restocker to 578¢/kg cwt has the spread at a five year low.

The lack of grass and rising grain prices are driving the relatively weak restocker lamb prices. But are we now at a level which makes feeding lambs viable?  The answer is yes, but as always, a lot depends on the sell price.

Figure 2 shows the gross margins and the margins after feed or lotfeeding 32 kgs lambs to 46kg liveweight for the trade market. The cost of feed is based on a grain ration costing $450/t, with lambs eating 6kgs to gain 1kg liveweight.

At a buy price of around $82/head and a sell price of 550¢/kg cwt, or $116/head, feeding lambs will produce a small loss, and a bigger one if labour and other costs are included. If we factor in a fall in the trade lamb price to 650¢ the margin after feed is profitable, while a lamb price of 700¢ will see good margins after feed of $27 per head.

There is a reasonable chance that feeding lambs in NSW will turn a profit. However, the fact that prices basically need to stay in the territory which was uncharted prior to 2018, would make producers looking at feeding nervous about adding extra costs in an already tough year.

Additionally, getting lambs up to feedlot entry weights may not be that easy, and will require more feed and effort. This makes the simple option of selling more attractive.

What does it mean/next week?:

The fact that there is likely some profit in feeding lambs means we might start to see lambs appear on the market 6 weeks later than normal, but the numbers will be nothing like the traditional sucker supply.

In Victoria, restocker lamb prices are still relatively expensive, coming in $14/head higher than NSW for 32kg lambs. This limits the viability of grain feeding in the south, which might slow the supply of southern lambs.

Again we are left with the supply gap which is currently seeing the lamb market at record highs continuing on for at least another month to six weeks yet.

Key Points

  • The NSW restocker lamb price reached new five year lows relative to the ESTLI this week.
  • Cheap restocker lambs make feeding lambs viable if finished lamb values can maintain strength.
  • Lamb feeding is unlikely to close the supply gap of late suckers completely, with support for prices to stay for another month to six weeks.

Livestock commodity prices on top of the heap

Commodity prices halve and double as the old saying goes, working their way through price cycles usually driven by internal factors and occasionally by an external factor such as the international financial crisis in 2008-2009. This article takes a look at the current price ranks for broad acre commodity prices in Australia.

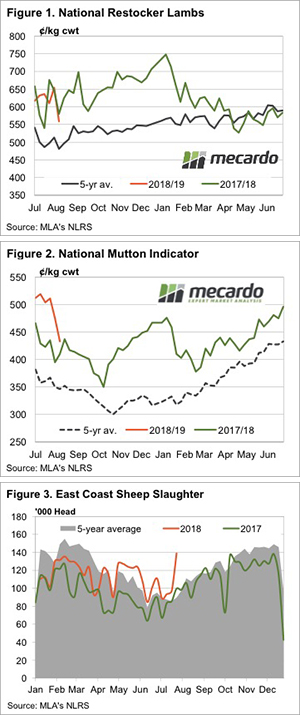
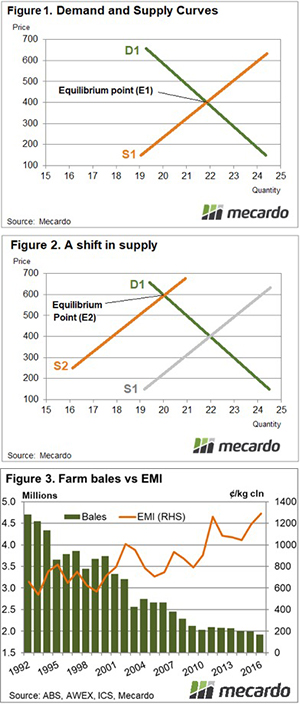
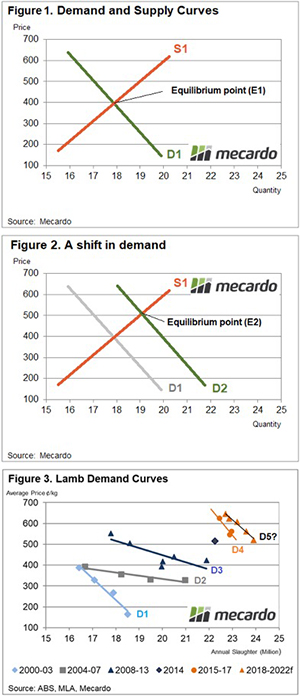
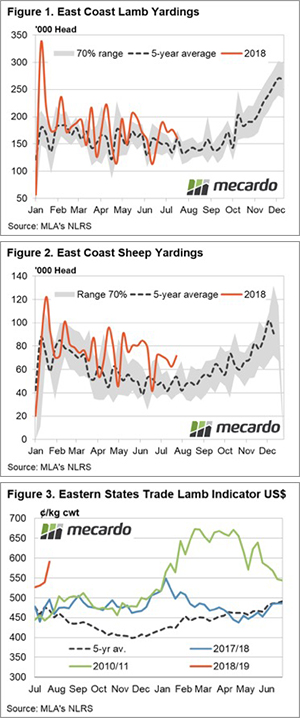
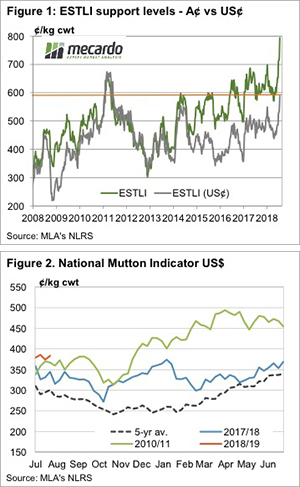
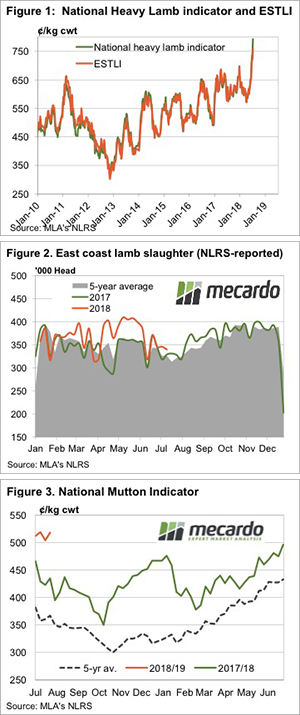
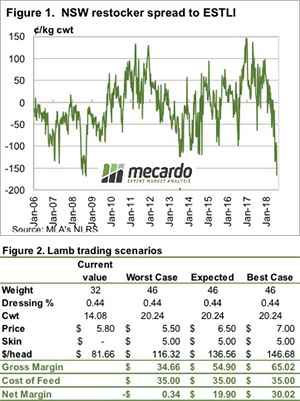
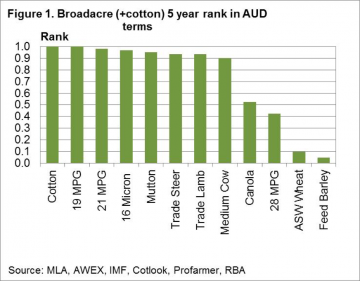
Figure 1 shows the January 2017 five year price rank for a range of broad acre (plus cotton) commodities grown in Australia. The price rank is looked at in Australian dollar terms, as farmers here in Australia see the prices.Basically the news is all good for livestock products (wool and meat) with the exception of crossbred wool (represented here by the 28 MPG). Five year price ranks are all in the top decile, meaning they have traded at lower levels for 90% of more of the past five years. Cotton also is trading in the top decile. At the other end of the scale lie canola, wheat and barley, with canola performing reasonably well by trading at median levels. Wheat and barley are in the bottom decile for the past five years.

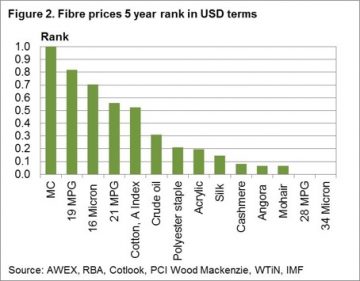
The next step is to look at these commodity prices from outside of Australia. In this case we use US dollar five year percentiles and break the commodities into groups. Figure 2 looks at fibres, including wool from Australia and a range of other apparel fibres. The price ranks range from a high top decile performance by the Merino Cardings indicator through to bottom decile performances by cashmere, angora, mohair and crossbred wool. The merino combing indicators perform well (ranging from the sixth to the ninth decile) well above oil and the synthetic fibres. Cotton comes in close to the 21 MPG in the sixth decile. The longer the disparity continues between the high merino rankings and lower rankings for the major fibres, the more likely some demand will shift out of merino (especially the broader side of 19 micron) to alternative fibres.

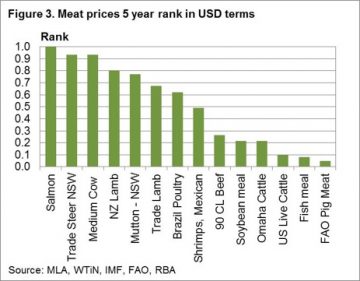
Figure 3 looks at meat and protein prices from around the world. Salmon is the best performer followed by Australian beef and Australasian sheep meat prices. At the other end of the rankings are range of US beef quotes, along with fishmeal and the FAO pig meat index. The big discrepancy between Australian and US beef price ranks indicates some risk to Australian prices if US prices do not lift.


Key points:

  • Meat and wool prices in Australian dollar terms are trading in their respective top decile for the past five years, with the exception of crossbred wool.
  • Grain prices are at the other end of the spectrum with wheat and barley prices in the bottom decile.
  • In US dollar terms merino wool prices are performing the best amongst apparel fibres.
  • Australian beef prices are in the upper deciles in US dollar terms while US beef prices in the lowest deciles.


What does this mean?
Commodity prices rise and fall. Currently merino wool prices are outperforming other apparel fibres, but this outperformance will be gradually eroded by the supply chain adjusting it mix of fibres to contain cost blow outs form the recent strength in the wool market. High prices sow the seeds for lower demand later. For beef the risk looks to be the marked difference in US dollar price rankings between Australian and US prices. Australian prices can outperform by so much only for so long.