Category: Market Analysis

Who let the dogs out?

Key Points

  • There are 5.1 million dogs in Australia. One for every 4.9 people.
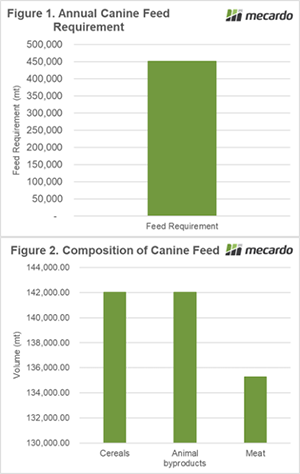
  • The theoretical dog food demand is 451kmt.
  • This comprises 135kmt meat, 142kmt cereals and 142kmt animal byproducts.

I was pawndering the value our canine friends had on the grain market.  So now is a good oppawtunity to do some ruff calculations on the impact of dogs, and put a new leash of life on supply and demand. Let’s get into the ultimutt review of man’s best friends dinner.

Animal Medicines Australia is the peak body representing the leading animal health companies in Australia. They produced a national survey of pets in Australia (2019) which highlighted that there were a whopping 5,104,700 dogs in the country. That represents 1 hound for every 4.9 humans.

There are many different breeds ranging in size from the diminutive chihuahua to the gargantuan great dane. Therefore, its necessary to work what is the average size of an Australian dog. This is where the Australian National Kennel Council helped. They produce an annual report on the number of animal registrations for their membership on a per breed basis, which represents 67,900 dogs.

The Australian National Kennel Council is the administrative body for pure breed canines in Australia. It would be logical that their registrations would be representative of the overall population.

However, this dataset does not include the weights of each breed. So to provide a robust analysis for our readers I spent my night finding the average weight for each of the  220 breeds of dog listed. I was then able to produce a weighted average of dogs to determine what is the average dog weight. Through an analysis of the 2010-2018 year average, the weight is 22kg per dog.

The feed requirements for dogs are based on a conversion of grams of food per kg of bodyweight. There are numerous levels quoted by different manufacturers, however I have opted to go with 11g per kg of bodyweight.

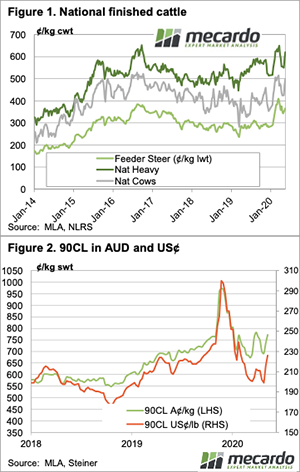
On our average dog size of 22kg, this amounts to 242g of food per day. Across our average population of dogs this is a whopping 1235mt of food fed to dogs every day or 451,000mt per year (figure 1).

A highly esteemed pet food expert informed me that pet food sold in Australia is roughly on a 70% dry to 30% wet (canned meat) basis. Additionally, the composition of dried products is approx. 45% cereals and 45% animal by products.

We can then refine this further into three main dog food elements:

  • 135,300mt of meat in the form of canned products
  • 142,000mt of meat byproducts
  • 142,000mt of cereals*

It must be noted that this is a theoretical feed demand for dogs in Australia. There are a few caveats to this analysis:

  • Not all dogs eat store bought food. This analysis does not consider the feeding of food scraps etc.
  • Although the local demand is theoretically >450kmt, there are volumes of pet food imported into Australia.

*Cereal incorporates wheat, sorghum, corn, rice, barley and byproducts (soymeal etc).

What does it mean/next week?:

Pet food is an oft-forgotten industry in Australia. However, this analysis shows that they are an important part of a diversified agricultural supply chain.

As we potentially move into a future with more home-based working, we could see an increase in the dog population as workers look for company at home.

If we want to decrease our reliance on agricultural exports, we should consider supporting great dane breeders. As a move to a 100% great dane population would increase demand to approx. 1.5mmt per year.

Some positive signs amid the turmoil

The last week has seen some good news on the export front, with increasing volume to China, and some bad news, with the suspension of some plants. The news from the US was more positive this week, and while it’s not responsible for local price rises, it helps.

Despite the suspension of four beef processors from exporting to China this week, prices managed to gain ground. The Heavy Steer was the star performer, with the CV-19 National Indicator gaining 15¢/kg lwt, to get back to 335¢/kg. This week’s move puts the Heavy Steer back within 10¢ of the all-time record set back in March.

Cows and Feeders also gained ground, although they weren’t quite as strong (Figure 1). Tightening supply is no doubt helping prices higher, both at saleyard and over the hooks level, but improving export prices are playing a part.

Figure 2 shows the 90CL Indicator has lifted in both US and AUD terms (Figure 2).  Steiner report that many US users are short stock, as they took a wait and see approach in April, and now need to stock up.  Additionally, US Cow slaughter has been down, as with all cattle, and lean beef in general is in short supply.

The backlog of overfed cattle in the US might see continued lower Cow slaughter and provide some support for our exports over the medium term.

Despite the cattle backlog, US Live Cattle Futures bounced higher this week, moving back its highest level since mid-March.  More positive signs of some resilience of beef and cattle demand.

Next Week.

It is hard to see cattle supply improving as we move toward winter.  In fact, it should get tighter.  Stronger export prices will be required to see prices keep rising in a similar trend to the last couple of weeks.


Market takes a breather

After four weeks of losses and continuing uncertainty as to the full impact of the COVID-19 effect on the wool supply chain, this week the market settled posting modest gains. The market has a range of differing circumstances; Merino wool with good measurements is sought after, while lower style types and crossbred wools are not receiving anywhere near the same interest.

The Eastern Market Indicator (EMI) lifted by 9¢ for this week to close at 1,179¢, while the Australian dollar was up 0.44¢ to US$0.676, which contributed to the EMI in US$ terms also rising by 11 cents to 764¢. The Western Market Indicator didn’t fare as well, falling 9¢ to close at 1,237¢.

Turnover this week was up slightly at $27.79 million or $1,303 per bale, taking the year to date value to $1,831 million.

The response to the stronger buyer interest in the market was the halving of the pass-in rate, this week down to 8.8%, resulting in 21,315 bales clearing, 654 more than last week. Contributing again was a large withdrawal prior to sale of 12% of the original offering. AWEX noted that the national offering is 10.9% lower when compared year-on-year.

The rises were across the board for Merino types, with stand-out rises of 40 cents plus for 16.5 MPG in Sydney, as well as the 18 MPG in Melbourne & Fremantle along with the 19 MPG in Melbourne. Crossbred types were generally 20 cents off the pace, while Cardings held steady in all centres.

The week ahead

Next week’s national offering is just 21,690 bales with Sydney & Fremantle only selling on one day while Melbourne will offer on Tuesday & Wednesday.

Unfortunately, the early strength this week did not continue to the close of selling, with Melbourne and Fremantle reporting an easier trend on the final day.

Supply dearth provides support

Key supply metrics remain below their normal seasonal range for lamb and sheep markets. The tight supply has provided a lift in prices for all Covid19 reported indicators from Meat and Livestock Australia this week.

Weekly east coast lamb slaughter volumes have gained slightly on the previous week but remain well below normal levels for this time in the year – Figure 1. Compared to the five-year average pattern lamb slaughter is 26% below the seasonal trend and 28% under the volumes processed this time last year.

It is a similar picture of tight supply for sheep slaughter volumes too – Figure 2. Weekly east coast sheep slaughter is sitting 41% under the five-year average and 46% below levels recorded for the same week in 2019.

Sale yard throughput is following the same story. East coast lamb yarding levels are 27% under the five-year average trend and 34% softer than this time last season. Sheep yarding levels are even tighter with figures reported 45% under the seasonal average and 54% below the 2019 trend – Figure 3.

The dearth of supply is providing a boost for prices this week, particularly for the Covid19 Mutton Indicator which posted an 8% gain to close at $167/head. The Processor Lamb Indicator put in a respectable 3% lift to $203/head, while Restocker Lambs managed a 1% rise to $154/head. While the price rise is a welcome positive for producers the shortage of supply came a little late for this analyst as I could have used it last week for a May the Fourth Star Wars pun – maybe next year.

What does it mean/next week?:

Next week shows enough rainfall in sheep rearing regions across the east coast to keep prices supported, particularly in Victoria with falls between 10-15mm anticipated across much of the state.

Most of NSW and the southern regions of SA are only likely to receive between 1-5mm but that should be enough to keep the marking holding firm given the tight supply situation is likely to continue throughout autumn/winter.

Whilst some work with ambiguity the market has direction (unfortunately)

Key Points

The world is slowly creeping out of isolation and there is still a large degree of uncertainty about the road ahead. Will there be a second wave? Will the economy recover? The wheat market, however, does not lack direction, it has got direction and it is in one way.

The Chicago wheat futures market has declined further this week. There has been continual deterioration with no days of gains since last Thursday. The market (in A$) has been in almost a continual downward direction since the 23rd of March, when the December contract hit A$355. This same contract is now A$293/mt (Figure 1).

The USDA released their May WASDE report. This was a bearish report and has added extra pressure onto the market. Global supplies of wheat are expected to be record high, with at the end of this season the largest stockpiles of wheat the world has ever experienced (Figure 2).

As discussed numerous times on Mecardo, the corn market has been under pressure in recent months due to the demand destruction caused by reduced ethanol demand. Ethanol production will likely rebound when the economy reopens, albeit slowly if unemployment levels remain high. The result being that corn end stocks will be close to record high on a global level. In the US end stocks will be the highest since the late ’80s.

Corn and wheat are irrevocably linked. If corn continues to be under pressure, it is likely to see wheat fall in sympathy.

The USDA reported that Australia would be up year on year by 8mmt to 24mmt. The range at present is likely to be 24-27mmt based on the current outlook.

What does it mean/next week?

The world continues to be awash with cereals. The COVID-19 economic impact has raised new issues around demand which is likely to cause a large degree of uncertainty in the coming months.

A sharper rebuild at cost of supply

Key Points

  • MLA’s Cattle Industry Projections update shows even tighter supply in the coming years.
  • The herd rebuild is expected to be a bit quicker with better seasonal conditions.
  • Tight supply should support prices, but demand is highly uncertain.

Meat & Livestock Australia (MLA) have updated their cattle industry projections for April, with the key factor being going from hoping for a break in the drought, to actually receiving some rain. The updated outlook suggests a faster herd rebuild, but it’s going to cost in terms of cattle supply for the next.

The cattle herd is still expected to set an unwanted record on the 30th of June, but now the forecast is set to be slightly higher than previously thought. The updated Cattle Industry projections peg the herd mid-year at 24.8 million head.

Figure 1 shows the herd projection for this year is 100,000 head higher than the January projections. While this is minuscule in the scheme of things, it is a reflection of tighter slaughter in the first quarter of 2020.

Out to 2023, the improved seasonal conditions have seen herd levels revised from 1.8 to 2.5% higher. Despite the higher herd projections, we are still set for a 27 year low for the herd this year. It is also expected to take until 2022 to get back to herd levels of last year, and even in 2023 it won’t quite be back to 27 million head.

To achieve a faster rebuild of the herd, there have to be fewer cattle going to slaughter.  MLA’s have adjusted cattle slaughter down in all projection years except 2023. The biggest declines are expected this year and next, with projected slaughter down 4.2% (Figure 2).  This year cattle slaughter is expected to be 6.9 million head, a 24 year low. A new low water mark is forecast for 2023, with 6.8 million head the lowest since 1989.

Cattle slaughter is expected to remain relatively tight in 2022, still under 7.5 million head, and only returning to the ‘normal’ levels of most of the 2000-2010 period in 2023. Figure 2 clearly shows the boom and bust cycles for the last 10 years, with droughts and strong slaughter followed by wetter periods and very tight supply.

What does this mean?

It should be relatively comforting for cattle producers that while we are entering a period of uncertainty in regards to demand, tight supply will at least offer some support for cattle prices.  At what level is something we’ll look at next week.

There is even some time for demand to recover, and help values rise before supply will be back near what could be considered ‘average’ levels.


Barley investigation due soon

Key Points

In this week’s market comment we take a look at the new-old crop spread, the discount for barley and the Chinese anti-dumping investigation.

At a local level, the new crop ASX lost A$1 during the past week, however, old crop suffered with the spot contract falling A$11 (Figure 1). In recent articles, we’ve discussed that the very strong premium for old crop would likely come under pressure.

The premium is in place due to the demand caused by diminished supplies in 2019/20, however, this will erode as we approach new crop. There may be times when the old crop pricing spikes up when large consumers attempt to cover requirements. It is important to realise that new and old crop are quite different beasts – do not base your expectations of price on the current year drought premium.

Barley has followed the rest of the market downwards in recent weeks. This has caused the spread between ASW and F1 to rise to high levels. As an example, the Geelong spread is A$79. This has caused more domestic consumers to increase their inclusion of barley in rations.

The barley market is likely to be quite interesting in the coming weeks. The long-awaited result of the Chinese allegations of barley dumping during 2016 is due by the 20th of May.

As many will remember, 2016 was a big production year and prices followed their expected course. If China does find Australia ‘guilty’ then it could lead to tariffs being put in place which would potentially make Australian barley uncompetitive versus other origins (or other grains).

At present, it is difficult to see which way the result will go. In light of recent diplomatic woes between the two nations (see here), it wouldn’t be a huge surprise to see this decision going against Australia. However, that is just speculation.

What does it mean/next week?:

Next week will see the WASDE report released. This will give some insights into the expectations for the coming crop.

We will likely see reduced demand at least for corn due to the lower ethanol production in the US.

The trend (down) continues

It is difficult reporting weekly on the continuing demise of the wool market, with price decline now seemingly a weekly occurrence. AWEX noted that at least the market has been able to continue “with all industry stakeholders working together to ensure that wool auctions continue”.

While this is certainly a good effort, allowing producers to get wool to market and exporters to buy, it is small consolation. In the ten selling weeks since the beginning of March, the EMI has fallen 390¢.

The Eastern Market Indicator (EMI) fell by 55¢ for this week to close at 1,170¢, its lowest close since 2015. The Australian dollar was down for the week by 1.02¢ to US$0.643, which caused the EMI in US$ terms to come off 48 cents to 753¢. This puts the US$ EMI at its lowest point in almost 10 years. The Western Market Indicator was broadly in line with the east, falling 64¢ to close at 1,246¢.

Turnover this week was $24.83 million at $1,201 per bale, taking the year to date value to $1,804 million. For contrast, in the same week last year the 28,500 bales sold returned $58.3 million at an average of $2,039 per bale. The year on year comparison of sales value is down a massive $1.1 billion impacting not only on growers incomes but on all sectors of the industry.

Despite the weaker market, the pass-in rate was lower this week at 18.5%, resulting in 20,661 bales clearing, 3,643 more than last week. Again a large withdrawal was evident with 11.8% of the original offering withdrawn prior to sale. Season to date there has been on average 27,990 bales sold per selling week. This is well down on the 32,800 average for last season.

Again the falls were across the board, with Merino types losing 30 – 87¢ and Cardings down on average 27 to 44¢. The note from the X bred section was again that poorly prepared clips we difficult to find buyer support.

The week ahead

Next week’s national offering increases slightly to 25,660 bales. AWEX report that due to limited quantities Sydney and Fremantle both will have one-day sales, Sydney selling Tuesday and Fremantle selling Wednesday, this is a move designed to avoid Melbourne selling in isolation.

Cedar shutdown impacts mutton not lamb

The big news in sheep and lamb markets this week was the two week shutdown of Cedar Meats, which has had an impact on sheep prices, if not lambs.  Support for prices has been robust, with restocker demand and tight supply continuing to provide support.

Cedar Meats have the capacity to slaughter 10,000 sheep, lambs, goats or calves per day, but it is unlikely they have been running at full capacity in recent times.  We will have to wait until Tuesday to see how slaughter has been impacted.

We did get an inkling from the data for the week ending the 1st May, with the Friday closure of Cedar helping east coast lamb and sheep slaughter decline 7% and 16% respectively (figure 1).

Weaker competition at saleyards didn’t impact lamb prices, which moved sideways, the CV-19 Indicators down just $3 to $199/head.  Mutton markets did feel the impact of weaker demand, falling $14 or 6%.  There was some hope late in the week, however, with Wagga reporting strong demand for sheep, as seen in recent weeks.

Domestic markets and restocker demand still seem to be propping up lamb markets.  In the export-focused WA market, over the hooks prices are quoted at 750¢, while on the east coast they are 790-810¢.  The National average of MLA’s Trade Lamb Over the hooks Indicators has been tracking sideways (figure 2).  It has been way behind saleyards, but they have come back closer now.

Export data for April was released this week, and as expected, Chinese lamb demand is bouncing back, while the US was down.  For mutton, almost all markets were down, but like lamb, the lack of supply means it has to be down.  More on exports next week

Next week.

There is plenty of space slaughter capacity in the system at the moment, so there shouldn’t be any backlog from the Cedar shutdown, and we might even see mutton bounce when they are back in the market.

It will be interesting to see if ovine slaughter can fall any further, we are at last year’s mid-winter levels now.  For producers, it’s a bit depressing to think where prices might be had COVID-19 not taken hold, but we can just be thankful we’re not in the position of US cattle and hog producers.

A positive result (and not for Covid19)

Improved finished cattle prices were noted this week as supply metrics begin to normalize, particularly for east coast cattle slaughter. Department of Agriculture, Water and Environment beef trade statistics for April show Chinese demand for Aussie beef recovering strongly too as an added positive sign for producers.

East coast cattle yarding levels have held firm at around 45,000 head for the final week of April and the first week of May, indicating some stability is returning to the market after some wild swings pre-Easter (Figure 1).

Weekly throughput remains 20% below the five-year trend but is within the normal range for this time in the season, as represented by the grey shaded 70% range zone. In an interesting dynamic between state yarding levels, Queensland is running 25% above the five-year trend as of early May. However, NSW cattle yarding is well below normal at 53% under trend. This is contributing to the lower than average total east coast figures and is perhaps a sign of the appetite in NSW from producers to restock.

East coast cattle slaughter numbers have returned closer to the five-year trend, to sit just 5% below with around 135,000 head processed in the first week of May (Figure 2). Since the Easter lull, slaughter volumes have increased 27% and the return to relatively normal operations have seen demand pick up for finished cattle this week. The National Heavy Steer (CV19) indicator has lifted 4.5% since the end of April to close at 320¢/kg lwt (as at 6th May).

In further promising signs for beef producers, beef export flows were above the five year average pattern in April (Figure 3). While US flows remain very subdued, a strong increase in exports to China is a good sign that their economy is getting back on track post their COVID-19 shutdown. There will be more to come on this in the Mecardo analysis piece next week.

Next week?

Tight supply and a favourable rainfall forecast continue to favour cattle producers and provide underlying support to prices. While there are headwinds in the form of a disrupted US/global economy, low global cattle prices, and a strengthening Australian dollar, the sign of a re-emerging China should tip the balance towards a more optimistic outlook for prices, at least for the short term.