Category: Sheep

Tightening trend is the producer’s friend

There has been a softer trend present in lamb and sheep yardings in recent weeks. It is not uncommon to see a reduced sale yard offering as we head toward the Easter lull and with recent rainfall to much of the Eastern third of the country it seems to have encouraged firmer prices.

Throughput figures for this week are yet to be released. However, the trend in sheep yarding along the East coast is most definitely softer with the most up to date numbers showing the lowest weekly levels since the start of February – Figure 1.
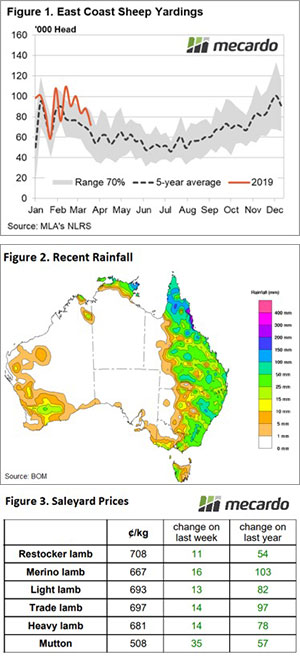
Despite the softening pattern, sheep throughput remains above average, and this may persist when the figures are released next week as individual reports from many NLRS reported sale yards indicate that numbers were up, possibly encouraged forward on the back of last weeks’ strong prices.

It is likely that rainfall had a bigger influence on prices than sale yard throughput levels this week with decent falls across much of the Eastern states encouraging restocker buyers back into the market, particularly at NSW yards – Figure 2.

Across the East coast NLRS reported categories of lamb and sheep all managed a lift in price. Mutton was the standout performer among the pack with a near 7% gain on the week to close above 500¢. Lamb categories posting a more subdued performance, with gains of 1.5%-2.5% noted. Restocker lambs managed to climb back above 700¢, while the benchmark Eastern States Trade Lamb Indicator settled just below to close the week at 697¢/kg cwt (Figure 3).

Lighter rainfall in the West wasn’t enough to inspire a price gain with the mid-week update from MLA showing a 5¢ slip on the West Australian Trade Lamb Indicator for the week to settle at 654¢.

What does it mean/next week?:

The Bureau of Meteorology rainfall outlook for the coming week shows only light coverage of 1-5mm around nearly all the coastal fringe, with only the far northern tropics getting a heavier dusting.

Virtually no rain is likely for most of the sheep rearing country, so price movements are likely to be influenced more by supply. Heading toward the Easter break there’s a good chance this will continue to tighten so the price bias remains to the topside.

Records for sheep and it’s only March

We knew it was going to happen, but the extent of this week’s move in mutton prices has been rather extraordinary. The indicators haven’t reflected the full move yet but we can get some ideas from today’s sale at Wagga.

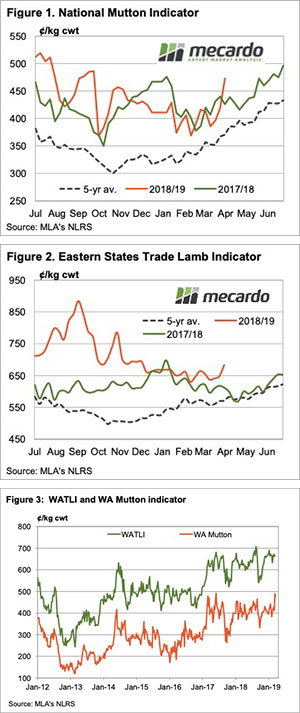
Sheep prices have gone bananas this week. Figure 1 shows the National Mutton Indicator (NMI) hitting a six month high of 473¢/kg cwt yesterday. Prices did rally as the week went on. At Wagga yesterday, Meat and Livestock Australia (MLA) reported sheep making over 600¢/kg cwt. Just last week, there were heavy lambs making less than 600¢.

Wagga saw new records in terms of heavy wethers making over $200 per head, while restockers competed with processors for ewes.  Many ewes made over $150 per head, with some better than $200.

We’ll have to wait until next week for full supply data but Wagga mutton supply dropped 30%. Thanks to a bit of rain, and the threat of more, producers kept what sheep they have left at home.

Unlike sheep, lambs get to a point where they have to be sold before they turn into sheep.  Lamb supply was still strong enough this week, but prices did get some lift from the mutton market. The Eastern States Trade Lamb Indicator (ESTLI) hit a 2019 high of 683¢/kg cwt, having gained 36¢ for the week.

WA saw the biggest jump in their mutton indicator and also had the most expensive mutton in the country. The WA Mutton Indicator gained 72¢ to post a 20 month high of 477¢/kg cwt. In fact, WA mutton prices have only ever been higher briefly in June 2017 (Figure 3).

What does it mean?

Sharply higher prices usually bring out more stock. A lack of supply is fixed by higher prices. During droughts, or when there is a sniff of a break, this sometimes doesn’t work. There may not be any more sheep that producers are prepared to part with, as they are required for future income. The coming week will tell the story but the record mutton indicator is 550¢ and it looks like we are headed in that direction.

Buyers selective

The recent pattern of buyers chasing after the small offering of quality wool, while at the same time finding an over supply of drought effected types continued.

While this pattern of supply is broadly following a well-worn seasonal path, the situation is at the current elevated levels because of the drought. It will take some time for this to flow through with wool shorn over the next 6 months at least also drought effected.

Auction volumes to the end of March make interesting reading, especially when broken down by category. AWEX figures show that comparing year on year the overall volume of wool offered for auction is 11.5% lower. However, as an example, the 16 MPG is 20.4% higher, with the 19 MPG 5.6% lower. However, as a result of the dry conditions, the big mover is the medium microns. The 21 MPG is down a massive 47.8% compared to last year; this helps understand some of the reasons for the current market dynamic.

To re-enforce the drought effect, AWEX noted that 30% of Merino fleece this week was yielding less than 60%.

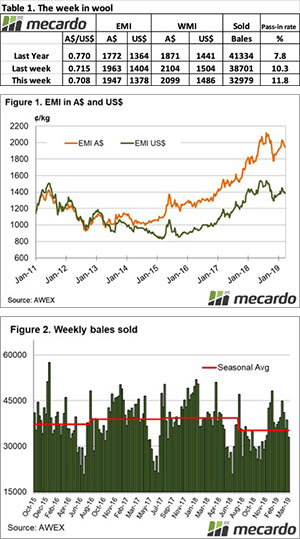
The Eastern Market Indicator (EMI) again fell 16 cents to 1,947 cents. The Au$ fell back below the US $0.71 mark, with the EMI in US$ terms also losing 21 cents to end the week at 1,382 US cents (Table 1).

In Fremantle, the Western Market Indicator (WMI) declined by 5 cents to finish at 2,099 cents.

37,405 bales were offered for sale this week, 5,724 less than last week with the trade clearing 32,979. This is 5,722 fewer bales than last week, with the pass-in rate remaining in double digit figures at 11.8%.

In the auction weeks since the winter recess, 1,092,065 bales have been cleared to the trade, 199,596 fewer than the same period last year. The average shortfall cleared to the trade compared to the same time last year now sits at 6,438 bales per week fewer.

The dollar value for the week was $67.22 million for a combined value of $2.555 billion so far this season. A simple calculation of $ value divided by bales sold gives us $2,038 per bale across all types.

Crossbreds again were the only category to see improvements this week, lifting 10 to 20 cents, however the Cardings sector continued to decline losing 30 to 40 cents.

The week ahead

The roster for next week predicts an offering of 38,212 bales followed by 35,945 and 41,055 in the weeks proceeding.

Weekly Wool Forwards for week ending 29th March 2019

Last week, we had no wool trades but saw a couple of rare cotton forward agreements. This week, wool trades came back, with six agreements, most of these in the medium wool category. Looking back at forwards for this month, there was just 18 agreed trades, the lowest number since December and the lowest March total since 2016.

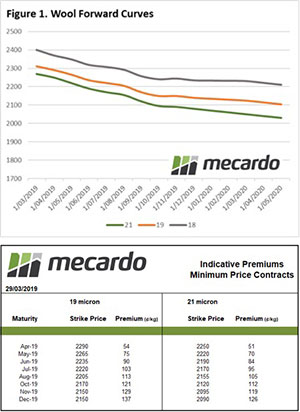
In the fine wool category, one trade was dealt for 19 Micron in April for 2,290¢. In the medium wool category, five trades were dealt for 21 Micron with two agreed at 2,250¢ in June, and three at 2,095¢ in October.

Looking at the Aussie Dollar trend since the start of March, we see a single small downward movement at the start of the month followed by a relatively stable curve, with a couple of forays above 71¢. In fact, today we’re nearly exactly at the same price as at the start of the month. Over the month we’ve seen a gradual overall cooling of physical auction prices that can be traced back to lower quality wools presenting more frequently.

Where have all the good wools gone?

The prevalence of poor quality wool has dragged the market down for a fourth week in a row. Lower style types were discounted by around 20 to 40 cents from last week’s base and this was enough to pull most individual Merino categories down.

AWEX reported that many of the lower styles also possessed poor additional measurements. These styles made up the highest proportional level of the Merino fleece offering since 2010. This week’s analysis piece looked into the drought implications on this seasons wool specifications and is worth a read (view here).

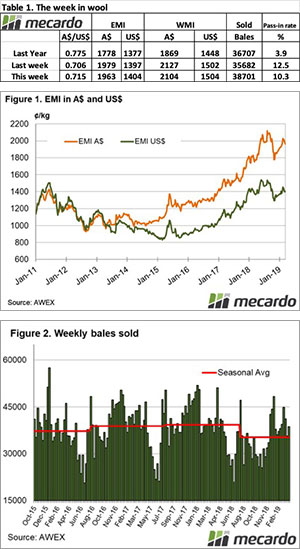
The Eastern Market Indicator (EMI) fell 16 cents to 1,963 cents. Improvements in the Au$, back above the US $0.71 mark, helped lift the EMI in US$ terms slightly. It rose 5 cents to end the week at 1,403 US cents (Table 1).

In Fremantle, the Western Market Indicator (WMI) declined by 23 cents to finish at 2,104 cents.

43,129 bales were offered for sale this week, 2,344 more than last week with the trade clearing 38,701. This is 3,019 more bales than last week, however, sellers are still not satisfied with the market levels, passing in 10.3% of bales.

In the auction weeks since the winter recess, 1,059,086 bales have been cleared to the trade, 191,241 fewer than the same period last year. The average shortfall cleared to the trade compared to the same time last year now sits at 6,374 bales per week fewer.

The dollar value for the week was $81.54 million for a combined value of $2.487 billion so far this season. A simple calculation of $ value divided by bales sold gives us $2,189 per bale across all types.

Crossbreds were the only category to see improvements this week. Gains of 10 to 20 cents were recorded in Melbourne. The Cardings sector felt the biggest cut of the week. Across the three indicators, declines of 30 to 70 cents were recorded from last week’s sales.

The week ahead

The roster for next week predicts an offering of 38,950 bales with further falls to 37,787 and 35,735 in the weeks proceeding. The lower offerings over the next few weeks may bring about added support for the better-quality wools. Whether there will be enough presented compared to the lower styles to lift the overall market remains to be seen.

Mutton firms despite elevated supply

A bit of a mixed bag for lamb price movements this week across the Eastern states, with Restocker, Trade Lambs and Mutton the only categories to see a price lift. Mutton prices remained remarkably strong in the face of elevated yarding and slaughter throughout much of March.

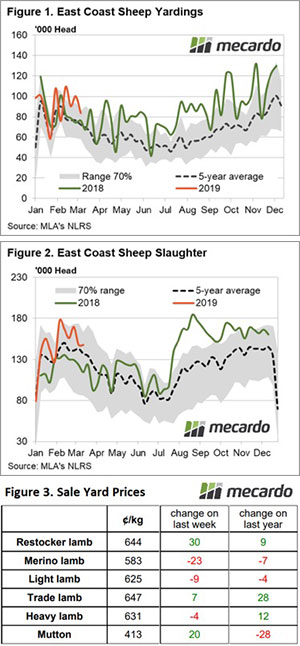
NSW saleyards are where the bulk of the sheep are being presented, with average weekly throughput levels during March sitting 43% above the five-year trend and 30% higher than in 2018. The increased NSW mutton yarding has helped to lift the overall East coast levels during March to see average weekly levels trending 22% above the March average pattern – Figure 1.

Throughput is not the only elevated supply measure for mutton with East coast mutton slaughter also remaining elevated during March – Figure 2. Both NSW and Victorian mutton slaughter are contributing to the increased East coast total slaughter. Average weekly NSW mutton slaughter during March have been running 27% higher than the five-year average, while Victorian mutton slaughter has been 23% higher. The two states combining to see East coast slaughter averaging weekly slaughter levels that are 11% higher than the five-year pattern.

Despite the weight of supply, mutton prices managed to gain nearly 5% this week to creep back above 400¢/kg cwt, closing the week at 413¢. The prospect of rain from tropical cyclones pushing further into the southern regions in the coming week also seemed to spur on Restocker Lamb prices to see them gain over 4% to close at 644¢ – Figure 3.

The benchmark Eastern States Trade Lamb Indicator (ESTLI) managed a milder 1% lift to see it close at 647¢/kg cwt.

What does it mean/next week?:

Remnant moisture from the cyclone activity in Northern Queensland is expected to make its way into Southern regions this week, with NSW benefitting from 10-25mm falls across much of the state. It is probably not heavy enough, nor going to be sustained for long enough, to make a significant impact upon price while supply remains elevated but could encourage some minor gains.

Lamb prices experiencing a case of Déjà vu

Another week, and more of the same for lamb prices. While lamb producers should be happy that they’re not trying to sell cattle at the moment, many are still thinking about the prices they didn’t lock in earlier in the year, as prices drift along the same path as last year.

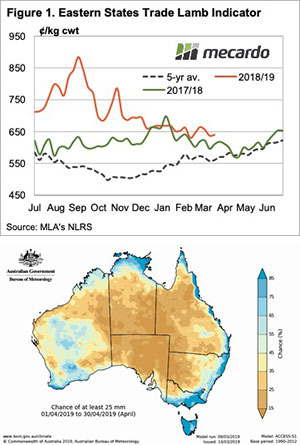
Since January lamb prices have been up and down. They are still better than last year but are following a similar trend and easing from January levels. Forward pricing has generally been anticipating a price rise at some stage, but it is yet to eventuate.

As outlined in our article earlier this week, lamb supply has been surprisingly strong and sheep supply has easily outstripped last year’s levels. Supply is keeping a lid on prices but, as we know, strong demand means prices have never been this strong at this time of year (Figure 1).

The only reason to really be disappointed with prices is if lambs were bought and fed. Selling these in the current market is likely to have resulted in a loss. Homegrown lambs have never made better money in March.

There is a little cause for optimism on the price front, however. The Bureau of Meteorology (BOM) is forecasting around a 50% chance of most of Victoria and NSW receiving median rainfall. Another way of looking at this is shown in figure 2. It shows the chance of getting 25mm in April. It’s pretty good for a lot of sheep country, if we raise it to 50mm, there is a lot less blue and a lot more brown.

What does it mean/next week?:

We received more correspondence this week regarding flocks consisting of fewer ewes having lower scanning rates. Again, we saw this last year and it really came home to markets from July through to September. Unfortunately to take advantage of high prices, lambs either have to be very late or very early.

What we do know is that those with the ability to carry lambs through winter, or get them up to weight early, will see some handsome payoffs.

Lamb price modelling

We’ve been working on upgrading our lamb price forecasting abilities at Mecardo and have recently developed an interactive modelling tool that allows us to forecast the annual average level for the Eastern States Trade Lamb Indicator (ESTLI) based on key supply and demand inputs.

In this analysis we take the model through a test run, playing out a handful of scenarios for the next few years to see the potential impact on lamb prices.

The forecast model uses predictor inputs such as the Australian dollar level, annual Australian lamb slaughter levels and demand metrics based on per capita gross domestic product (GDP) measures from some of our key export destinations to forecast an annual average ESTLI level.

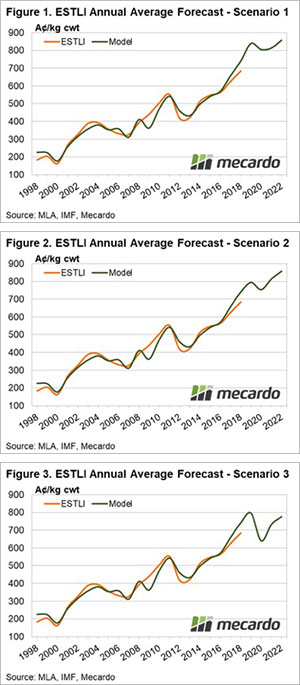
Figure 1 shows how the model compares to the actual ESTLI since 1998, including a forecast based on financial market consensus for the A$ level over the next few years, the Meat and Livestock Australia annual lamb slaughter estimates from their 2019 Sheep Industry projections and the GDP forecasts from the International Monetary Fund (IMF).

It suggests that growing wealth from offshore consumers will keep demand strong for our lamb exports and underpin prices for the ESTLI to see it average around 840¢ in 2019, dipping to 806¢ in 2020 as lamb slaughter rates in Australia increase.

However, we can adjust the lamb slaughter levels in the model to play out a second scenario that would test what the impact of a dry 2019/2020 will have on the ESTLI if slaughter rates increase from 21.5 million head in 2019 to 22 million head and if the 2020 lamb slaughter lifts from 22.1 million head to 23 million head – figure 2. The result of the increased slaughter is to see the ESTLI forecast for 2019 drop from 840¢ to 795¢ and the 2020 forecast decline from 806¢ to 755¢.

We can also imagine a third scenario where the increased lamb slaughter levels coincide with a shock to world growth levels during the 2020 season that limits the demand for lamb exports from our key offshore destinations. This could be in the form of a Chinese credit crunch impacting upon the Asian region and/or increasing US interest rates flowing through to softer global GDP growth levels.

Scenario three forecasts the ESTLI dip in 2020 extending further on the back of the decrease in offshore demand to see it average 640¢ before recovering back above 700¢ as GDP growth recovers beyond 2021 – Figure 3.

What does it mean/next week?

Interestingly, the model predicts a continuation of historically good price levels for lamb into the next few years even after we account for unforeseen problems such as an extended dry period within Australia, resulting in higher than expected slaughter levels, and/or a short-term hiccup to world growth and red meat demand.

Indeed, the model doesn’t forecast an annual average ESTLI below 600¢ in the next four years under any of the three modelled scenarios.

Key points:

  • Price modelling for the ESTLI based on current MLA slaughter projections and global demand growth for lamb consumption estimates annual average prices above 800¢ for the next few years.
  • Assuming a drier climate and higher slaughter than currently forecast will place the estimates for the 2019 and 2020 season into the 800¢ to 750¢ range.
  • The inclusion of a demand shock due to falling growth levels could see the ESTLI annual average drop towards 650¢.

Lower style wool drags on the market

This is the third consecutive week where the market has recorded losses, with the blame sheeted home to the drought on the east coast and the subsequent diminished supply of better style wool.

AWEX report that the national average yield on Merino fleece for the week was 63.6%, the lowest level in over 10 years.

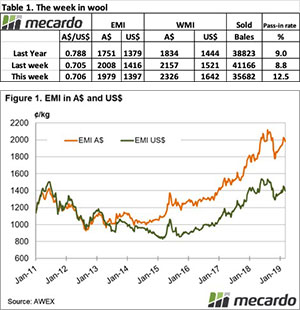
The Eastern Market Indicator (EMI) again pulled back over the week, falling 29 cents or 1.4% to 1,979 cents. The Au$ was slightly stronger, which didn’t assist buyers with the EMI in US$ terms down by just 18 cents to end the week at 1,397 US cents (Table 1).

In Fremantle, the Western Market Indicator (WMI) gave up another 30 cents on the back of 20 cents fall last week to settle at 2,127 cents.

40,785 bales were offered for sale this week, 4,345 fewer than last week with the trade clearing 35,682. This is 5,484 bales less than last week, however the cheaper market left sellers unimpressed with 12.5% or 5,103 bales passed in. This Pass-In rate is the highest since last November.

In the auction weeks since the winter recess, 1,020,385 bales have been cleared to the trade, 193,235 fewer than the same period last year. The average shortfall cleared to the trade compared to the same time last year now sits at 6,663 bales per week fewer.

The dollar value for the week was $74.77 million, almost $15.0 million less than last week for a combined value of $2.40 billion so far this season. A simple calculation of $ value divided by bales sold gives us $2,095 per bale across all types, exactly $100 per bale lower than last week.

Crossbred types weren’t missed either, losing between 25 & 40 cents for the week.

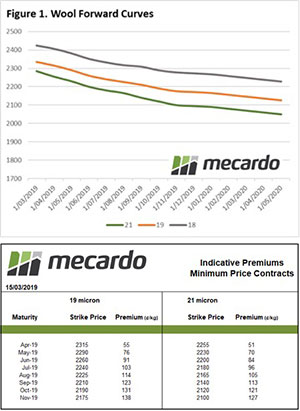
Weekly Wool Forwards for week ending 15th March 2019

The forwards market picked up ever so slightly from last week with two more trades, but it is still somewhat muted when you look at the last few years for March. It is interesting to see large price differentials in the same Micron category in relatively short time intervals in the forwards market; this could indicate some panic in a falling market or in confidence that the market will continue to fall.   

In the fine wool category, two trades were dealt for 19 Micron, one in June for 2250¢ and the other in September for 2225¢.

In the medium wool category, four trades were dealt for 21 Micron. The earliest was for March, and that was agreed at 2270¢. The latest was for October and agreed at 2115¢. The inbetweeners were for May and September and agreed at 2230¢ and 2130¢ respectively.

This week we have seen the Aussie Dollar regain some of the ground it lost at the tail end of last week. It now hovers around 70.7¢, an average value for the last 3 months. Auction levels have cooled again, but prices are still historically good.