Category: Wool

Support emerges for the wool market.

It seems that Fremantle was the “canary in the mine” last week. We reported that the market appeared to find support in WA late on Thursday and this translated into a stronger market this week.

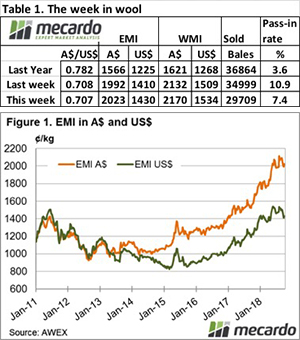
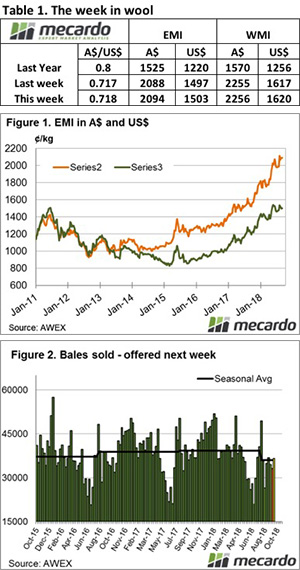
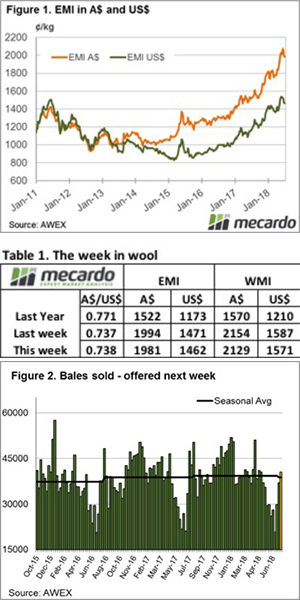
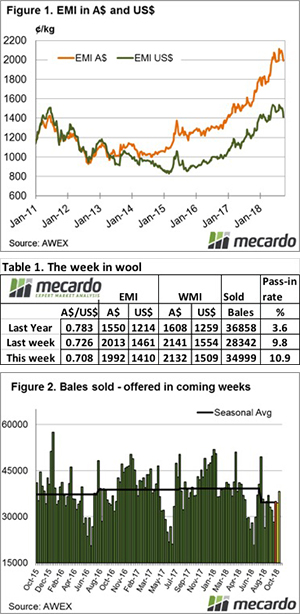
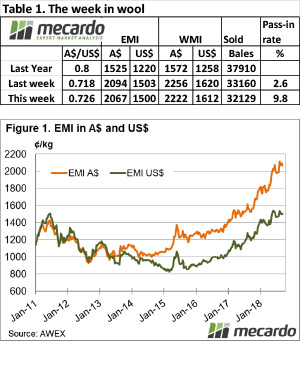
The Eastern Market Indicator (EMI) picked up 31 cents for the week, settling back above 2,000 cents again, to end the week at 2,023 cents in Au$. The EMI in US$ terms was not quite a strong with the market receiving some benefit from Au$ movements, posting a 20 cents improvement to finish at 1,430 US cents (Table 1).

Last Thursday, Fremantle provided the confidence into this week. It also continued this trend to see the WMI gain a further 38 cents to end the week at 2,170 cents.

With a resurgent market, the Pass-in rate dropped below double-digit figures, with 7.4% of the total offering passed. This resulted in a clearance to the trade for the week of 29,709 bales, with 2,363 bales passed. There was a reduced dollar value for the week of $68.74 million and a combined value of $982.58 million so far this season.

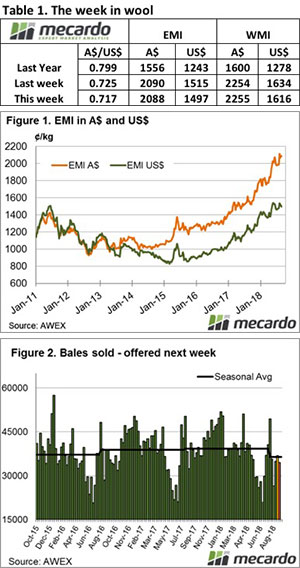
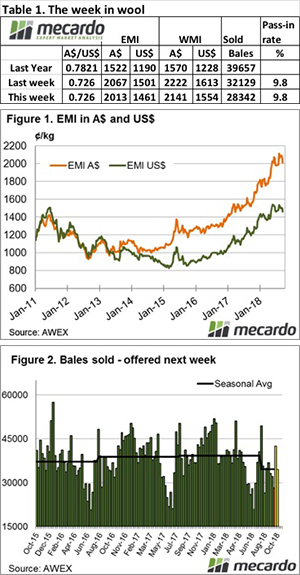
In the nine auction weeks since the winter recess, 341,922 bales have been cleared to the trade, 46,600 fewer than the same period last year. The average shortfall cleared to the trade compared to the same time last year now sits at 4,660 bales per week (Figure 2).

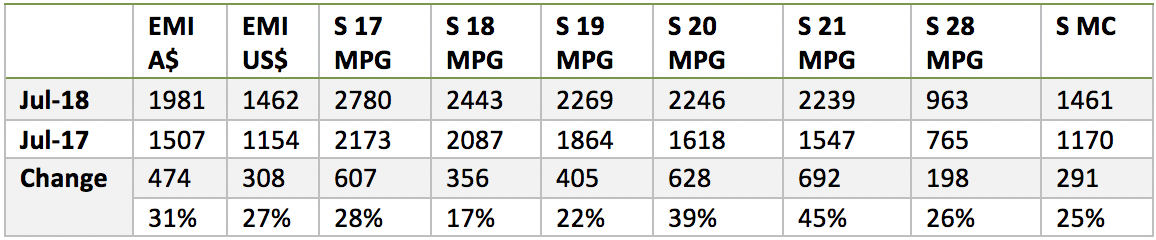
Strongest demand this week came for 18.5 and broader types, with 21 & 22 MPG in Melbourne lifting almost 100 cents. There was a large offering of fine tender wool which struggled to attract sufficient demand and weighed down the fine wool market.

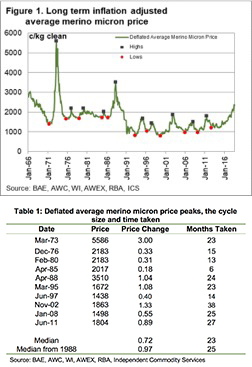
As noted in the Mecardo article, Fine wool volumes rising, the drought will increase this sector of the market and at the same time reduce the volume of broader types. We are seeing this play out in the market now, impacting & driving price movements.

An increase in fine Merino volumes has been anticipated due to the dry conditions in eastern sheep regions. This is starting to happen in earnest now, as the production from the higher rainfall regions in eastern Australia (which is finer to begin with), shows the effect of drought. This trend in supply will persist through to at least mid-2019, therefore the downward trend on fine wool premiums will persist for the same time.

Crossbreds prices remained firm, but it was noted that the better-prepared wools performed well while poorly prepared clips struggled with a much higher pass-in rate.

Cardings produced a mixed bag, cheaper in Melbourne, dearer in Fremantle and no change in Sydney.

The week ahead

Next week a slightly larger offering of 37,644 bales is rostered, and with Fremantle again providing a solid finish to the market we should see some level of support for the market.

The next 3 weeks have rostered 37k bales, and while the spring shearing is causing a slight increase week on week, it will be down around 20k on the same period last year.


After the falls, could we be finding support?

The wool market continued to retrace this week with most of the falls coming at the beginning of the selling before stabilising towards the end.

The Eastern Market Indicator (EMI) fell 21 cents for the week, settling below 2,000 cents for the first time since early August, to end the week at 1,992 cents in AU$. The EMI in US$ terms produced a bigger correction, falling 51 cents to finish at 1,410 US cents (Table 1).

A softer Au$ helped the market, by the end of sales it was quoted at US$0.708. This is the lowest it has been on close since January 2016.

In Fremantle, the market lost ground on Wednesday where the WMI fell 26 cents but posted a more positive result on Thursday, gaining 17 cents to end the week at 2132 cents.

The Pass-in rate again stayed in double-digit figures, with 10.9% of the total offering passed. This resulted in a clearance to the trade for the week of 34,999 bales, with 4,262 bales passed. This produced an increased dollar value for the week of $84.02 million, with a combined value of $113.84 million so far this season.

In the nine auction weeks since the winter recess, 312,213 bales have been cleared to the trade, 39,451 fewer than the same period last year. The average shortfall cleared to the trade compared to the same time last year now sits at 4,386 bales per week fewer (Figure 2).

We often look to Fremantle as a guide to next week due to the later finish to sales, and this week it is providing a positive view. After consecutively falling days by the end of the week buyers were showing support, with AWEX noting that all types including skirtings found support.

Crossbreds were also impacted by the falls with the exception of 32 micron which was slightly stronger.

Cardings continued there slide south with a further 35-50 cents lost across the selling centres this week.

The week ahead

A further reduced offering of 34,467 bales should provide some level of support for the market.

The final day was much steadier than the early part of the selling week, so a return from some processors can be expected to support these levels.

Wool market kicks against the wind in Grand Final week.

Again, this week saw the wool market give up ground, easing on Tuesday when only Melbourne was selling and this trend continued when Sydney and Fremantle joined in. AWEX reported that it was the better style wool early in the week that met subdued demand, although buyers returned to look for bargains by weeks end.

The Eastern Market Indicator (EMI) fell 54 cents for the week, coming on top of last week’s 27 cents loss, to end the week at 2,013 cents in AU$. The EMI in US$ terms gave up 39 cents to end the week at 1,461 US cents (Table 1).

In Fremantle, the big “correction” came on Wednesday, where the WMI lost 74 cents but posted a more settled result on Thursday, losing another 7 cents to end the week at 2141 cents.

This week the Pass-in rate escalated in response to the market movement, with 14.1% of the total offering passed. A special mention goes to Fremantle, where on the first day 47.4% of wool offered was passed with a more modest 18.0% on the final day. This resulted in a clearance to the trade for the week of 28,324 bales, with 4,643 bales passed. This again produced a reduced dollar value compared to last week of $69.6 million, with a combined value of $830.1 million so far this season.

In the eight auction weeks since the winter recess, 277,214 bales have been cleared to the trade, 37,592 fewer than the same period last year. The average shortfall cleared to the trade compared to the same time last year now sits at 3,880 bales per week fewer (Figure 2).

The elevated Pass-in rates indicated that growers were not pleased with the softer market. With future supply looking tighter growers are prepared to punt on a recovery in the future.

A comment from the Rodwells team outlines the thinking going forward, – “Often the peak supply comes through around this time, if the 42K bales rostered for next week is the peak then supply is going to be lean for the rest of the season!”.

While falls were across the board, Crossbreds were not as severely punished, however, there were very small offerings to quote.

Cardings were particularly hard hit this week, Melbourne reported the Cardings indicator down 80 cents, while Sydney and Fremantle lost over 100 cents.

The week ahead

The offering next week is rostered at 42,500 bales, which is most unlikely to get to the auction as growers digest this week’s market correction.

The final day was much steadier than the early part of the selling week, so a return from some processors can be expected to support these levels.

Wool drifts lower

The beginning of the selling week saw the Au$ firm and the wool market ease as a consequence, however on Thursday, it was a different tale as buyers abandoned the poorer quality types but retained focus on well measured good yielding wool.

The Eastern Market Indicator (EMI) fell, losing 27 cents for the week to finish at 2067 cents in AU$. This market move was influenced by a stronger AU$, the EMI in US$ terms only gave up 3 cents to end the week at 1,500 US cents (Table 1).

The recent market level has been encouraging sales, and wool producers were selling almost all the wool offered with Pass-in rates at record low levels. This week at auctions growers reacted strongly to the easing market passing in 9.8%, well up on last week’s 2.7%. This resulted in a clearance to the trade of 32,129 bales, with 3,500 bales passed. This again produced a reduced dollar value compared to last week of $80.73 million, with a combined value of $760.5 million so far this season.

In the seven auction weeks since the winter recess, 248,890 bales have been cleared to the trade, 26,259 fewer than the same period last year. The average shortfall cleared to the trade compared to the same time last year now sits at 3,751 bales per week fewer. (Figure 2).

A continuation of this trend will see wool volume offered continue well below last season, and also the lowest for the past three seasons.

The comparison with this time last year provides context for just how much this wool market has improved, with the EMI up 542 cents or 26% compared to the same sale in 2017. This is partly explained by a lower Au$, with the EMI in US$ up 280 cents or 19%.

Another good measure of the market level is the average gross value per bale of wool sold. In early 2018 it reached $2000, up from $1500 in May 2017, which was extraordinary.

For September the average bale value is averaging $2,525, helped by the strong market in fine merino wool at a time of the season when the clip fines up.

A comment from the Roberts team in the auction room probably best explained the week, – “Buyers were starting some of the lots at 400 cents below value and were bidding slowly and conservatively up to values not dissimilar from last week; but the focus was clearly on the better style wool”.

The only section to end stronger for the week was the Broad X Bred types in Melbourne, skirtings and cardings fell in line with other types.

The week ahead

The offering this week was 1,000 bales fewer than last week, next week a slightly smaller offering is rostered of 34,800 bales with all centres selling.

An early call on lamb supply

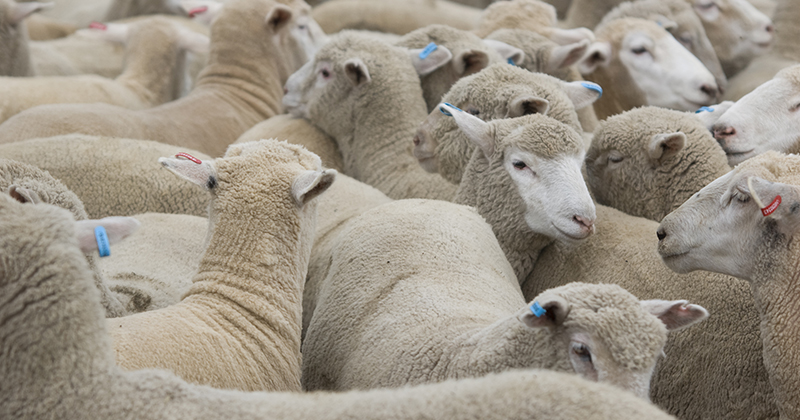
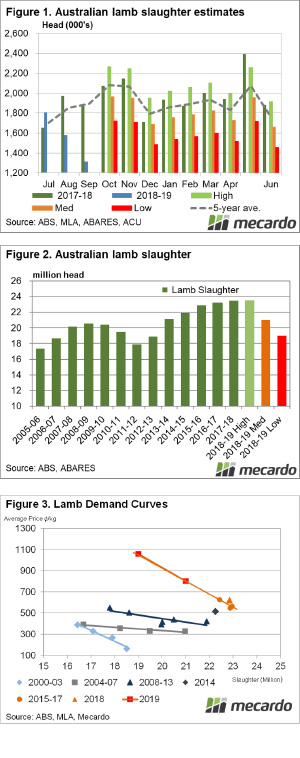
Spring is well and truly here, but the spring lambs are not quite. We usually start to see lamb slaughter show weekly increases from mid-July through to mid-October. This year all we have seen is slaughter declines.  August and September are likely to post their weakest slaughter rates since at least 2009. The question is, how is this going to impact supplies for the rest of the year?

The latest Australian Bureau of Statistics (ABS) slaughter data released in early September showed a strong 9.6% increase in lambs slaughter in July compared to year-earlier levels. Higher prices and dry weather encouraged turnoff of the last of old season lambs. It’s also likely that the 158,700 extra head was made up of Merino wethers and both Merino and maternal meat breed ewe lambs which were previously destined to boost flocks.

We know from Meat and Livestock Australia’s (MLA) weekly slaughter statistics that lambs slaughter has taken a serious hit since the end of July as the new season supply failed to materialize. Figure 1 shows our estimate of where the official slaughter numbers might sit for August and September.

August lamb slaughter is likely to be down 20% on 2017, and September is currently running 30% lower. We haven’t seen August and September lamb slaughter this low since at least 2009 and could be the lowest since 2005. Figure 2 shows that in 2009-10 and 2005-06 lambs slaughter levels finished up at 20.4 and 17.3 million head respectively.

In a normal season, we assume that low slaughter early in the season will mean more lambs will come to market later. This is based on steady or rising annual slaughter rates. The Australian Bureau of Agricultural and Resources Economics and Sciences (ABARES) forecast 2018-19 lamb slaughter at 23.5 million back in June.

It’s becoming clear that lamb slaughter is not going to reach the levels seen in 2017-18, with marking rates well back. We really are in the dark as to how many lambs are out there, but we can use historical slaughter rates at a guide. Figure 2 shows where we expect financial year slaughter to sit at with high (ABARES forecast), medium (21 million head) and low (19 million head) levels.

It indicates how the forecast slaughter levels will play out if we deduct what has already been slaughtered and if annual seasonality is applied to the remaining nine months.

What does it mean?:

If we somehow manage to find 23.5 million head of lambs to slaughter in 2018-19 supply will be well above last year for the remaining months. The medium and low scenarios show a significant monthly supply gap despite the slaughter declines we’ve already seen.

In terms of price, the medium and low slaughter forecast levels take prices to new records. Figure 3 shows our demand curve and extends it to slaughter of 19 and 21 million head. Under the demand equation we’ve seen in recent years it gives average prices of 1059 and 800¢/kg cwt. We don’t expect prices to move through $10 this year, but lower slaughter paints a positive picture for prices.

Spring lambs on the mind

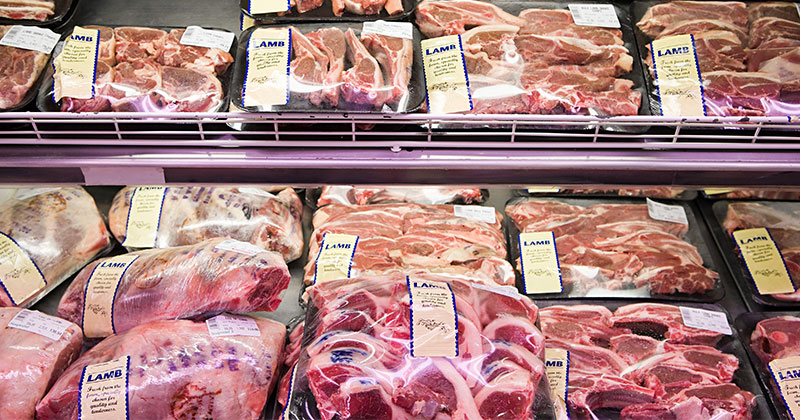
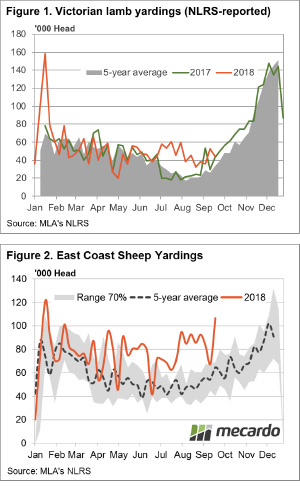
Coles and Woolies are already sprucing new spring lambs on their shelves, and we can see where they’re coming from with rising yarding levels in the south telling us the spring flush is making its move. This has already begun to take its effect on prices, with another week of declines for most lamb categories.

Victorian lamb yarding’s are starting to show signs of the spring flush. September totals for Victoria are currently sitting at 5% above year-ago levels and this is providing a boost to east coast numbers. The total east coast yarding’s were 151,018 for the week. Although 17% lower than 2017, it’s still sitting 8% above the 5-year average for this time of year (Figure 1).

The rising throughput is flowing through to affect the Eastern Indicators. The Eastern States Trade Lamb Indicator fell 19¢ on the week to see it at 773¢/kg cwt. Heavy lambs weren’t able to hold onto their levels for another week, posting a 35¢ drop to 783¢/kg cwt. Restockers were the exception to the falls, managing to finish the week slightly higher (4¢). There’s still a long way to go before we see these prices close in on last year figures.

Mutton prices were again able to largely avoid the fate of lamb prices. The mutton indicator ended the week at 489¢/kg cwt, down just 2¢ on last week. The holding sheep prices in the face of declining lamb prices appears to be encouraging some supply forward. East coast sheep yarding’s have jumped a massive 57% higher in the last week, thanks to spikes in NSW and Vic (Figure 2).

What does it mean/next week?:

As covered in this week’s analysis article, we can’t see lamb supply matching last year’s levels through all of spring. This immediate rally in supply is likely to be mopped up relatively easily by processors.

If supply does continue to increase due to dry conditions, there will be some pressure on prices, but this impact should be short-lived.

The quid pro quo is that with available numbers more likely to be less than the 2017/18 season, tight slaughter supply is likely to maintain upward pressure on prices. The spring flush of supply could again have a limited corresponding decline in spring lamb prices, similar to the past two seasons.

Wool market creeps up.

The AWEX report captured the wool market sentiment this week – it “crept up.” On the first day of sales the EMI pushed close to the 2,100-cent level, before easing slightly on the final day, but in the end, it had regained the minor fall of last week.

 The Eastern Market Indicator (EMI) rose, lifting 6 cents for the week to finish at 2094 cents in AU$. With the AU$ finally having a stable week, the EMI in US$ terms also lifted 6 cents to settle at 1,503 US cents (Table 1).

The current market level is encouraging sales, and wool producers are obliging with minimal pass-in rates. This week at auctions only 2.7% didn’t meet growers reserve. This resulted in a clearance to the trade of 33,160 bales, passing in only 900 bales. This caused a reduced dollar value compared to last week of $82.85 million, with a combined value of $679.8 million so far this season.

In the six auction weeks since the winter recess, 216,780 bales have been cleared to the trade, 20,760 fewer than the same period last year. While there would have been some reserve grower stocks inflating last year’s figures, the average 3,500 bales per week fewer this year is worrying for processors (Figure 2).

The combination of the drought causing reduced fleece weights predicted for the coming months, as well as the significant sheep slaughter this year, looks likely to be all negative for wool supply going forward.

While buyers bid strongly to secure wool, growers can accept strong prices across the board and look forward with some confidence.

As for the Merino section, X Bred lifted slightly, skirtings followed in their wake while cardings were slightly easier.

The week ahead

The offering this week was 4,000 bales fewer than last week, next week a slightly larger offering is rostered of 36,500 bales with all centres selling.

Steady result for wool this week.

After the volatility and interruptions of recent weeks, the wool market settled into a comfortable pattern this week with a seemingly contented balance between supply & demand at current prices.

The AU$ continues to attract focus as it jumps around on a day to day basis.

The Eastern Market Indicator (EMI) fell marginally, losing 2 cents for the week to settle at 2088 cents AU$. With the AU$ again depreciating almost 1 cent over the week, the EMI in US$ terms closed at 1,497 US cents, down 19 cents on the week. (Table 1).

News out of South Africa this week sounded remarkably similar to the local wool situation. The S.A. benchmark indicator climbed to a record 253.82 Rand, helped by a weakening currency.

After peaking at 148 million kilograms in 1966, southern African wool production has declined to about a third of that annually.

The country has about 15 million Merino sheep, with Cape Wools estimating there are as many as 9,000 commercial producers and 50,000 small-scale farmers.

Again, a relatively low pass-in rate at auctions of 4.1% for the week, resulting in a clearance to the trade of 36,927 bales passing in only 1,500 bales. This resulted in an increased dollar value for the week of $94.04 million, with a combined value of $597.0 million so far this season.

In the seven auctions held for the current selling season, the cumulative national total offering is 39,000 bales lower (-12.5%) than for the same period in 2017/18. The clearance to the trade (bales actually sold) is tracking 3,515 bales per week fewer than for the same period (Figure 2).

On the smallest national offering of crossbred wool in three years a mixed result was recorded. The Melbourne sale reported dearer for 30 MPG while cheaper for 28 MPG.

AWEX reported that Merino Cardings had only minor movements for the week and were generally unchanged.

The week ahead

Next week a smaller offering of 34,500 bales is rostered with all centres selling. With currency assisting and supply constrained we can look forward to at least a similar result as this week.

A look at cyclical price peaks in the merino market

Current merino prices are mesmerising. If you doubt this, take a look at prices being paid for stains, cardings and fine crossbred wool which can be used for blending purposes let alone the price levels for the broader merino categories. This article looks at how the current merino cycle fits with past price cycles.

Wool production has changed a lot in the past half century as has the inflation adjusted value of the currency. To accommodate these effects this article uses the average merino micron price series adjusted for inflation. This focusses the price on the core merino price, and brings past price levels up to current price levels in terms of inflation.

Figure 1 shows the deflated average merino micron price from the mid-1960s through to last week, with cyclical peaks (black squares) and cyclical low (red circles) shown. The 1973 and 1988 price cycle peaks stand out in Figure 1. In inflation adjusted terms price was stable from the mid-1970s to the mid-1980s. After the collapse of the Reserve Price Scheme the inflation adjusted price stepped down and traded in a fairly well defined range through to 2016, after which is has traded to higher levels.

Table 1 is a summary of the cyclical peaks shown in Figure 1. It shows the month of peak price, the monthly average price, the size of the price change from the previous cyclical low (in the case of 1973 3.00 means the price rose by 300%) and the time taken in months to go from the previous cyclical low to the cyclical peak. The median change in price from low to peak is 0.72, however there are a few small cycles from the peak RPS decade from the mid-1970s onwards. From 1988 onwards the median cyclical rise is 0.97 (a 97% rise in price or near doubling of price) taking a little of 2 years at 25 months.

So, where does that leave the current price cycle? In price terms the current market (August 2018) has risen by 0.99 from the last cyclical low, so it is around median level for rising cycles from the mid-1980s onwards. By this price rise standard the current cycle is nothing extraordinary, which is an interesting observation.

Strictly speaking the current rising cycle has been running for 71 months but in practical terms the cycle started to lift in late 2014 so the cycle is around 47 months old in Australian dollar terms. Either way the cycle is ancient by the standards of past cycles.

This analysis is designed to provide a base rate or base pattern for a rising price cycle in the merino greasy wool market. Each cycle will vary in the conditions applicable to the cycle. For example the 1973 cycle had a general commodity boom going on, the 2002-3 cycle was a classic post stockpile boom and the 2011 cycle was really a cotton boom. The current cycle has two observable features. Firstly the starting price was relatively high and secondly supply is low and about to be limited further by dry conditions.  At this stage the price rise is what we would expect from a standard cycle.

Key points:

  • The standard rising price cycle for the average merino micron price since the mid-1980s has resulted in prices doubling from the previous cyclical low.
  • These rising price cycles have generally taken around 2 years to play out.
  • This is the base pattern for rising price cycles.
  • In comparison the current cycle has risen by 99% from the previous cycle low, close to median , over nearly 4 years (twice as long as normal).

What does this mean?

Each price cycle will have its own peculiarities, so the median rising price cycle is only a guide to the standard pattern we can expect. At this stage the pattern tells us that price, which is high as it usually is in the upper section of a rising price cycle, has risen by a normal margin, although the time taken has been much longer than normal. It is not a super cycle.

Wool closes on a solid footing.

The wool market has now closed for the annual 3-week winter recess, and all industry players would have been pleased with the final sales.

A solid and well supported market leading into a break provides all with confidence, especially wool exporters travelling overseas to visit mills and set in place plans for a new season supply.

The Eastern Market Indicator gave up 13 cents over the week to settle at 1,981 cents AU$ terms (Figure 1).

The EMI was also weaker in US$ terms although not to the same scale as in Au$ terms, closing at 1,462 US cents, down 9 on the week.

Comparing the wool market performance over the season, a 31% lift for the EMI is an excellent result. The bulk of the clip now sits in the 18 to 19 MPG range, and this area showed the least gains at 17 & 22% respectively, while 20 & 21 MPG which has seen continued decline in supply performed best.

Again, sellers exercised restraint, with 11.2% passed in on Wednesday and a further 5.3% on Thursday for a total of 8.5% over the week. Still a significant pass-in rate given the level of the market but well back on the double-digit figures of last week.

An offering of 40,544 bales resulted in 37,095 bales sold, well above the 27,000 averages for June but in line with the season average of 39,000 per week.

The first day saw a continuation of the softer trend of last week before a recovery on Thursday with Fremantle off the market. This was especially evident in the 19 and broader types, all quoted dearer, with the finer types fully firm although 16 & 17 MPG were irregular.

Crossbreds also finished on a solid note; with AWEX noting that better prepared lots sold best. This is now a feature of this market where poorly prepared or unskirted lots are not well regraded and buyers are selective.

Merino Skirtings eased in line with fleece wool, however lines containing >5% VM again were not keenly sought.

Merino Cardings also eased with the Cardings Indicator in Sydney – 17, Melbourne – 29 and -21 in Fremantle.