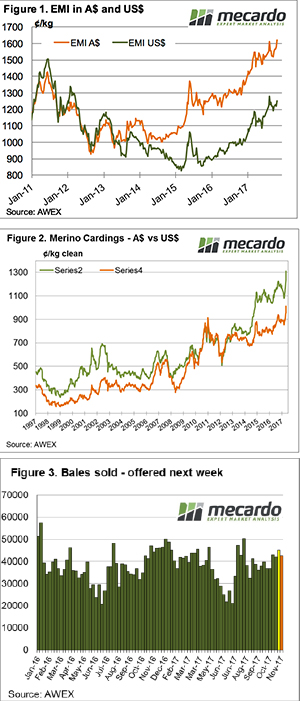
 With one of the larger offerings for this year the market performed very strongly this week. Every category posted gains. Records were set with the 19.5 MPG posting its highest level since its 2001 listing, and cardings topping 1300 cents in Melbourne, a record against our records going back to 2002.
The Eastern Market Indicator (EMI) rose 45¢ on the week to 1,623¢ with AWEX reporting this a new record high in Australian dollar terms. The Australian dollar was unchanged on the week, with the EMI in US$ terms posting a rise also of 35¢ to end the week at 1,252¢. The EMI in US$ terms is edging however it is still well off its previous record of 1504 cents set in July 2011.
Only 2.2% of the offered bales were passed-in, resulting 45,193 bales cleared to the trade. Again, this is a strong signal of the strength of the current market.
Whether these prices are a result of AWI market initiatives, or a response to reduced supply, or maybe just a normal improvement in the demand cycle, growers who have wool to sell now are receiving “best ever” wool cheques.
The rally also carried across to the inferior types; as is usual in a strong rally, wool carrying higher mid-breaks, or lower tensile strength, or greater VM got carried along by the surging market.
We are now at levels where predictions of future price directions become a bit of a guessing game. Will buyers (more importantly their customer processors overseas) pull back from this rally and we see the market retrace, or is this rally unstoppable and further increases are imminent?
Either way, wool growers should continue to sell as soon as wool is tested, and also take a close scrutiny of forward price bids to look for cover for some production for future clips.
The week ahead
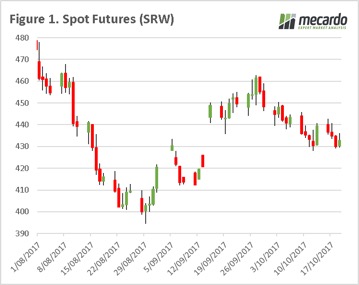
42,722 bales are rostered for sale next week across the three selling centres (Figure 3). The roster lists 44,000 and 40,000 for the following weeks; based on current demand this should pose little challenge for the market to absorb.


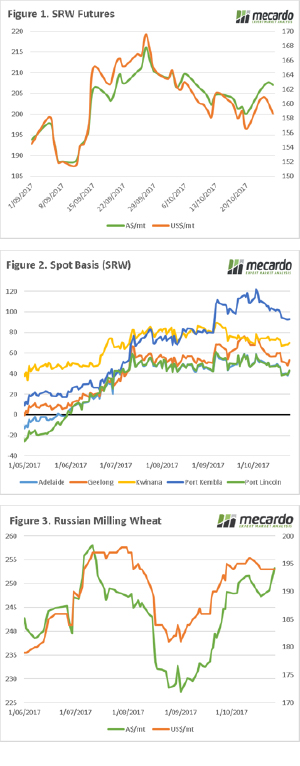 The market continues to follow a similar pattern to recent weeks. In this week’s comment, we look at futures & basis levels. In addition, we look at where our main competitor (Russia) is pricing its wheat.
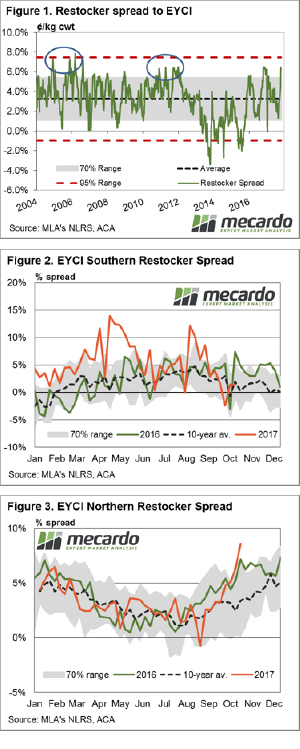 Analysis of the underlying saleyard data that is used to create the Eastern Young Cattle Indicator (EYCI) shows that optimism of restockers has been increasing during October as they appear more prepared to pay a premium to secure young cattle. This piece delves a bit deeper into the figures to see if the renewed restocker interest is part of the normal seasonal cycle or if there is something more behind it.
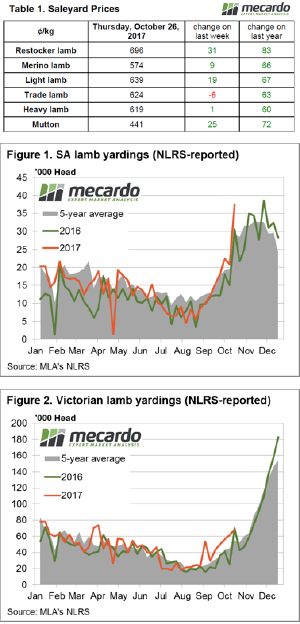 The Eastern States Trade Lamb Indicator (ESTLI) took a bit of a breather this week, staging a slight price decline as South Australian lamb throughput is starting to act as a bit of a headwind. The ESTLI off 6¢ on the week to close at 624¢/kg cwt.
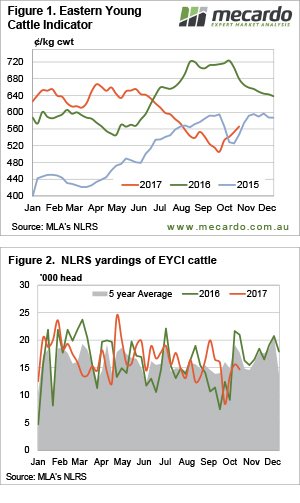 More wet weather this week cut cattle yardings in Queensland, and encouraged restockers to return to the market in NSW. At a time of year when prices generally fall, or are steady, we saw a further appreciation in the Eastern Young Cattle Indicator (EYCI), but not in all categories.
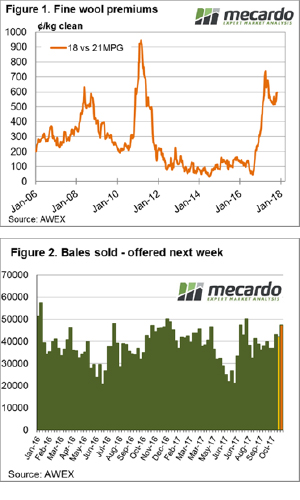 We’ve ticked over the billion-dollar milestone for total value of wool sold this year which is something of an achievement. At this point in the season last year the value was 26% lower than it is today despite the cumulative bales sold being just 10% lower. The wool market hasn’t reached this mark by week 17 since 2002.
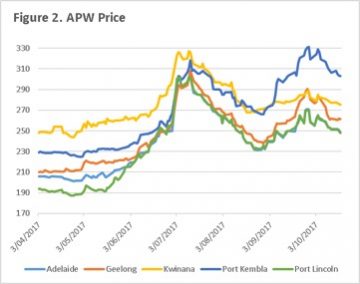
 The futures markets are largely quiet, as the northern hemisphere is largely complete for 2017 and seeding progresses for next year. At a local level, it is important to start considering local premiums and how to take advantage of them.
 At a local level, harvest has begun in the north and it won’t be long until the bulk of farms around the country will be ‘reaping what they have sown’. During October, rainfall has been strong through much of northern NSW and QLD, although not adding much in the way of benefits to the winter crop has added confidence in the summer crop. This has resulted in consumers reducing some of their buying appetite, as they reassess the situation for the coming 6 months.
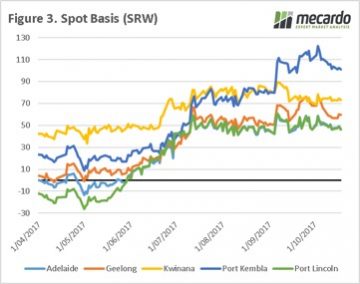 At present there are considerable premiums available for growers. As growers start to sell the crop, the logic would be for basis to fall.
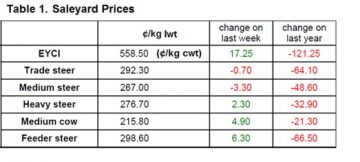 The Eastern Young Cattle Indicator (EYCI) lifted again this week, recovering a further 3% to see it close at 558.50¢/kg cwt with some good rainfall to much of Queensland providing a bit of a boost. Gains noted too across the East coast for Heavy and Feeder Steers, up 1-2% to round out a reasonably firm performance for cattle markets.
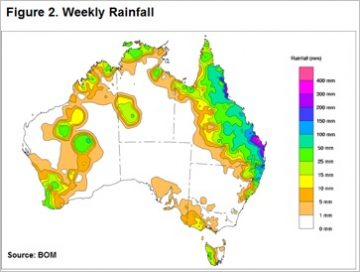 It points to how much optimism was sapped out of restocker buying activity during the Winter dry spell, but that may change if the northern rains continue and NSW starts to get a bit of decent rainfall too. Figure 2 shows the national rain tally over the last week with Queensland the clear beneficiary and next week’s forecast calls for a continuation across much of the north and spreading into NSW which should continue to support demand for young cattle by restockers.
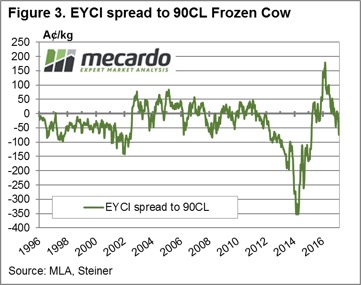 After a recent lift the 90CL is knocking on the door of 600¢/kg CIF again and with the Bureau forecast of a fairly normal November rainfall pattern and a good chance of a slightly wetter than average December all indications are for continued support for young cattle prices in the coming weeks.
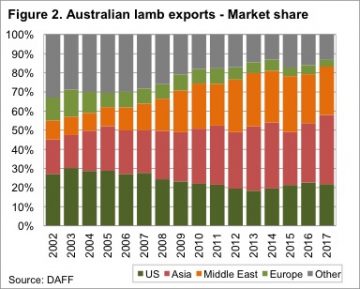
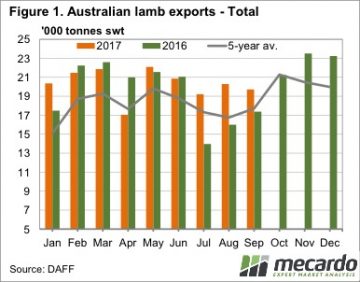 Last week we spent a couple of articles looking at the interesting price phenomenon that we are currently seeing in lamb markets. Strong prices continued last week, in the face of strong supplies, so today we take a look at the export data to see where the extra lamb is going.
 A simple indication of increased demand is the fact that in 2014 the Eastern States Trade Lamb Indicator (ESTLI) averaged 459¢/kg cwt from July to October. This year the ESTLI has averaged 604¢/kg, 31% higher.
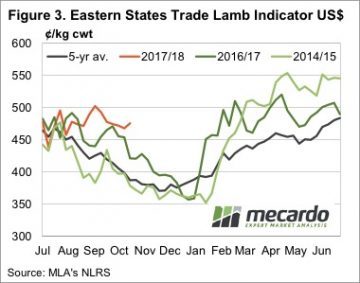 We have in the past seen significant jumps in lamb demand from exports markets, and we might now be seeing early indications of the next one. Significantly larger export volumes, coinciding with similar or stronger prices suggests that consumers in the US, Middle East and Asia have become comfortable with the higher lamb prices seen over the past nine months.
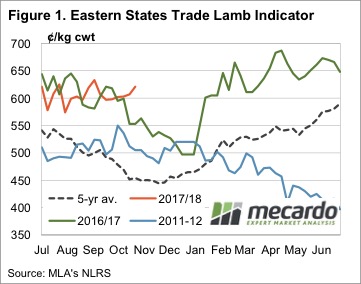 Spring in general, and October, in particular, are known for falling lamb prices. We usually see supply increasing as winter and spring lambs hit the market, pushing all sheep and lamb markets lower. The price rally this week is particularly unusual.
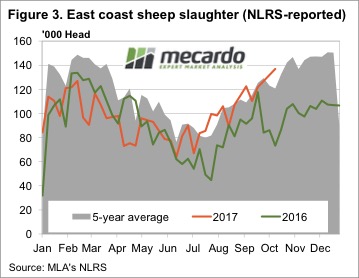
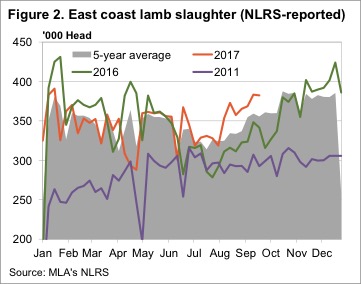 After a couple of weeks of intermittent supply data, sheep slaughter has hit 136,925 head (figure 3), the highest level since the end of 2015. Remarkably, mutton prices also rallied this week, the National Mutton Indicator gained 24¢ to sit back at 397¢/kg cwt.
 Whether higher prices are enough to draw more lambs to the market while it’s raining is yet to be seen, but we do know that growers who sell lambs in October have never had it so good.