Tag: Articles

Lamb prices experiencing a case of Déjà vu

Another week, and more of the same for lamb prices. While lamb producers should be happy that they’re not trying to sell cattle at the moment, many are still thinking about the prices they didn’t lock in earlier in the year, as prices drift along the same path as last year.

Since January lamb prices have been up and down. They are still better than last year but are following a similar trend and easing from January levels. Forward pricing has generally been anticipating a price rise at some stage, but it is yet to eventuate.

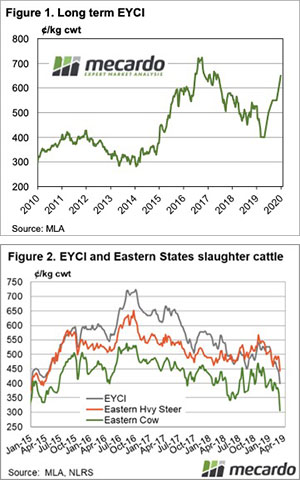
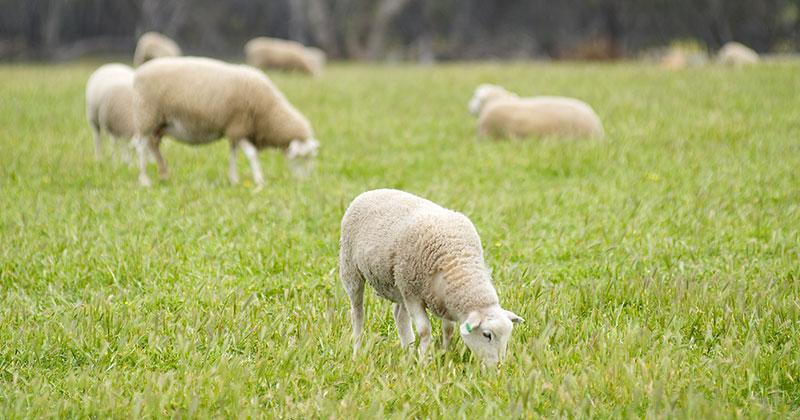
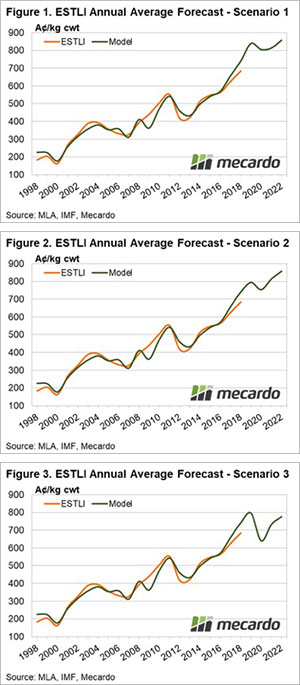
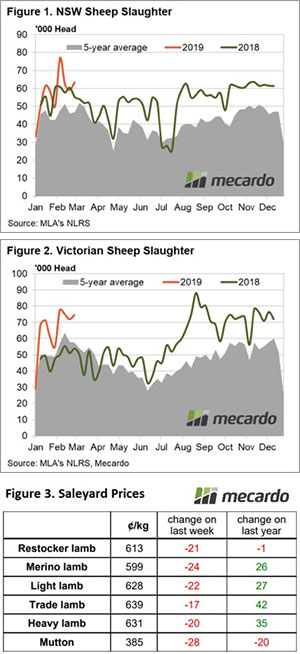
As outlined in our article earlier this week, lamb supply has been surprisingly strong and sheep supply has easily outstripped last year’s levels. Supply is keeping a lid on prices but, as we know, strong demand means prices have never been this strong at this time of year (Figure 1).

The only reason to really be disappointed with prices is if lambs were bought and fed. Selling these in the current market is likely to have resulted in a loss. Homegrown lambs have never made better money in March.

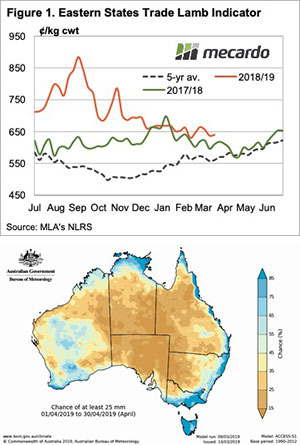
There is a little cause for optimism on the price front, however. The Bureau of Meteorology (BOM) is forecasting around a 50% chance of most of Victoria and NSW receiving median rainfall. Another way of looking at this is shown in figure 2. It shows the chance of getting 25mm in April. It’s pretty good for a lot of sheep country, if we raise it to 50mm, there is a lot less blue and a lot more brown.

What does it mean/next week?:

We received more correspondence this week regarding flocks consisting of fewer ewes having lower scanning rates. Again, we saw this last year and it really came home to markets from July through to September. Unfortunately to take advantage of high prices, lambs either have to be very late or very early.

What we do know is that those with the ability to carry lambs through winter, or get them up to weight early, will see some handsome payoffs.

Lamb price modelling

We’ve been working on upgrading our lamb price forecasting abilities at Mecardo and have recently developed an interactive modelling tool that allows us to forecast the annual average level for the Eastern States Trade Lamb Indicator (ESTLI) based on key supply and demand inputs.

In this analysis we take the model through a test run, playing out a handful of scenarios for the next few years to see the potential impact on lamb prices.

The forecast model uses predictor inputs such as the Australian dollar level, annual Australian lamb slaughter levels and demand metrics based on per capita gross domestic product (GDP) measures from some of our key export destinations to forecast an annual average ESTLI level.

Figure 1 shows how the model compares to the actual ESTLI since 1998, including a forecast based on financial market consensus for the A$ level over the next few years, the Meat and Livestock Australia annual lamb slaughter estimates from their 2019 Sheep Industry projections and the GDP forecasts from the International Monetary Fund (IMF).

It suggests that growing wealth from offshore consumers will keep demand strong for our lamb exports and underpin prices for the ESTLI to see it average around 840¢ in 2019, dipping to 806¢ in 2020 as lamb slaughter rates in Australia increase.

However, we can adjust the lamb slaughter levels in the model to play out a second scenario that would test what the impact of a dry 2019/2020 will have on the ESTLI if slaughter rates increase from 21.5 million head in 2019 to 22 million head and if the 2020 lamb slaughter lifts from 22.1 million head to 23 million head – figure 2. The result of the increased slaughter is to see the ESTLI forecast for 2019 drop from 840¢ to 795¢ and the 2020 forecast decline from 806¢ to 755¢.

We can also imagine a third scenario where the increased lamb slaughter levels coincide with a shock to world growth levels during the 2020 season that limits the demand for lamb exports from our key offshore destinations. This could be in the form of a Chinese credit crunch impacting upon the Asian region and/or increasing US interest rates flowing through to softer global GDP growth levels.

Scenario three forecasts the ESTLI dip in 2020 extending further on the back of the decrease in offshore demand to see it average 640¢ before recovering back above 700¢ as GDP growth recovers beyond 2021 – Figure 3.

What does it mean/next week?

Interestingly, the model predicts a continuation of historically good price levels for lamb into the next few years even after we account for unforeseen problems such as an extended dry period within Australia, resulting in higher than expected slaughter levels, and/or a short-term hiccup to world growth and red meat demand.

Indeed, the model doesn’t forecast an annual average ESTLI below 600¢ in the next four years under any of the three modelled scenarios.

Key points:

  • Price modelling for the ESTLI based on current MLA slaughter projections and global demand growth for lamb consumption estimates annual average prices above 800¢ for the next few years.
  • Assuming a drier climate and higher slaughter than currently forecast will place the estimates for the 2019 and 2020 season into the 800¢ to 750¢ range.
  • The inclusion of a demand shock due to falling growth levels could see the ESTLI annual average drop towards 650¢.

Lower style wool drags on the market

This is the third consecutive week where the market has recorded losses, with the blame sheeted home to the drought on the east coast and the subsequent diminished supply of better style wool.

AWEX report that the national average yield on Merino fleece for the week was 63.6%, the lowest level in over 10 years.

The Eastern Market Indicator (EMI) again pulled back over the week, falling 29 cents or 1.4% to 1,979 cents. The Au$ was slightly stronger, which didn’t assist buyers with the EMI in US$ terms down by just 18 cents to end the week at 1,397 US cents (Table 1).

In Fremantle, the Western Market Indicator (WMI) gave up another 30 cents on the back of 20 cents fall last week to settle at 2,127 cents.

40,785 bales were offered for sale this week, 4,345 fewer than last week with the trade clearing 35,682. This is 5,484 bales less than last week, however the cheaper market left sellers unimpressed with 12.5% or 5,103 bales passed in. This Pass-In rate is the highest since last November.

In the auction weeks since the winter recess, 1,020,385 bales have been cleared to the trade, 193,235 fewer than the same period last year. The average shortfall cleared to the trade compared to the same time last year now sits at 6,663 bales per week fewer.

The dollar value for the week was $74.77 million, almost $15.0 million less than last week for a combined value of $2.40 billion so far this season. A simple calculation of $ value divided by bales sold gives us $2,095 per bale across all types, exactly $100 per bale lower than last week.

Crossbred types weren’t missed either, losing between 25 & 40 cents for the week.

Weekly Wool Forwards for week ending 15th March 2019

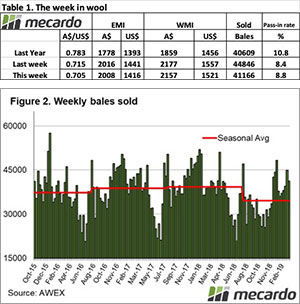
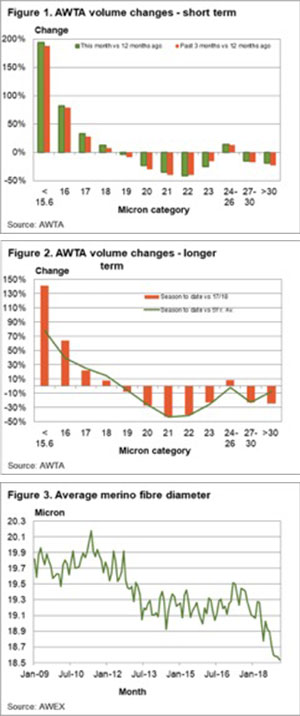
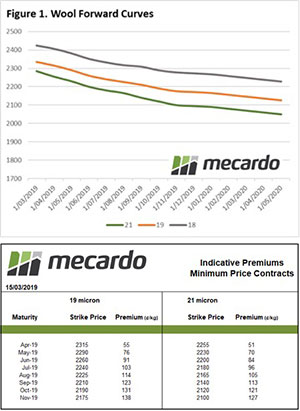
The forwards market picked up ever so slightly from last week with two more trades, but it is still somewhat muted when you look at the last few years for March. It is interesting to see large price differentials in the same Micron category in relatively short time intervals in the forwards market; this could indicate some panic in a falling market or in confidence that the market will continue to fall.   

In the fine wool category, two trades were dealt for 19 Micron, one in June for 2250¢ and the other in September for 2225¢.

In the medium wool category, four trades were dealt for 21 Micron. The earliest was for March, and that was agreed at 2270¢. The latest was for October and agreed at 2115¢. The inbetweeners were for May and September and agreed at 2230¢ and 2130¢ respectively.

This week we have seen the Aussie Dollar regain some of the ground it lost at the tail end of last week. It now hovers around 70.7¢, an average value for the last 3 months. Auction levels have cooled again, but prices are still historically good.

Slaughter and supply in elevator highs

Elevated sheep slaughter continued to drag on mutton prices this week across the East coast and, while sheep supply in NSW is running at levels similar to what we saw this time last season, it is interesting to note that Victoria has seen a significant lift in sheep slaughter rates since the start of 2019 compared to the first few months of 2018.

NSW sheep slaughter levels have been averaging close to 57,100 head per week since the start of the season, only marginally ahead of the 55,800 head recorded for the same timeframe during 2018. Although, compared to the five-year seasonal average NSW sheep slaughter has now had two consecutive seasons where weekly slaughter has been running nearly 30% above the five-year trend, representative of the dry conditions facing NSW producers – Figure 1.

In contrast, Victorian sheep slaughter levels began the 2018 season below the five-year average pattern, with slaughter levels not really taking off until the middle of the season. So far in 2019 it has been a robust start to sheep slaughter levels in Victoria with a weekly average of nearly 65,000 head processed. This is 31% higher than the volumes we saw slaughtered during the same timeframe last season and 26% over the five-year average trend – Figure 2.

The additional supply of mutton across the East coast weighing on prices with sheep prices 5% lower than where they were this time last year, after staging nearly a 7% decline on the week to close at 385¢.

Sheep prices not alone in the price drop this week with all NLRS reported categories experiencing a decline – Figure 3. Although, Restocker Lambs the are the only other category to be lower than this time last season – albeit marginally at 1¢ softer to close at 613¢.

The Eastern States Trade Lamb Indicator (ESTLI) performing best this week out of the NLRS reported lamb categories with only a 2.5% decline to finish at 639¢/kg cwt. Declines ranging between 3%-4% noted for other lamb types.

What does it mean/next week?:

With supply remaining elevated and not much rainfall forecast for sheep country in the coming week there isn’t a lot to inspire a price lift. Although it is worth noting that higher slaughter now will likely mean less available supply when we hit the depths of Winter so there will be plenty of time for price to play catchup then.

Insulation from overseas sensation

The wider world has seen wheat markets fall since the start of the year. Forecasts for the coming global crop look positive, which if realized will result in prices remaining low. However in Australia we are currently insulated from factors overseas.

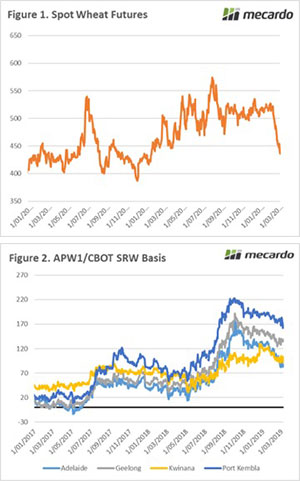
Since the start of February the wheat market has been at the mercy of gravity. On Wednesday the market gained some ground on a short rally, however it was short-lived with futures levels falling back to 11-month lows (figure 1).

The export pace from the US has been sluggish with their pricing uncompetitive versus other origins. At the current pace it is unlikely that the forecasts by the USDA will be met prior to the new marketing season – unless record shipments are made in the next three months.

At a local level, basis levels have fallen however remain at relatively strong levels. The ‘basis’ component of a price can be simplified down to the difference between the local price and the price of a futures contract. This basis can either be negative or positive. In recent years the range has been wide with the majority of the country close to A$20 over CBOT in early 2017. The past six months has seen basis rise dramatically which has insulated local pricing from the wider world.

Many factors impact the basis level such as grower selling, domestic supply & freight costs. The basis strength this year is due to domestic supply being reduced due to drought and consumers being required to pay higher values to ensure that grain is not exported. As we move into the new season, the conditions in the next six months will determine if basis returns back to normal levels.

It’s worthwhile reading my articvle from the end of February (Don’t get caught in the basis bubble)

What does it mean/next week?:

The WASDE report will be released overnight, it is unlikely that there will be much in the way of surprises.

The real drivers in our market will come from consumers deciding if they are concerned about the recent BOM projections and whether they want to remove their price risk for the coming harvest.

Buyers cautious and sellers confident

From a seller’s perspective, this wool market is almost surreal, it is a great time to be selling. However, this week buyers were wary and the market eased. Nothing dramatic but slightly cheaper none the less.

The wool producers response was to increase the pass-in rate; with prices at highest or near record levels, this seems curious, however, the risk associated in the sellers eyes is minimal. Supply into the future will remain constrained.

The Eastern Market Indicator (EMI) eased over the week, falling 8 cents by the end of the week to 2,008 cents. The Au$ was significantly weaker. As a result, the EMI in US$ terms was down 26 cents to end the week at 1,415 US cents (Table 1).

In Fremantle, the Western Market Indicator (WMI) had corrected late last week and pushed even lower this week with a further 20 cents fall to at 2,157 cents.

45,130 bales were offered for sale this week, with the trade clearing 41,166. This is 3,680 less than last week, a sign of confidence from seller’s in the market moving ahead. 8.8% or 3,964 bales passed in.

In the auction weeks since the winter recess, 984,703 bales have been cleared to the trade, 190,094 fewer than the same period last year. The average shortfall cleared to the trade compared to the same time last year now sits at 6,789 bales per week fewer.

The dollar value for the week was an impressive $87.99 million, for a combined value of $2.33 billion so far this season. A simple calculation of $ value divided by bales sold gives us $2,196 per bale across all types.

Crossbred types were mostly up 10 to 30 cents, though 30 MPG were cheaper of last weeks record levels.

The week ahead

According to the AWEX roster, the next week an offering of 41,722 bales is predicted. The roster currently tips a drop with 37,630 and 37,560 bales rostered for the next two weeks.

It is difficult not to be confident going forward, any easing of the market will be met by reduced selling by growers. With supply tight this woud pose a problem for exporters and their mill customers.

Autumn is tanking time

We’ve hit autumn and cattle producers who were holding out have hit the button. Cattle supply has ramped up, as a dry summer and the spectre of a dry autumn sees the Eastern Young Cattle Indicator (EYCI) heading back toward 400¢.

It has been a week of unwanted firsts, at least in the frame of the last three years. For the first time since late 2014, you could buy restocker steers in NSW for just a smidgen above 200¢. This used to be a good price, but that was back in the noughties.

It’s the first time in 3 years that Cow prices have been below 150¢/kg lwt. If we compared to restocker steers, it’s still not a bad price. But compared to the beef they become, the 90CL frozen cow indicator, which sits at 644¢/kg cwt, cows are very cheap.

Earlier in the week, we noted the strong slaughter rates currently afflicting cattle markets. It seems it might have been even stronger this week. Heavy slaughter cattle prices started easing in line with young cattle and cows. Heavy steers lost 50¢ on average this week, the National Indicator broke through key support to hit 443¢/kg cwt this week (Figure 2).

The heavy discounts in cattle prices compared to beef left us wondering how a cattle futures curve would look at the moment.  Something like Figure 1.  Perhaps not so strong at the back end, as concerns about continued dry might see buyers unwilling to pay over 600¢. A return to somewhere near normal rainfall and continued strong export prices, should see prices head back toward 650¢.

What does it mean/next week?:

With no rain on the forecast it will be up to growers being unhappy with prices, and deciding to hold on to cattle to see prices steady.  Given the falls over the last fortnight, this might not be too much of a stretch, as not a lot has changed to see prices fall so heavily.

The big changes in wool supply continue

Low supply remains a key issue in the greasy wool market, with the uncertainty of projected production for 2019 easily leading to various views on what is likely to happen. For the supply chain this uncertainty is magnified by language and cultural differences. This article takes a look at the latest AWTA core test volumes for February.

To illustrate the uncertainty of greasy wool production, search the internet for good merino wool supply data for Russia, China and South America. You will be hard put to find up to date historical production data, let alone reliable production projections. In Australia our historical production data is excellent (https://www.awtawooltesting.com.au/index.php/en/statistics/awta-analytics ) and while production projections are better than in other parts of the world there is plenty of room for improvement.

In Figure 1 the year on year change in volume for the past month and past three months by micron category for AWTA core test volumes (farm bales) is shown. The changes are in line with those seen since the early spring; more fine merino wool and less broad merino wool, with similar changes in the crossbred categories.

Figure 2 repeats the analysis of Figure 1 but for longer time frames. The season to date volumes for a range of micron categories is compared to the previous season and for the average of the past five seasons (all data used is July to February). The fall in broad merino volumes shown in Figure 2 is looking like it is becoming a structural change with 21 micron volumes down by 40% on the 2017-18 season and also compared to the five season average.

To summarise these changes in supply Figure 3 shows the average merino fiber diameter sold at auction for the past decade. The fiber diameter stepped down in 2012-2013 then stabilised through to 2017 roughly in the range of 19.1-19.3 micron before stepping down again in the past year. The average merino fiber diameter in February was a low 18.5 micron.

Now back to the wool supply chain. Put yourself in charge of mills which use various micron categories of wool, especially the 20-22 micron categories. What do you plan for in terms of purchases in the coming 6-12 months? Do you punt that supply will partially recover or do you assume broad merino volumes will remain at low levels? This is why uncertainty about production in 2019 is unsettling.

Key points:

  • While February AWTA volumes were “only” down by 6% the trends evident since the spring continued.
  • 20-23 micron volumes continue to be well below earlier period volumes.
  • The average merino fibre diameter reached a low of 18.5 micron in February.
  • The supply chain faces some difficult decisions in the coming year with regards to broader merino supplies.

What does this mean?

AWTA data shows a continuation of trends seen since the early spring. In many seasons volumes vary by relatively small amounts, but 2018-2019 is a season when there has been a big shift in production which will require the supply chain to think hard about supply in the coming year and seasons. The drop in the average merino fibre diameter is a good illustration of the marked change in production.

Weekly Wool Forwards for week ending 8th March 2019

The forwards market dropped off to measly pickings this week with only four trades agreed, and one of those was for coarse wool. This is in stark contrast to what we saw through February and even in comparison to last March forwards figures over the last three years.

In the fine wool category, one trade was dealt for 19 Micron in June for 2280¢. In the medium wool category, two trades were dealt for 21 Micron in June, both at 2250¢. In coarse wools, one trade was dealt for 28 Micron in May at 1,050¢.

The Aussie Dollar has come steeply down over the last two days, which would usually see more interest in the forward market from overseas buyers. Physical auction prices are still at record levels, despite cooling slightly this week. The question is whether this week is just an anomaly, or will we see less trades dealt through the rest of March, even with a correction of the AUD?