 The fundamental international market news was bullish this week, but markets seemed to focus more on local issues. Broader indicators managed hold their ground, or even rally a bit, but at the state level there were some heavy price declines.
After a brief decline last week, the 90CL export price rebounded this week as tight supply, and expected tighter imported beef drove US buyers to bid up. While not quite back to the highs of a fortnight ago, the 90CL rallied 8¢ to 645¢/kg swt.
The other bullish fundamental news was the Indian ban on cattle slaughter, which will obviously take some time to play out. However, there might have been a reaction of sorts from restockers, who were seemingly the only buying group who paid more.
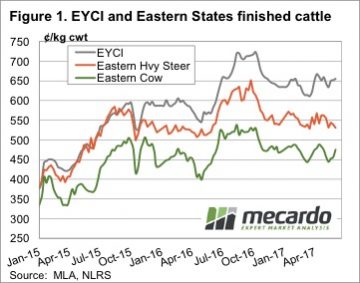
 Restockers pushed the EYCI higher, as shown in figure 1, it gained 4¢ for the week to hit 655.25¢ a five week high. Cows also rallied, while heavy steers fell.
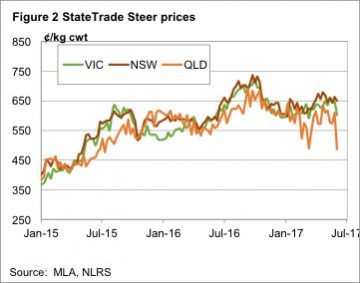
The interesting numbers came out of the trade steer market. Figure 2 shows dramatic falls in Queensland and Victorian trade steer indicators, while NSW held steady. We don’t yet have the yardings for the indicators, but the heavy falls would suggest there weren’t many trade steers sold this week. This is partially backed up by just a 15¢ fall in the national indicator. Much less than the 123¢ and 44¢ falls in Queensland and Victoria.
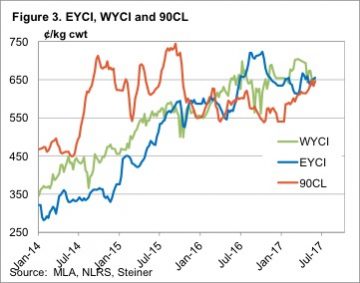 In WA the Western Young Cattle Indicator (WYCI) gained a couple of cents to sit at 650¢/kg cwt. Figure 3 shows an interesting convergence. The EYCI, WYCI and 90CL indicator all sitting between 645 and 655¢. The last time we saw this was in March 2016.
The week ahead
There is no rain on the forecast for the coming week, which is not great for any market upside. However, we are now in June, and it’s very rare for the market to fall to far at this time of year, as supply tightens. As such we might spend a few weeks in a holding pattern, at least until it rains, when we might see a rally.
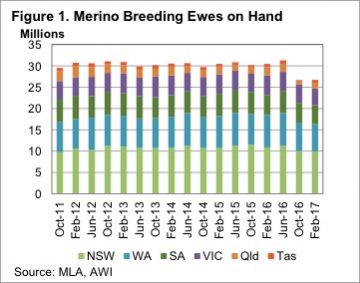 Living in Western Victoria, which is one of the hotspots for the swing to meat breeds, it’s hard to imagine that 69% of the ewe flock is made up of Merinos. Figure 1 in part explains this, with 61% of the nation’s Merinos being in NSW and WA. Just 15% of Australia’s Merino Ewes are now in Victoria.
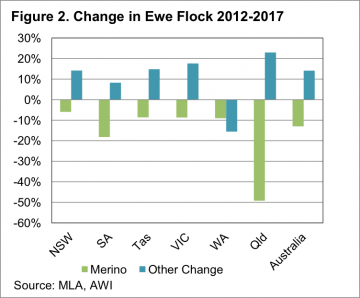 Figure 2 also shows every state except WA has increased their number of ‘other’ breeds since 2012. On a national scale, the decline in Merinos hasn’t been matched by increases in other ewes. However, in NSW and Victoria Merinos have been displaced by other ewes. In WA, SA and Queensland total sheep numbers have fallen.
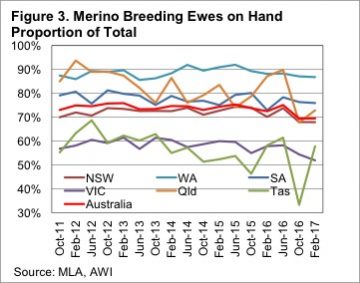 Perhaps it is due to climatic conditions, or it might be due to the fact that Merino’s are bigger and more suited to lamb production in WA, but the West remains a stronghold of the Merino. The proportion of Merino’s in the west hasn’t really changed over the last five years, fluctuating between 86 and 92% and currently sitting at 87%.
 nal OTH prices to see it probe toward the $5 mark, closing just shy at 490¢/kg. WA Trade lamb mirroring the ESTLI percentage gains to see it up 1.1% to 664¢/kg cwt, while WA mutton recovering strongly to see an 8.6% rise to 453¢.
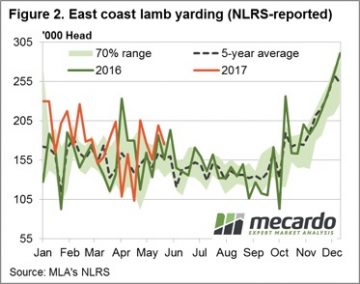 East coast lamb throughput retraced 12% this week to see just over 175,000 head reported through the saleyards. The softer offering broadly supportive of prices, although SA lamb numbers were up 18.7% in contrast to the other East coast states – perhaps another reason for the SA price weakness displayed. Despite the softer week on week East coast lamb throughput the trend is still tracking above the five-year average and higher than this time last year – figure 2. This suggest the current solid prices are drawing out a bit of supply but not enough to curb the recent price gains.
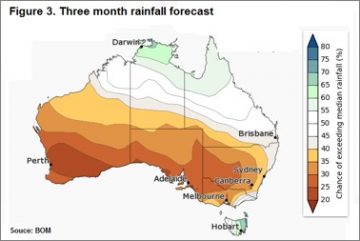 A good sign for robust offshore demand noted with live export wethers up 26% on the week to hit $136 per head out of Muchea. Finally, in weather news of a different kind the Bureau of Meteorology released their next instalment of the three-month outlook showing a drier than normal Winter for much of the sheep rearing regions of the country.
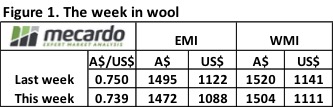 17 to 19-micron fleece registered falls of 55-85¢ across all three selling centres. Melbourne the only auction to offer some finer 16.5-micron wool, but the single source not enough to protect it from registering the largest falls this week closing 113¢ softer to 2135¢/kg clean. Medium wool classes a bit of a mixed bag with 20-25¢ falls in the 20 microns in all centres, 21 microns ranging from a 12¢ loss in Fremantle to a 6¢ gain in the South, while 22-23 mpg wool saw gains from 1-14¢ recorded. Cross bred wool saw Southern 30 mpg shedding 30¢ but the remaining classes posting flat to slight gains of less than 10¢.
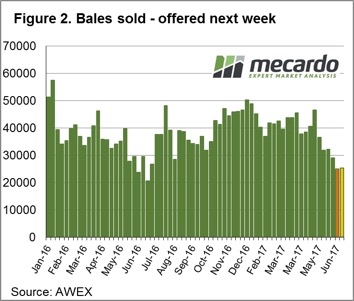 Pass in rates remain higher in the West and the national pass in rate dropping slightly on the week to 12.2% as 24,976 bales were sold out of a possible 28,459. This is the lowest bales sold since late June 2016 although compared to this time last season bales sold this week were 5.4% higher suggesting the relatively higher prices aren’t deterring buyers too much.
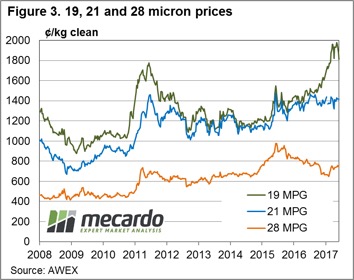

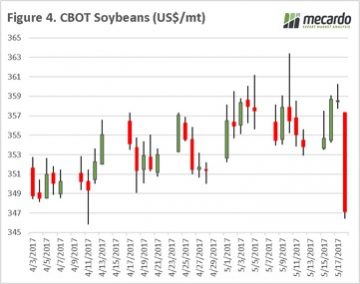
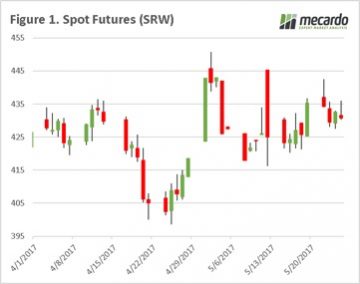 The grain market continues to consolidate over the past week, after the large rise early in the month on the back of the Kansas snow event. There are some small glimmers of hope which are starting to crack through the bearish wall, and lend some support to prices.
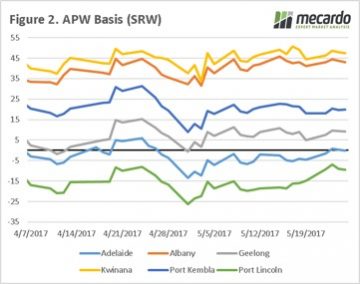 At the moment, we think that we are close to the floor of the market and downside is quite limited. There are a number of weather woes around the world with the possibility of drought across the parts of the northern plains of the US. Locally it is increasingly looking like conditions will be dry over the next three months.
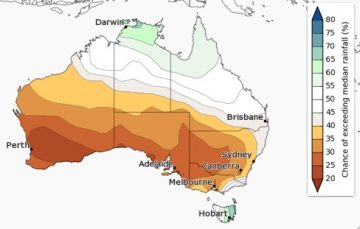 The International Grain Council released their monthly crop forecasts, reducing global end stocks for 2017/18 down 2mmt. This is largely insignificant; however, corn was reduced by 34mmt on the back of increased demand, which will help with sorghum and barley pricing if forecasts are accurate.
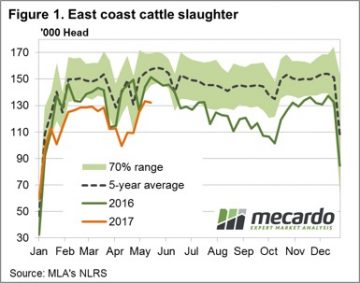 East coast slaughter, for the week ending 19th May, recording a marginally softer result for the week at 132,392 head – figure 1. Most of the East coast states registering a decline in slaughter, although as figure 2 shows NSW slaughter still peaking for the season with 32,268 head recorded. NSW slaughter likely to start the seasonal decline from here though as supply tightens into the Winter period.
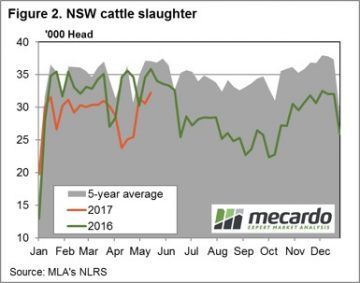 Most national categories of cattle price movements were pretty uneventful this week, although Medium Steers dragged down by SA figures. The National Medium Steer closing the week 4.6% softer to 292¢/kg lwt, Queensland Medium Steers unchanged at 286¢ and NSW/Victorian Medium Steers only 2-3% softer. The killer punch for the national figures coming from SA Medium Steers, down 14.9% to 294¢/kg lwt.
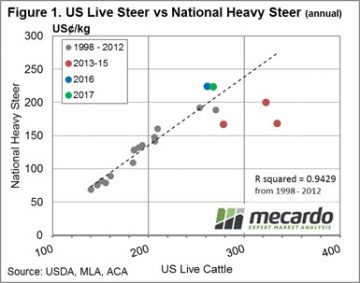 Just as there is a reasonably strong correlation between the annual average EYCI price and the annual average 90CL beef export price, the same holds for annual average prices for US Live Cattle and National Heavy Steer prices. Indeed, as highlighted in figure 1, annual price data for both series converted into US¢/kg from 1998 to 2012 demonstrates a very close relationship. Clearly, the poor seasonal conditions and high turnoff locally for cattle during 2013-15 had an impact on local Heavy Steers prices, remaining in undervalued territory for much of the period (red dots below the line of best fit).
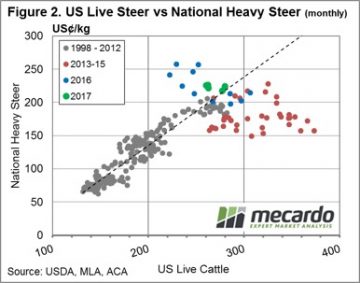 This situation can be seen more clearly by taking a look at the monthly average price comparisons between US Live Cattle and Heavy Steers – figure 2. Interestingly, recent improvements in US Live Cattle prices during March/April 2017 have meant that local Heavy Steer prices are much more in line with what could be considered normal long term levels, as identified by the green dots for the 2017 season moving closer toward the line of best fit.
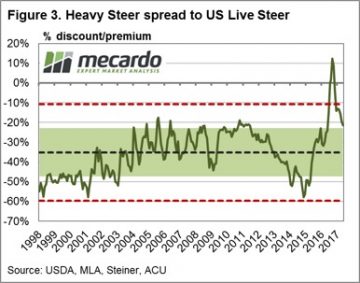 Currently the rebound in US Live Cattle Futures has seen the discount spread return to just above the top of the “normal” range at around 21% discount. While still some way off from the longer-term average spread discount of 35%, it has taken some of the topside pressure off local Heavy Steer prices that would have been evident when the spread was sitting at a premium during late 2016.
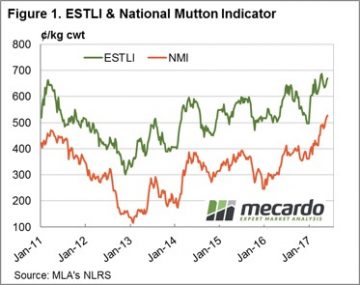
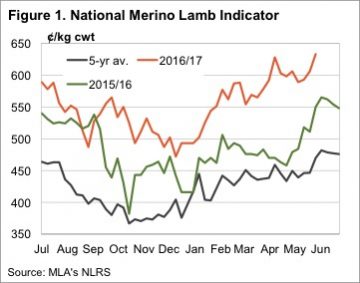 If ever there was a year to have held onto sheep and lambs, this was it. We are only in May and Merino lambs have moved further into uncharted territory, the National Merino Lamb Indicator this week hitting 633¢/kg cwt (figure 1).
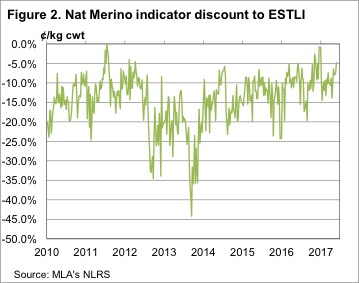 It looks like restocker demand is pushing mutton prices along, they are 40% stronger than this time last year. The ESTLI is ‘just’ 16% higher than last year.
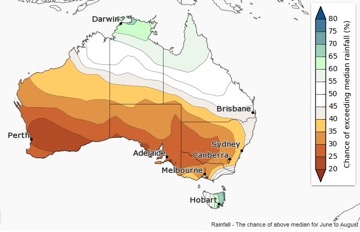 If we do see drier than normal conditions, it should mean lighter lambs, sold earlier, and weaker prices. Rainfall could continue to defy the forecasts, but there is some significant downside price risk come late winter.
 Largest magnitude falls were noted for the finer microns with price decreases between 50-100¢ noted. Medium fibres posting declines in the 10-40¢ range, while crossbred fleece just 5-10¢ softer. Southern 28-micron and Cardings in all centres the only categories to record slight gains.
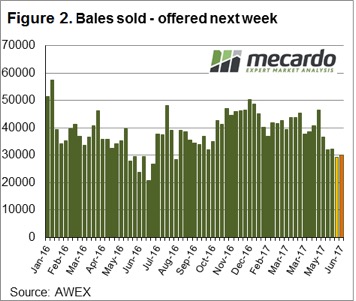 The general view among growers appears to be that supply is tight and mills don’t have much stock in the pipeline so there seems to be a reluctance to chase a falling market. Clearly, in the short term the volume of bales on offer are expected to contract further. However, over the longer term an eye needs to be kept on the trend in demand, as the risk is always there that overseas buyers adjust down their purchasing requirements to reflect the anticipated lower supply.
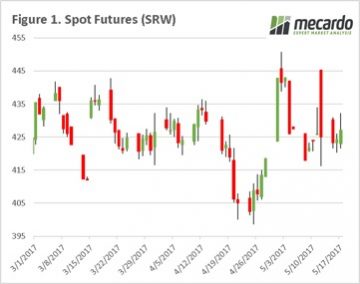 This week the wheat market was largely quiet (figure 1) with a lack of fresh news, there are still continuing concerns in Kansas, however the worries have switched from snow to excess waterlogging. In the coming weeks, we will start to gain more clarity. At a local level basis levels were fairly static with the exception of small increases in Port Lincoln and Kwinana (figure 2). Particularly in Port Lincoln, where there are concerns about lack of moisture for seeding, and with it looking increasingly likely they will miss any falls this weekend.
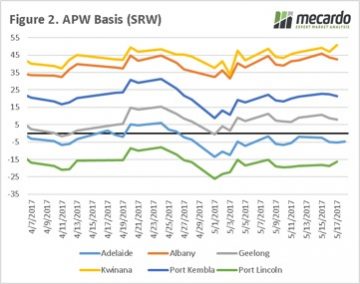 The scandal has reached the top tier of the government with President Michel Temer being placed under investigation for alleged payments of to keep witnesses quiet. All in all, it’s a messy situation which has impacted the Real (figure 3) which plummeted against the US dollar a whopping 7%.
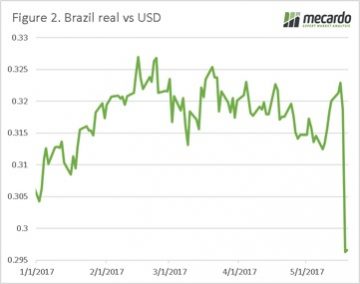 What does this mean?