
A 4.7% fall in the Eastern States Trade Lamb Indicator (ESTLI) this week to close at 611¢/kg corresponded with a decline in lamb throughput across the eastern seaboard, perhaps a case of supply being held back as the price retracts. Not the case with mutton, however, as prices held reasonably steady (1.2% firmer to 421¢/kg) and mutton throughput staged a lesser magnitude fall.
Figure 1 showing the 20.8% decline in lamb yarding numbers for the week nearing 179,000 head, although still above the 2016 pattern and 14.2% higher than the five-year average, indicating that prices still above 600¢ enough to keep some lambs coming forward.
A closer look at price movements within the state categories of lamb is a bit mixed. Victorian prices for most categories only slightly softer, except Trade and Heavy Lambs down 5% and 5.8%, respectively. NSW lamb saw falls in the 3-8% range, with Merino Lamb leading the way down posting a 7.8% drop. SA and WA a bit more erratic reporting a mixture of reasonable gains and losses across the board – SA Restocker Lambs leading the pack up 11.7%, while WA Restockers the laggards with a 20.9% decline.
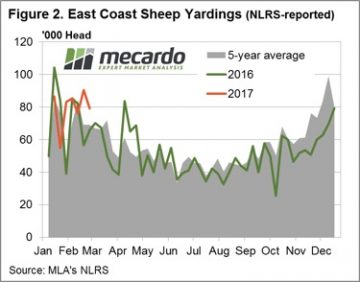 SA and WA mutton both faring well this week up 11.8% and 13.1%, respectively. NSW and Vic mutton on marginally softer with falls of 0.7% and 2.1%. Figure 2 showing the weekly decline in East coast mutton throughput not as severe as that for East coast lamb, down only 12.2% to just under 80,000 head.
The week ahead
As suggested in the market commentary from mid-February, the big question is whether the broadly higher east coast lamb and sheep yarding levels are being fuelled by the reasonably good price levels and are there more to come, particularly if the price softens further.
Given the general tighter season anticipated there is probably a good chance producers will start to hold back if prices ease too far and we may be in for a bit of price consolidation.
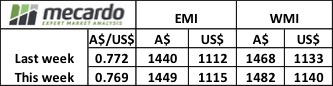
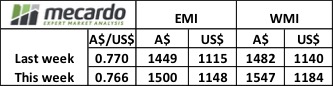 The broad-based demand evident in the higher EMI in both local and US$ terms, gaining 51A¢ and 33US¢, respectively. The EMI not the only indicator to crack $15 this week with the WMI posting a 65A¢ rise, or 44¢ in US$ terms – Figure 1.
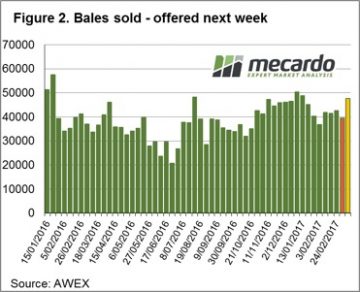 Some exporter reports of just not having access to enough wool to sell at the moment really fuelling the surge. A total of 40,626 bales offered this week with 39,461 sold on the red-hot demand kept the pass in rate contained to 2.9% – Figure 2.
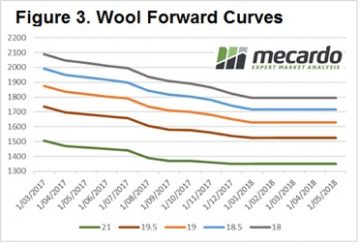
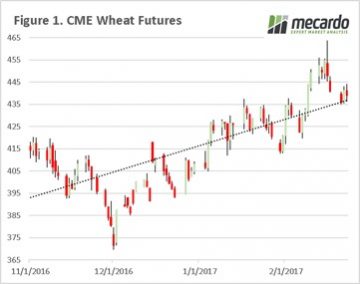 The futures market has improved since the start of harvest, but locally that hasn’t transpired into higher prices. In this week’s comment, we look at the direction of the market since the beginning of November, and where the winners and losers have been.
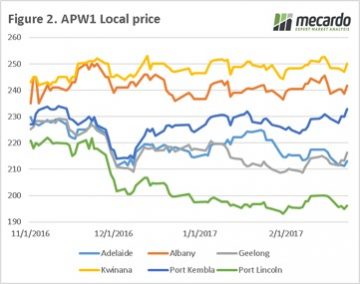 When we look at a local level, at the physical APW1 price (figure 2), the trend across most ports has been for the market to trade in a narrow band and is currently sitting at similar levels to the start of November. The glaring exceptions are Adelaide, Port Lincoln and Geelong which are trading substantially below their start of harvest pricing levels.
 All eyes on the weather. Locally the BOM point towards it being drier than normal for the next three months, which will start to zap away some of that beneficial subsoil moisture that has been retained from the wet winter and spring.
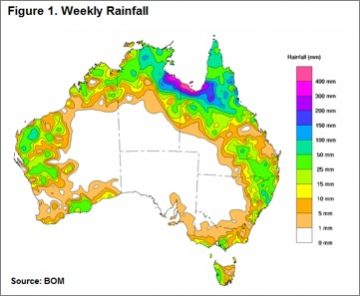 Much of NSW and south-east Queensland has received less than 30mm of rain this week and the drier/hotter than normal spell since the start of the year in the north, combined with the much drier than usual March to May rainfall outlook (recently released from the Bureau), seems to have brought forward some supply with Queensland slaughter levels still tracking higher this week weighing on the broader market.
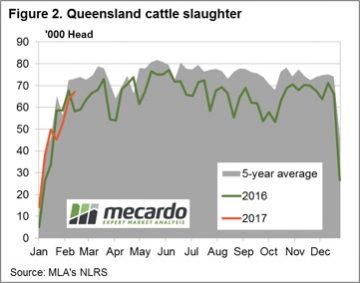 The northern price declines weighing on the Eastern Young Cattle Indicator (EYCI) to see it drift to lows not seen since June 2016 to close the week down 2.4% to 621.75¢/kg cwt – figure 3.
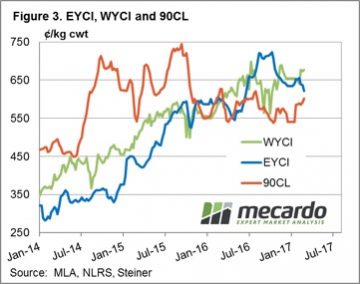
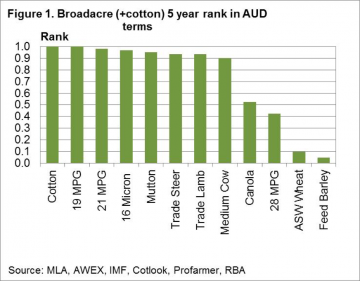 Figure 1 shows the January 2017 five year price rank for a range of broad acre (plus cotton) commodities grown in Australia. The price rank is looked at in Australian dollar terms, as farmers here in Australia see the prices.Basically the news is all good for livestock products (wool and meat) with the exception of crossbred wool (represented here by the 28 MPG). Five year price ranks are all in the top decile, meaning they have traded at lower levels for 90% of more of the past five years. Cotton also is trading in the top decile. At the other end of the scale lie canola, wheat and barley, with canola performing reasonably well by trading at median levels. Wheat and barley are in the bottom decile for the past five years.
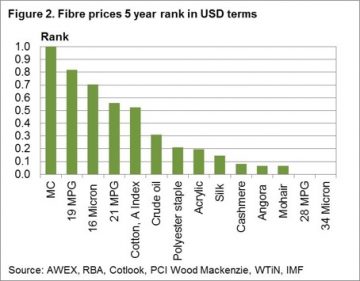 The next step is to look at these commodity prices from outside of Australia. In this case we use US dollar five year percentiles and break the commodities into groups. Figure 2 looks at fibres, including wool from Australia and a range of other apparel fibres. The price ranks range from a high top decile performance by the Merino Cardings indicator through to bottom decile performances by cashmere, angora, mohair and crossbred wool. The merino combing indicators perform well (ranging from the sixth to the ninth decile) well above oil and the synthetic fibres. Cotton comes in close to the 21 MPG in the sixth decile. The longer the disparity continues between the high merino rankings and lower rankings for the major fibres, the more likely some demand will shift out of merino (especially the broader side of 19 micron) to alternative fibres.
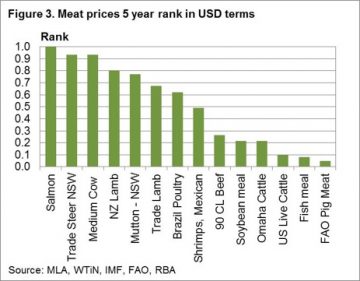 Figure 3 looks at meat and protein prices from around the world. Salmon is the best performer followed by Australian beef and Australasian sheep meat prices. At the other end of the rankings are range of US beef quotes, along with fishmeal and the FAO pig meat index. The big discrepancy between Australian and US beef price ranks indicates some risk to Australian prices if US prices do not lift.
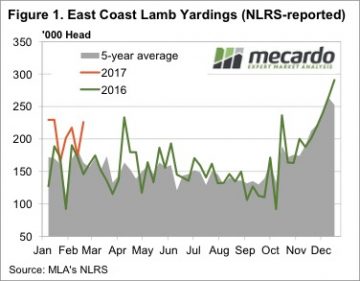 Just when we thought lamb supply was surely starting to wane, this week saw east coast yardings jump to their second highest level for the year. Figure 1 shows east coast lamb yardings, which were 55% stronger than the same time week last year.
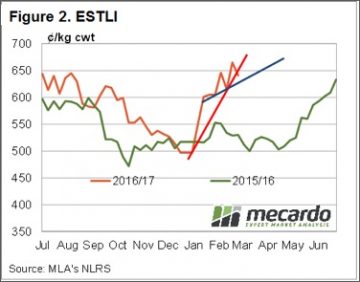 In WA lamb prices defied the larger yardings, rising 18¢ to 576¢/kg cwt. The WATLI is showing an impressive upward trend, and has hit a 2.5 year high (figure 3).
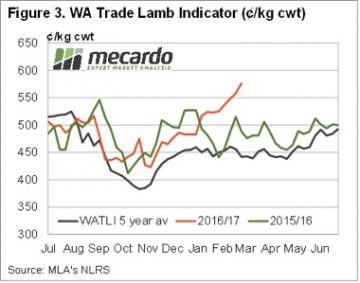
 The EMI was up A$0.09, while in US$ terms it improved 3 cents with the Au$ quoted slightly lower for the week. Cardings continue to out-perform, with all 3 selling centres reporting strong increases and the relative Cardings indicators all nudging 1200 cents. (Fig 1.) Note that before 2011 the Cardings indicator rarely bobbed above 600 cents.
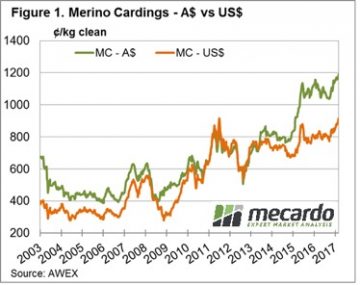 Two points regarding clip preparation are worth noting as the wool market dynamics continue to evolve. These points are at the extreme ends of the micron spectrum with change noted in the fine & superfine market as well as the X Bred market.
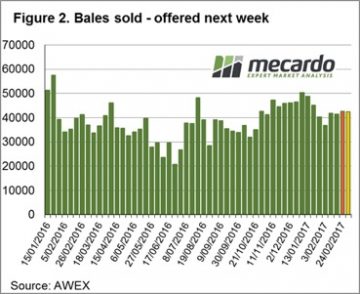 This week Riemann traded solid volumes, with a spread of trades across the 18.5, 19 and 21 MPG types, and for settlements from March 2017 out to July 2018. Price levels were seen as attractive to growers looking to capture some of the market momentum for future clips.
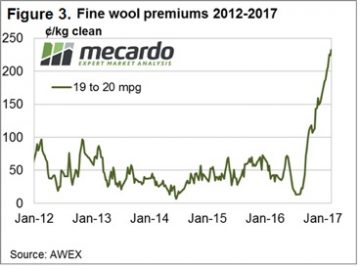

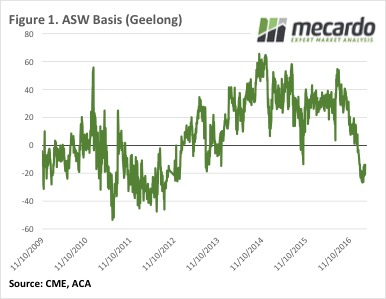 Most of the talk this week has been around ASW, especially in Victoria. With the Shipping Stems showing multiple boats are coming into Melbourne, Geelong and Portland over the coming month, looking for wheat, buyers are having to lift prices to secure supplies.
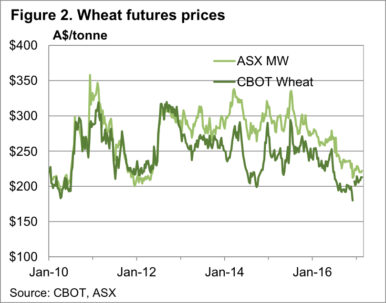 Plenty of ASW has been bought on CLEAR Grain Exchange, and direct through brokers at around $200/t Port in Geelong and Portland. Port Adelaide has seen action on ASW between $190 and $200/t. In the Melbourne Port Zone ASW had been up to $205/t.
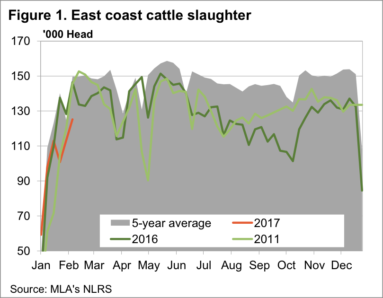
 It remains a bit confounding that the supply dearth is concentrated in the southern states, given that the herd liquidation, and subsequent rebuild, should be concentrated in the north.
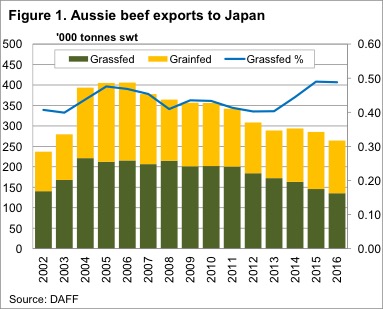 Prices for beef exported to Japan has been easing of late, which is a bit of a concern, given Japan is our major high value export market. With Japanese beef export prices sitting on a key support level, we take a look at what might happen to markets if prices break lower.
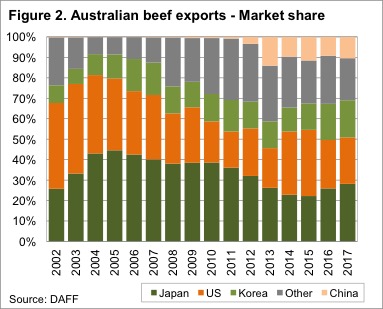 Australian beef has also found markets other than Japan, where the value is similar. The ‘other’ markets, mainly South East Asian Countries, and China, have increased their share of Australian beef exports to 31% in 2016, up from 12% in 2007 (figure 2).
 Figure 3 shows the price of Grassfed Fullsets exported to Japan, along with the 90CL Frozen Cow exported to the US, and the monthly average National Heavy Steer Indicator. Since November the Grassfed Fullset has fallen nearly 9%.