Tag: Cattle

Weather, A$ and grinding beef just not helping local market.

A combination of factors conspiring to see the Australian cattle market soften again this week with the headline Eastern Young Cattle Indicator (EYCI) off another 1.6% to close the week at 574¢/kg cwt. The Bureau of Meteorology (BOM) August rainfall outlook indicates the dry will persist for another month, while the resilient A$ and weaker 90CL continue to act as headwinds on local cattle prices.
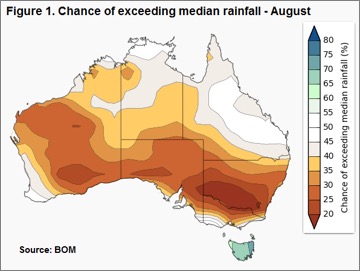
Figure 1 highlights the chance of rainfall exceeding the median levels for this time of year, and it looks particularly unfriendly to southern NSW. Despite much of Queensland enjoying a rosier picture, cattle prices here were among the softest this week with QLD Heavy and Feeder steers bearing the brunt of the negative sentiment – off 6.6% (260¢/kg lwt) and 6.2% (308¢/kg lwt) respectively. Meanwhile, Victorian saleyards registered Feeder steers and Trade steers as their weakest two categories, down 6.2% (301¢/kg lwt) and 4.2% (302¢/kg lwt) between them. In defiance of the BOM outlook the NSW markets were reasonably flat on the week, apart from Medium Cows, marked down 4.3% to 208¢/kg lwt.

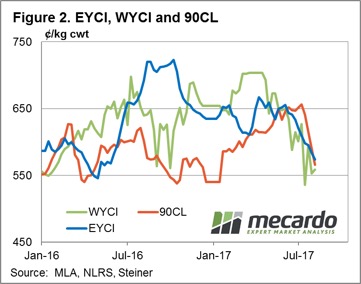
Western young cattle posted a slight rise to 559¢/kg cwt, a gain of 1.1% – figure 2. However, the star performer in WA saleyards were Feeder steers, posting a 9.3% lift to 294¢/kg lwt. Turning off shore, the 90CL frozen cow indicator dropped 4.1% to 566¢/kg CIF as US meat packers reduced their prices in an attempt to encourage an increase in forward orders.

The effect of the stronger A$ being felt too in the 90CL price when converted into local currency terms. Indeed, had the Aussie dollar been at the level it was two months ago, sitting below 75US¢, the 90CL in A$ terms would still be above 600¢ this week.

The week ahead
Some reasonable rainfall is noted for much of WA and Victoria next week, but much of the rest of the country is expected to miss out again. A key factor for the EYCI to find a bit of a base in the next few weeks will be the movement in the 90CL and the A$.

Taking into account the unfavourable August forecast for rainfall it is unlikely that there will be significant improvement in cattle prices due to seasonal conditions. Producers keep your fingers crossed for a softening in the A$ and/or a lift in the 90CL to stem the EYCI decline and perhaps provide some stimulus for firmer prices.

Japanese tariff hike supportive but not game changing

The last week has seen some interesting events in the international beef trade.  The good for Australia was the increasing of tariffs on US frozen beef exports to Japan.  The bad and the ugly was the Chinese temporary ban on beef and lamb exports from six Australian meat processing plants.  We’ll try and make some sense of how the Japanese tariffs might impact on cattle prices, China will have to wait until next week.

The background to the Japanese tariff increase for US frozen beef is a lot to read.  The gist of it is that the year on year increase in imports of US frozen beef for the April to June period was large enough to trigger Japan’s ‘safeguard’ mechanism, and send tariffs for that segment of the market from 38.5% to 50%.

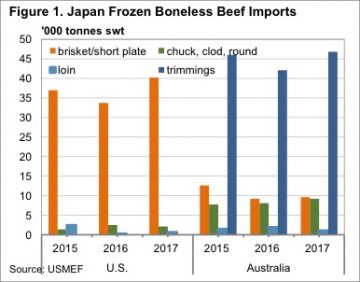
According to the US Meat Export Federation (USMEF), who have produced an excellent fact sheet, a vast majority of US frozen beef exports to Japan are grainfed brisket and short plate cuts.  These cuts are used in gyudon beef bowl chain restaurants.
Australia’s frozen beef exports to Japan are made up primarily of grassfed trimmings, as shown in figure 1, with brisket/short plate cuts at just 26% of the US volume.  It’s not as simple as increasing prices of US beef shifting demand for that type of cut to Australia, as we simply don’t have that amount of beef available for export.

The likely result of the increase in US tariffs is stronger demand for brisket and short plate cuts from Australia, and higher prices, while US processors will receive lower prices, to account for the tariff increase.  Japanese consumers are likely to suffer as some of the increase is passed onto them.

The USMEF have also outlined the risk of a shift to chilled brisket and short plate imports, which could trigger the safeguard for US chilled beef.  Chilled beef makes up 55% of US exports to Japan, so to trigger the safeguard on this would be even more disastrous for US beef.

Key points:

  • Japan have triggered a safeguard increase in tariffs on US frozen beef imports.
  • Most of the frozen beef the US export to Japan is short plate or brisket, a smaller part of Australian exports.
  • The increase in US tariffs will be supportive of our beef export prices to Japan, but unlikely to have too much impact at saleyard level.

What does this mean?

The USMEF calculate that the tariff increase will equate to an effective 8% increase in the price of US frozen short plate/brisket.  The best case scenario for Australian beef exporters is an 8% increase in frozen brisket cuts.  Brisket cuts generally account for around 10kgs of beef in an export slaughter animal.  The latest quote from MLA for frozen brisket to Japan was 598¢/kg, an 8% increase would add 48¢.

The net result on a heavy steer would be $4.80 per head in increased value.  Not a huge benefit, accounting for just 1.5¢/kg cwt.  There is likely to be some spinoff benefits for other beef categories, as higher prices cause some demand shift towards chilled and other frozen cuts.

Heavy slaughter cattle should find some support from higher prices triggered by the increase in US tariffs, but it’s unlikely to outweigh too many of the headwinds the market is currently facing.

Is there any good news for cattle markets?

A quick glance at Meat and Livestock Australia’s (MLA) ‘Market Insider’ on Thursday afternoon would be enough to come to the conclusion that we are headed back to 2013 price levels.  It’s not that bad, but there is plenty of downside pressure coming on the market.

The first story states that US herd expansion is continuing.  The latest numbers on the US cattle herd from the United States Department of Agriculture (USDA) put the herd at 102.6 million head.  This is a 6 year high, and up 7 million head from the 2014 low. The US have added the equivalent of 25% of the Australian herd in just 3 years.
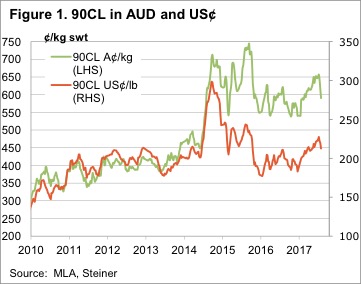
The second story is on beef export prices to the US.  This week they fell 7¢/lb in US terms, or 21¢/kg in our terms.  Figure 1 shows that it took three months for the 90CL to gain 50¢ in our terms.  It takes just two weeks to lose it as issues in Asian markets, and expectations of stronger supplies drive the heavy fall.

Obviously the rising Aussie dollar, which went through 80¢ yesterday, has a bit to do with weaker export prices.  This was the third story on the ‘market insider’.

All this has no doubt contributed to the fourth story, weaker grid prices in Queensland, which has the Heavy Steer 53¢, or 10% below the same time last year.

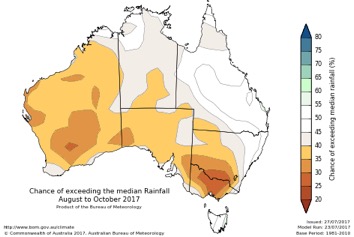
Finally, we come to the fifth story, which is more of the same on the weather forecasting front (Figure 2).  While key cattle areas of Queensland and Northern NSW are back at a 50:50 chance of getting more than the median rainfall, the dry is forecast to continue for southern NSW and much of Victoria.
The week ahead

While there is plenty of bad news, the good news is that cattle prices remain anything but disastrous. The lower 90CL prices this week brings it into line with the EYCI, despite it falling further to 583¢/kg cwt.  The EYCI is now not far off falling below the 2015 price line, and it is strange for it to continue to fall at this time of year.  There is a reasonable chance the market will find a base soon.

All recovered on the Western front

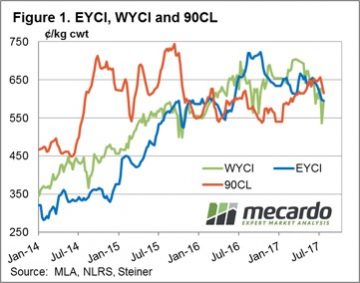
As noted in the commentary from last week the extreme drop in the Western Young Cattle Indicator (WYCI) righted itself somewhat this week, staging an 11% recovery to close at 595¢/kg cwt. The Eastern Young Cattle Indicator (EYCI) largely trekked sideways with a slightly softer bias, down only 0.5% to match the WYCI at 595¢/kg cwt.

The 90CL frozen cow beef export indicator continued to slide this week, dragged down by a reduction in boxed beef forward sales in the US over the last few weeks. US meatworks report an 18% drop in forward bookings so have realigned their pricing to lower levels in order to attract additional forward sales interest. The 90CL settling 3.1% softer to close at 615¢/kg CIF – Figure 1.
National cattle indicators were largely supported by gains in Queensland this week with most categories broadly unchanged. National Medium Steers the standout performer, up .2% to 293¢/kg lwt. National Feeder Steers, the laggard this week as the lift in grain prices continue to bite, staging a 1.5% fall to 318¢/kg lwt.

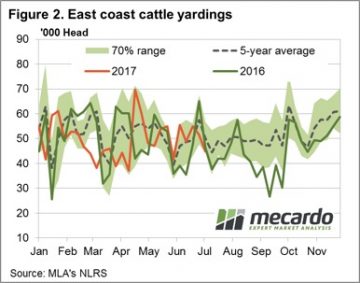
East coast producers responding to the recent price declines with a further pullback in yardings noted this week to see just short of 45,000 head reported through the saleyards– Figure 2. Weekly throughput is now sitting 10.9% below the five-year average for this time of the season.

The week ahead

Despite the fall in the 90CL this week the indicator remains above the EYCI, combined with the steady decline in cattle yardings, this should start to add some support to cattle prices at the current level. Although, the rain forecast for next week shows limited falls to the southern tip of the nation so it’s unlikely that prices will get too much of a kick up. Consolidation at current levels seems the order of the day.
Restockers still in the game

When we set out to write this article, we thought it was going to be about how restocker demand was on the wane, and one of the reasons the cattle market was falling.  While restockers are paying less, they are still buying plenty of cattle.
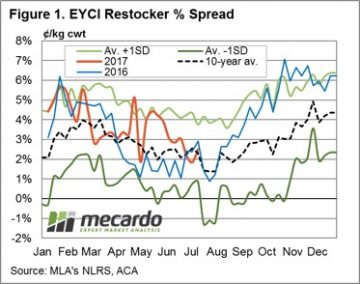
With the dry weather being experienced across much of the east coast, we expected to find restocker demand had been weaker.  Figure 1 shows the spread of the price paid by restockers for EYCI cattle, compared to the EYCI itself.

Restockers are not paying as much of a premium as they were, but it has only fallen back to average.  Last spring and summer restockers were paying 4-6% more than the EYCI.  As the restocker premium eased in March, as did the EYCI.  When restocker demand ramped up again, the EYCI rallied, and subsequently fell again, seemingly on the back of the restocker premium falling from 4% to 2%.

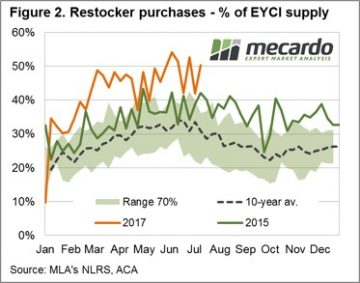
With the weakening in the restocker premium, figure 2 shows that restockers are not buying any smaller proportion of cattle.  Over the last 9 weeks restockers have bought 49% of EYCI cattle, compared to just 38% over the same period last year.  It would seem the falling premium being paid by restockers is more due to increased supplies of suitable cattle.

This is somewhat confirmed by the smaller fall in the price paid by feeders for EYCI cattle over the last six weeks.  Figure 3 shows that feeders are paying 7% less than at the start of June, while restockers are down 10% and processors price have weakened 8%.
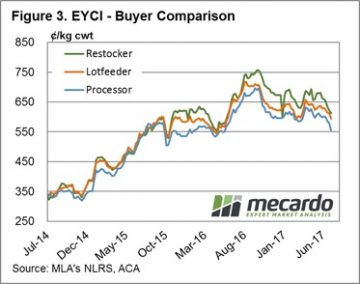
It does stand to reason that during dry times more light cattle, suitable for restockers, will come to market.  This also means that fewer heavier store cattle suitable feeders will be available, while the supply of finished cattle, for processors will be even weaker.

We are still some way from the drought spreads of 2014-15, when restockers, feeders and processors were all paying the same price.

Key points:

  • Dry weather has pushed the EYCI lower, with the restocker premium falling back to average levels.
  • Restockers are still buying plenty of EYCI cattle, which suggests supplies of restockers types are higher.
  • Widespread rain would see a turnaround in light cattle supply and restocker demand.

What does this mean?

Stronger supply of light store cattle is not the only reason for the weaker EYCI, but it is contributing.  For those lucky enough to have feed on hand, the fact the restocker cattle are now more in line with historical premiums to the EYCI means they are reasonable buying.
Widespread rainfall on the east coast would see a rapid turnaround in young cattle supply and prices, but there isn’t much encouragement on the forecast.  Further dry weather is likely to see the EYCI continue to ease, and the restocker premium fall back to zero.


Forecast says more cattle coming

As we move past the half way mark of the year we can start to get an idea of how cattle supply is faring relative to industry forecasts. Those looking to sell cattle in the second half of the year will not only be hoping the weather does the right thing, but also that Meat and Livestock Australia’s (MLA) total cattle slaughter forecasts are an overestimate.
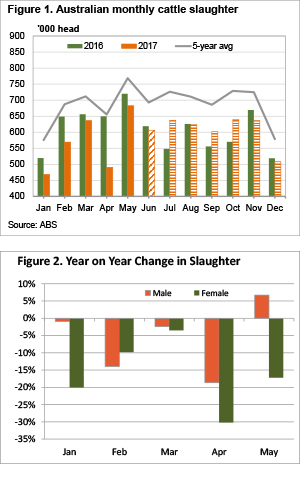
MLA’s latest cattle projection forecasts, released in April, pegged 2017 national cattle slaughter at 7.1 million head. According to the Australian Bureau of Statistics (ABS) the first five months of 2017 saw 2.84 million head of cattle go over the hooks. According to MLA’s weekly slaughter figures June cattle slaughter was around 2% behind 2016.

Figure 1 shows that using the ABS figures, and MLA’s numbers for June, has 2017 slaughter trading well behind 2016. Our estimate puts cattle slaughter for the first half of 2017 at 3.45 million head, 9.4% lower than 2016. More importantly, the total number of cattle slaughtered to the end of June is just 48.6% of MLA’s annual forecast.

For July to December we have applied average seasonality to the number of cattle which still need to be slaughtered to reach 7.1 million head. For the July to December period cattle slaughter will have to lift 5% on last year’s levels.

July 2016 was a very low slaughter month, as were September and October, when compared to the five year average. This is why figure 1 has most of the increased slaughter for the second half of the year in those months.

Figure 2 shows that the herd rebuild in the first five months saw the year on year decline in female slaughter outstrip their male counterparts. Up until May female cattle slaughter was down 16%, while male slaughter was down just 6%. Male slaughter was actually higher than last year in May.

On face value we can say that if supply is to pick up in the second half of the year, were more likely to see an increase in cows and heifers, than steers or bullocks.

Key points:

  • Cattle slaughter for the first half of 2017 has been 9.4% lower than 2016, and not on track to meet forecasts.
  • If Australian cattle slaughter is to meet forecasts, it will have to be 5% higher than last year.
  • An increase in cattle supply is likely to see prices remain below 2016 over the coming months.

What does this mean?

Simple economic theory says that higher supply, and steady demand, will result in lower prices. We are already seeing lower prices than last year in cattle markets, but the question is, how much lower can prices go? Given where export beef markets are sitting, and the fact we should be hitting the seasonal low point for cattle supply, it’s hard to see too much further downside in the short term.

However, if it remains dry we head into September, the increased supply could push the EYCI back towards the low 500¢ level. Downside is likely to be stronger for cows, while heavy slaughter steers are likely to fare better, as supplies haven’t been held back as hard in the first half of the year.

Down in the east tanking in the west

The Eastern Young Cattle Indicator (EYCI) fell for the sixth straight week, and took most other indicators with it. In the West prices tanked, but it might be an outlier. The story remains the same, with dry weather and relatively high prices encouraging offloading of stock.
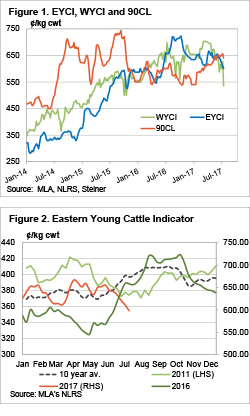
Even the 90CL Frozen Cow Indicator got in on the falls this week, it tanked, losing 18¢, or nearly 3%, to 641¢/kg swt. Increased slaughter here is reportedly starting to impact supply, on the positive side, here.

Figure 1 shows that while the 90CL was lower, it’s still well above the EYCI, and this is one of the measures we use to judge cattle value. For the first time in nearly two years the EYCI seems undervalued.

Most other cattle categories drifted lower this week, to the tune of 10-20¢/kg cwt. The exceptions were cows, which managed to gain 5-10¢ in Queensland and Victoria.

Higher grain prices looking to be starting to bite feedlots. While still historically very strong, feeder prices this week fell 5-15¢ to range from 318¢ for Domestic feeder heifers, to 363¢/kg lwt for long-fed export steers. With grain prices now around $100/t higher than harvest, feedlots are obviously going to try and either increase grainfed cattle prices, or decrease feeders.

We suspect it may have been on small numbers, but the Western Young Cattle Indicator (WYCI) fell heavily this week, losing a massive 91¢ to hit a 22 month low of 536¢/kg cwt. Given that over the hooks quotes for yearlings in WA remain in the 580 (Grassfed)-630¢ (MSA) range we’d expect to see a bounce in the WYCI.

The week ahead

The movement in the EYCI this year is really like no other year. It is almost a mirror image of 2016, and cattle producers will be hoping this doesn’t continue. If it does we’ll be headed for sub 550¢ levels. It takes a very short memory if you think 550¢ isn’t an acceptable price. A good general rain will fix the ‘low’ price problem, there just isn’t one on the horizon.


No rain, no grain no price gain for feeders

Grain prices have been on the rise. So what? A cattle producer might ask. How will it impact me? It depends what sort of cattle are being produced, but if it’s feeder cattle, rising grain prices are not good news.
Lotfeeders buy a large proportion of young cattle, and the other major input into a grainfed steer is obviously grain. The higher the grain price, the less money lotfeeders can pay for feeder cattle.

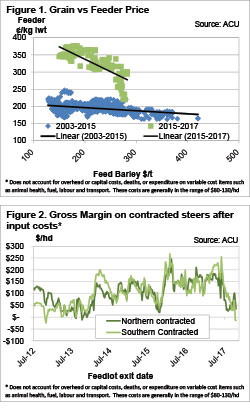
Figure 1 shows that feeder cattle prices have historically had a strong relationship with feed barley prices, but we can also see how this relationship has shifted since 2015. As grain prices rise, feeder cattle prices fall. The trendline on figure 1 shows that from 2003-2015, on average, a $50 rise in grain prices would equate to a 4.5¢/kg lwt fall in the feeder cattle price.

The trend became more pronounced at higher cattle prices after 2015. For the last 2.5 years a $50 rise in grain prices has, on average, equated to a 36¢/kg lwt fall in feeder cattle prices.

Over the last month east coast wheat prices have rallied significantly. New crop APW wheat has rallied $30 over the last month, while feed barley is up by a similar amount. Figure 1 shows there is actually a reasonably wide range of values of feeder prices at any given grain price, and this is due to other fundmentals.

Figure 2 shows how dire the move in grain prices might just be for lotfeeders. While many will have grain pre-purchased, those buying barley at current values, and paying 360¢/kg lwt for feeder cattle, are likely to be losing money.

Fortunately for feeder producers, young cattle supply is at its tightest level for the year over the coming two months. This may support feeder prices in the short term, but in the long term, higher feed prices are likely to start to bite young cattle values.

Key points:

  • Grain prices have a negative relationship with feeder cattle prices.
  • The strong rise in grain prices is likely to have pushed lotfeeder margins into the red.
  • Feeder cattle prices need to fall 30-40¢ to counteract the rise in grain prices.

What does this mean?

If grain prices and grainfed cattle prices remain around current levels, what price do lotfeeders need? On figure 2, lotfeeders need about $80-100/hd to break-even after overheads. The good news is it’s not a disaster. If feeder cattle prices fall to 330-340¢/kg lwt, it will be enough to see lotfeeders move back into the black.

On the upside, cattle producers growing heavy steers might actually find some support for finished cattle prices. Rising costs of production of grainfed beef generally tighten the supply of finished cattle, and push prices higher. Additionally, the decrease in the price of finished cattle, is unlikely to be reflected in the price of finished cattle, if it is due to grain price rises.

Heavy steers holding young cattle folding

It was a better week for rainfall, with sporadic showers across the country, but it didn’t help the young cattle market. The Eastern Young Cattle Indicator (EYCI) continued its fall this week, but there was some support for slaughter cattle.
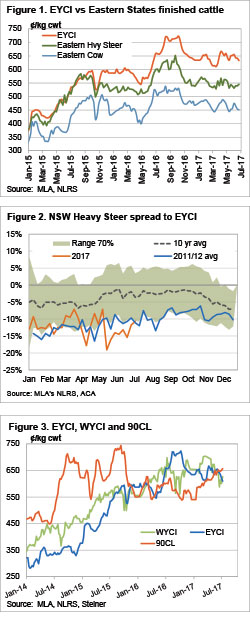
The EYCI fell a further 10¢ this week to hit a 12 week low of 610.75¢/kg cwt. This price is not far off a 12 month low, and now around 7% below the same time last year. A small rise in yardings was likely responsible for the fall in the EYCI, but there might be some waning restocker and feeder demand.

It doesn’t seem to be demand or supply of slaughter cattle which is sending the EYCI lower. Figure 1 shows that while the East Coast Heavy Steer price has reached the stratospheric level of last year, it hasn’t been falling in line with the EYCI lately.

Figure 2 shows that there is still some way to go for heavy steers to reach the ‘normal’ spread to the EYCI for this time of year. The NSW Heavy Steer has rallied from near a 20% discount to the EYCI to an 11% discount. The average for this time of year is 2%. If the spread returns to 2%, it will mean the EYCI has to fall to 560¢, or the Heavy steer will have to rise to 600¢.

Over in the West the slide in the Western Young Cattle Indicator has halted, and it even rallied a bit this week, finishing at 627¢/kg cwt.

The 90CL Frozen Cow Indicator was up 10¢ in a short week in the US to 656¢/kg swt. This is a 20 month high, and 9% stronger than this time last year. Processors are definitely doing a better job of keeping a lid on prices this winter.

The week ahead

Rainfall is forecast to again be sporadic, not really providing too much impetus for prices rises. The cold weather should start to bite on the finished cattle market, although with record cattle on feed, and rising grain prices we could see more cattle from that sector.

Young cattle supply doesn’t come from nowhere, and this is likely to support values in the short term. If the late winter and spring does fail however, the 550¢ mark is shaping as an initial target.

Live export market share and price relationships

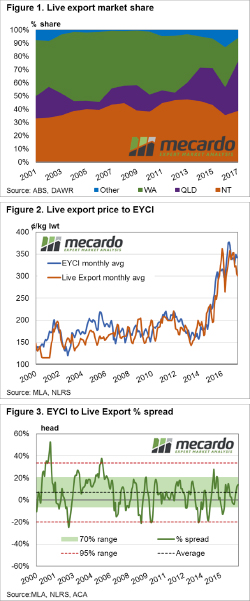
It has been some time since we had a look at live cattle exports so we thought it timely to focus in on the changing market share of the live cattle trade among the key export states, along with the price relationships that exist between live cattle and domestic young cattle.

Figure 1 outlines the percentage of market share in volume terms that are attributed to the three largest exporting states for live cattle, namely the Northern Territory (NT), Queensland and WA. Historically, NT and WA have held the lion’s share of the trade volumes over the last two decades. NT market share has been relatively stable fluctuating between the seasons from 35-45% of the total trade volume. In the last five years there has been a noticeable expansion of volume exiting Queensland. Indeed, for much of the period from 2001 to 2013 Queensland accounted for 10-20% of the trade. However, in recent times the proportion of live cattle leaving Queensland has extended toward the 25-30% range.

Turning our attention to price movements we can see a fairly strong relationship between average monthly EYCI prices when compared to a Live Export Index (created by averaging the live weight prices per month out of the ports of Broome, Townsville and Darwin). Analysis of the correlation between the monthly EYCI and the Live Export Index shows a correlation co-efficient of 0.83, which is indicative of a reasonably strong relationship between the two-price series. The correlation in price movement increases to 0.94 when the two-price series are compared on an annual average basis.

Analysis of the historic monthly percentage spread between the EYCI and the Live Export Index shows the EYCI to Live Export long term average spread sits at a premium of 7% and spends 70% of the time fluctuating between a 6.5% discount spread to a 20% premium spread (green shaded zone – figure 3). The red dotted lines highlight the 95% range between a 20% discount spread to a 33.5% premium spread, indicative of the extreme ends of the historic range.

What does this mean?

Analysis of seasonal live cattle trade flows shows that volumes out of Queensland tend to peak in the first quarter of the year, while WA peaks mid-year and NT peaks at the end of the season. This would suggest that the current market share of volumes out of Queensland at 28% is likely to diminish slightly as the year progresses and volumes out of WA and NT expand.

The current percentage spread of EYCI to Live Export prices sits at a 14% premium, and within the 70% range banding, which indicates that price levels for the two data series are comfortably within the “normal” range and suggests that neither price is too far over or undervalued in comparison to the other.

Key points:

  • Live cattle volumes exiting Queensland has shown steady growth in percentage market share in the last five years.
  • Movements of the EYCI and Live Export cattle prices show a close relationship over both monthly and annual average comparisons.
  • The EYCI tends to sit at an average premium spread to Live cattle prices at around 7%, but can fluctuate between a 20% discount to a 33.5% premium, dependent upon the season.