Key points:
- The percentage of purchases of young cattle being bought by restockers is outstripping both feed lots and processors.
- Nominal volumes of young cattle being sold to restockers in Northern and Southern saleyards are also above longer term averages this season.
- Price spread patterns show that Southern restockers are more optimistic than their Northern counterparts.
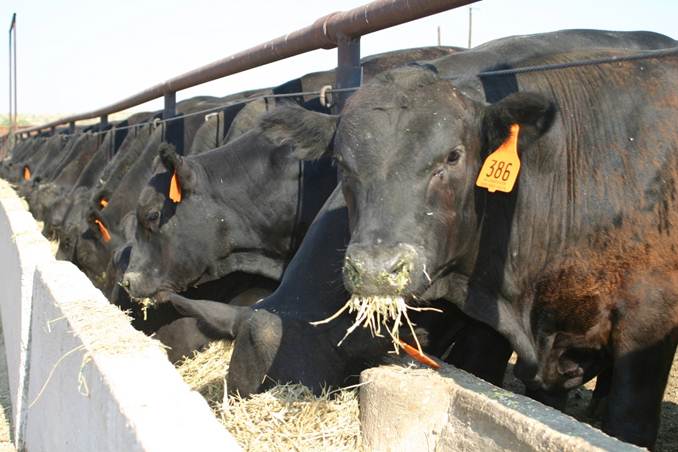
 Anecdotal reports of revived restocker activity within the young cattle market suggest that recent rainfall may have given a boost to prices along the Eastern seaboard. But does the underlying data for the Eastern Young Cattle Indicator (EYCI) show this to be the case and if so, is it evenly spread across the Eastern states? Is just a simple glance at the broad restocker activity all that is needed to give a robust picture of the market or is it central to beef analysis to delve a bit deeper into the figures?
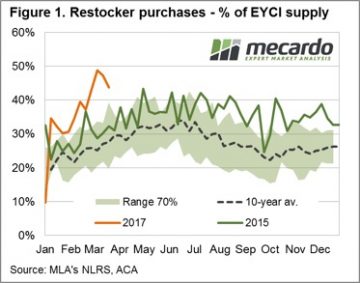
Certainly recent discussions with livestock agents reveal that restocker activity in their area is on the rise and a Meat and Livestock Australia news report from last week somewhat confirmed the trend. Indeed, as figure 1 highlights, the percentage of EYCI stock sold to restockers as a proportion of total EYCI sales for the 2017 season has been on a fairly clear upward trajectory. Although looking at restocker purchases in terms of percent of supply doesn’t necessarily indicate increased nominal volumes are being purchased by restockers, but that the proportion of restocker purchases is higher when compared to cattle purchased by feed lots and processors.
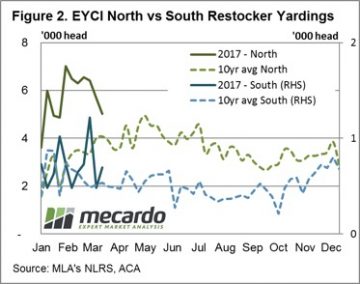 Using the underlying EYCI data we are also able to filter and analyse specific components of the broader EYCI market to determine if the robust restocker demand this season is stemming from a particular region. Separating EYCI restocker purchases into northern and southern saleyard groups, with Dubbo saleyard marking the mid-way point between North and South, we can assess how evenly distributed the restocker activity is along the East coast.
During February the volume of cattle purchased by restockers at Northern sale yards on a weekly basis peaked near 7,000 head (double the volumes of the ten-year average during this time frame, but similar to levels seen during last season). Restockers in Southern sale yards have seen weekly volumes peaking at around 1,200 head during March, which is nearly 2.5 times the volumes normally seen at this time of year – according to the pattern set by the ten-year average (Figure 2).
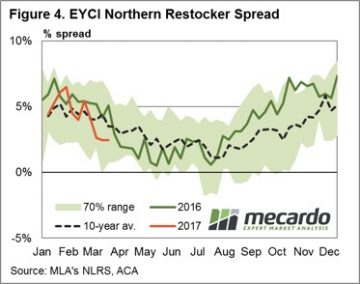
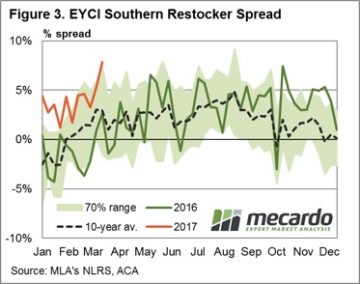 Taking a look at the price spread patterns for Southern and Northern sale yards we can see that there are some stark differences between restocker activity in each region. Figure 3 shows that Southern restockers have been happy to pay a premium spread above the EYCI trending along the top of the normal seasonal range and peaking last week at 8%, equivalent to 687¢/kg cwt. In contrast, Northern restockers are paying a premium spread in the lower end of the normal range and below the seasonal average level for this time of year at 2%, equivalent to 649¢/kg cwt – figure 4.
What does this mean?
 The above average volumes of cattle being purchased by restockers in both the North and South certainly shows the intention to rebuild the herd is evident across the Eastern seaboard. Although, considering the magnitude of destocking experienced in the North during the large turnoff during the 2013-2014 seasons the current volume of cattle going to restockers in Northern saleyards isn’t much dissimilar to levels seen last season.
In addition, the spread pattern of the North and South indicate that Southern restockers are more optimistic of the current season or are experiencing somewhat better seasonal conditions than their Northern counterparts, as signalled by intentions to pay much more above the EYCI than normal for this time of year.
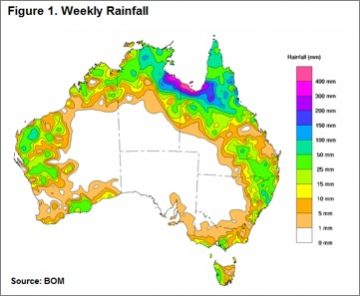
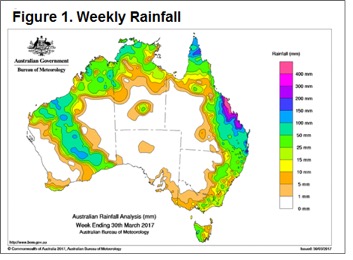 Figure 1 highlights the rainfall pattern across the nation this week with the impact of cyclone Debbie clearly evident. Rainfall further south also present and helping to lift restocker spirits in the southern regions as outlined in the
 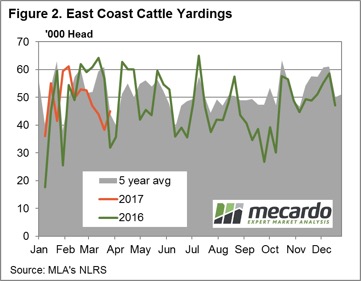 The national cattle indicators mostly higher this week with 2-4% gains recorded for all categories except heavy steers. The national heavy steer indicator dropping 3.4% on the week to close at 294¢/kg lwt. The Eastern Young Cattle Indicator (EYCI) mirroring the broader market up 4.4% on the week to close at 649.75¢/kg cwt. Young cattle prices continuing to find support from restocker buying and the added benefit of higher beef export prices, with the 90CL frozen cow up slightly – figure 3.
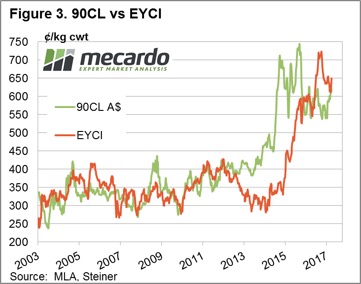
 The rainfall was better than expected, but the impact on price was about right. This week east coast rainfall saw lamb prices move back to a one month high, while mutton jumped to what is very nearly a new record. In the west prices corrected, but remain at the stronger end of the scale.
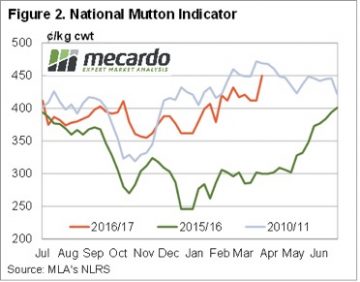 Lamb prices also rallied, but not by the same extent. The Eastern States Trade Lamb Indicator (ESTLI) gained 10¢ to hit 632¢/kg cwt, a four week high. Interestingly, this week was the third most expensive week for lambs this year (figure 3).
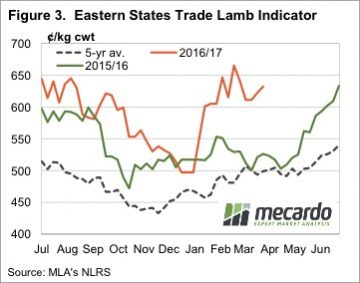 Tight supply continues to support sheep and lamb markets, and with rain this week, there is unlikely to be a lot of pressure to sell, with high prices the only thing that might keep supply flowing.
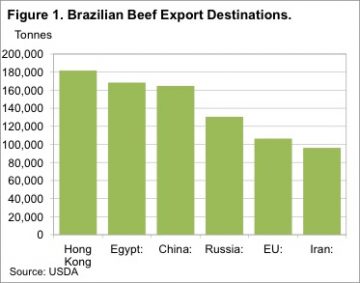 If you read agricultural news websites, or even listen to the ABC’s country hour, you will be aware of the beef ‘scandal’, which has hit Brazil this week. The reasons behind the scandal have been well documented, so we won’t repeat them here. What we will do is look at what a suspension of Brazilian imports might mean for Australian beef exports.
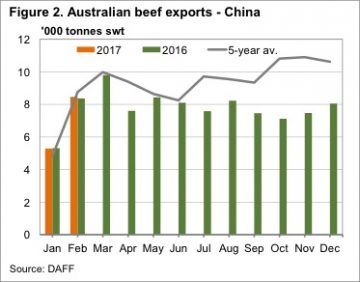 In reality, Uruguay and New Zealand are not really in a position to increase exports to China. Figure 3 shows the Uruguay and New Zealand have much smaller export programs than Australia and Brazil.
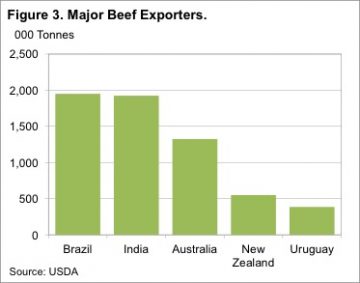 For a country with such a large export program, being suspended from your biggest market is going to be disastrous for beef and cattle prices. In Australia it would be similar to the US or Japan banning our beef, and we then either need to increase domestic consumption or find another market. Prices would fall very, very quickly.
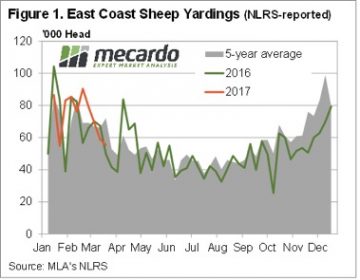
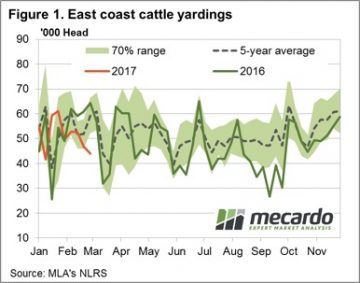 Figure 1 shows the east coast throughput tracking lower again on the week, despite a lift in Queensland yarding numbers, as the southern states start to restrict supply. The 43,900 head reported marginally softer than last week, but quite a bit lower than the same time in 2016 when just over 64,000 head were going through the east coast sale yards.
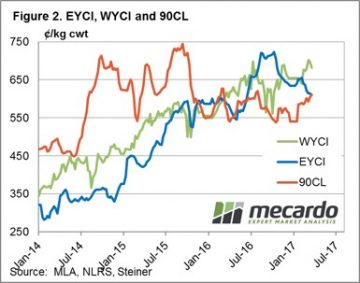 Western prices softer across the board with pastoral cows mirroring the SA medium cow falls, down 25.5% to 168¢/kg, while the Western Young Cattle Indicator (WYCI) only marginally lower to 682¢/kg – a 2.3% drop on the week. The Eastern Young Cattle Indicator (EYCI) reasonably stable, with only a 0.5% decline to close at 611¢, exactly where the 90CL beef export prices managed to finish the week – figure 2.
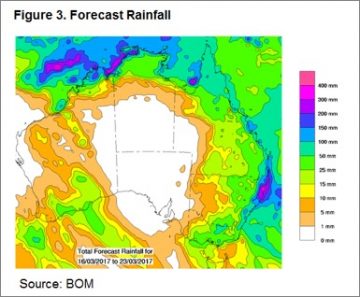
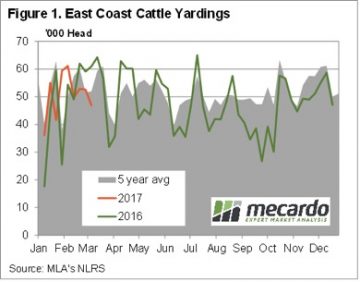 East Coast cattle yardings fell to 6 week lows this week, as lower prices deterred growers from sending cattle to the yards. Figure 1 shows that yardings this week were down 10% for the week, and 23% on the same time last year. With the public holiday next week in Victoria, yardings are likely to be lower again.
 In the West the rain and dearth of supply has the market sitting well above the east coast. While there were no quotes from saleyards, over the hooks yearling cattle remain in the 580-630¢ range.
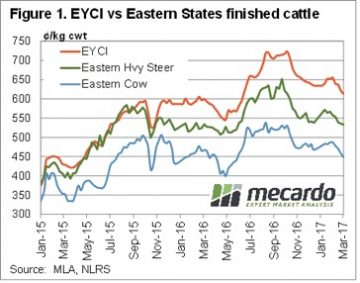 Just as spring price peaks lasted a lot longer in 2016, the autumn price decline appears to be coming early in 2017. While finished cattle prices were relatively steady this week, waning restocker demand appears to be seeing young cattle prices continue easing.
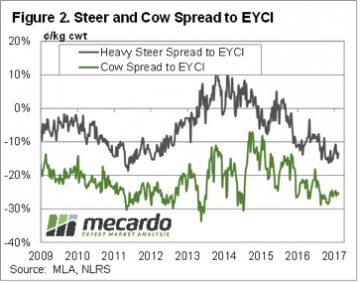 Young cattle still have some way to fall before they are back in line with ‘normal’ discounts to the EYCI. Figure 2 shows that despite the fall in the EYCI, Heavy steers remain at a 15% discount to the EYCI, while Cows are at a 25% discount. Heavy slaughter cattle discounts have narrowed marginally from two and five year lows, but are still a long way from their long term averages.
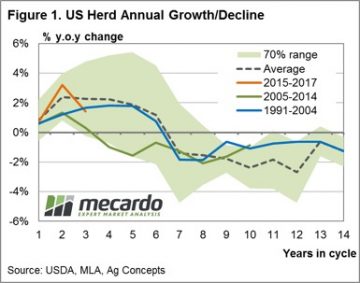 Frequent readers of Mecardo will not find it surprising that long-term annual average local cattle prices have a strong correlation to annual average US prices. This analysis takes a look at the US cattle cycle patterns since 1920 to get a perspective of what the normal cycle looks like, where we are currently in the cycle and the usual price activity during herd growth and herd decline.
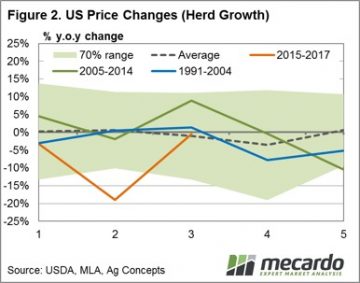 Given the average cycle lasts ten years and the near 50/50 split between herd rebuild to herd decline during the cycle we took a look at annual price percentage changes during the first five years of each cycle (the herd rebuild) and the final five years of each cycle (the herd decline). Figure 2 shows the annual price change pattern for the first five years of the cycle. Interestingly, the data since 1920 demonstrates that the average price gain pattern for the first five years is reasonably smooth and tends toward 0% price movement, yet can fluctuate plus or minus 15% throughout the period. It suggests that there is a reasonably even chance of price gains or falls of a 15% magnitude during the herd rebuild phase of the US cycle – almost like a toss of a coin.
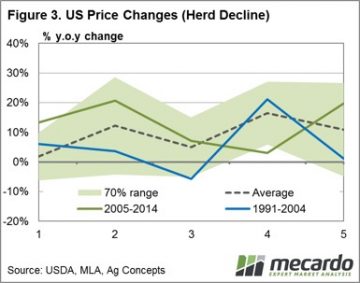 Given where we sit in the current cycle there is the potential for another 2-3 years of further gains to US herd size, albeit at a diminishing rate. Herd decline is expected to start around the end of decade and is likely to see cattle price supported in the US from 2020 onwards.
 Much of NSW and south-east Queensland has received less than 30mm of rain this week and the drier/hotter than normal spell since the start of the year in the north, combined with the much drier than usual March to May rainfall outlook (recently released from the Bureau), seems to have brought forward some supply with Queensland slaughter levels still tracking higher this week weighing on the broader market.
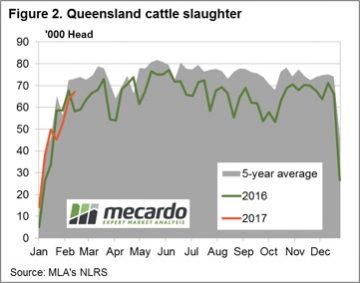 The northern price declines weighing on the Eastern Young Cattle Indicator (EYCI) to see it drift to lows not seen since June 2016 to close the week down 2.4% to 621.75¢/kg cwt – figure 3.
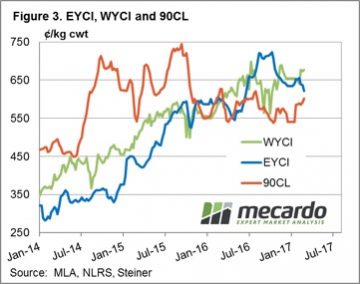
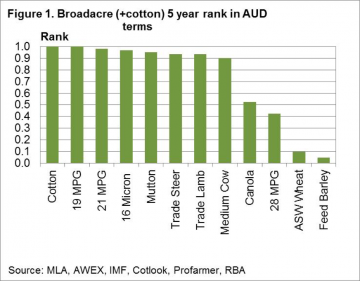 Figure 1 shows the January 2017 five year price rank for a range of broad acre (plus cotton) commodities grown in Australia. The price rank is looked at in Australian dollar terms, as farmers here in Australia see the prices.Basically the news is all good for livestock products (wool and meat) with the exception of crossbred wool (represented here by the 28 MPG). Five year price ranks are all in the top decile, meaning they have traded at lower levels for 90% of more of the past five years. Cotton also is trading in the top decile. At the other end of the scale lie canola, wheat and barley, with canola performing reasonably well by trading at median levels. Wheat and barley are in the bottom decile for the past five years.
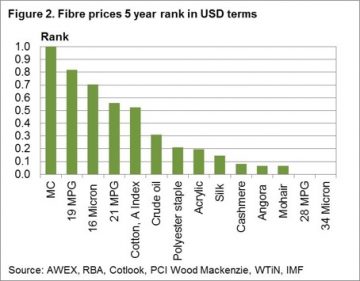 The next step is to look at these commodity prices from outside of Australia. In this case we use US dollar five year percentiles and break the commodities into groups. Figure 2 looks at fibres, including wool from Australia and a range of other apparel fibres. The price ranks range from a high top decile performance by the Merino Cardings indicator through to bottom decile performances by cashmere, angora, mohair and crossbred wool. The merino combing indicators perform well (ranging from the sixth to the ninth decile) well above oil and the synthetic fibres. Cotton comes in close to the 21 MPG in the sixth decile. The longer the disparity continues between the high merino rankings and lower rankings for the major fibres, the more likely some demand will shift out of merino (especially the broader side of 19 micron) to alternative fibres.
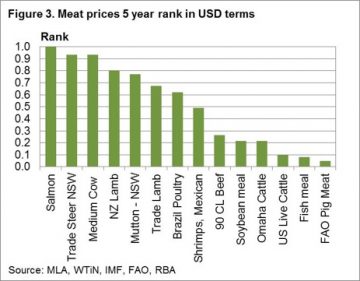 Figure 3 looks at meat and protein prices from around the world. Salmon is the best performer followed by Australian beef and Australasian sheep meat prices. At the other end of the rankings are range of US beef quotes, along with fishmeal and the FAO pig meat index. The big discrepancy between Australian and US beef price ranks indicates some risk to Australian prices if US prices do not lift.