Key Points
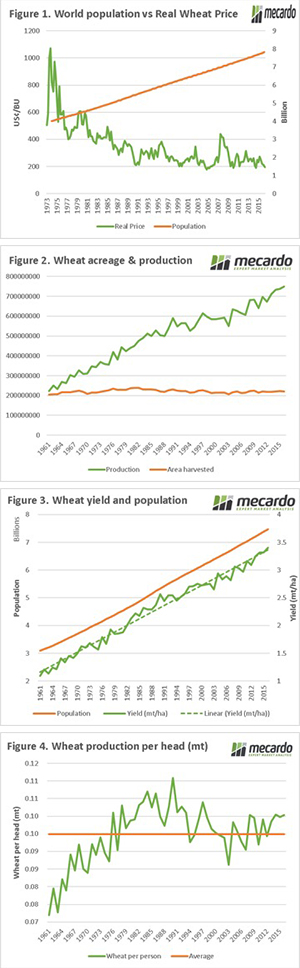
- Real prices of wheat have fallen drastically since the 1970’s, whilst population has drastically risen.
- Farmers around the world have increase production to meet demand, without utilizing more land. The increases have been because of yield improvements.
- Since the 1970’s the world has produced around 100kg of wheat per person.
It’s a statement heard regularly for the past century, the world is growing and it will need to eat. The logic is that with more mouths, there will be more demand. As demand rises, then prices should follow. However, in grain that doesn’t seem to be the case, why is that?
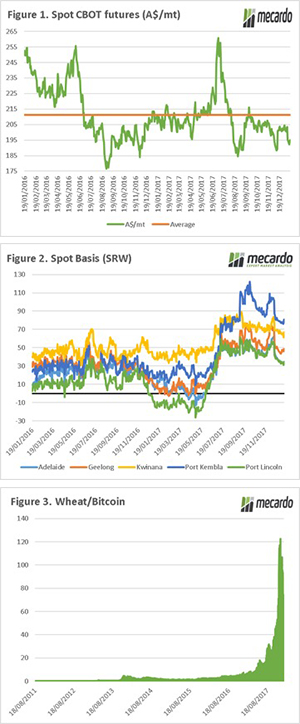
A couple of weeks ago, I was contemplating the price of wheat versus the rise in global population over the past decades. I ended up with figure 1, this shows the real price of wheat (in 2012 prices) against the world population. It is clear that in real terms prices have fallen substantially, at the same time that the population has risen.
It is logical to assume that demand has increased, as the world grows. However, there must be a reason behind the lack of upward movement in pricing. Let’s take a look at production, and what has occurred in the same period.
In figure 2, global wheat acreage and production is displayed. As we can see acreage, has largely remained within a narrow band. We can however see that production has drastically increased in the same period, if it’s not through land increases, it’s obviously yield.
In figure 3, the population and yield are presented. Since the early 60’s to present yields have drastically increased. The average yields in the 1960s was 1.2mt/ha, this decade it is 3.2mt/ha. An astronomical increase brought about through technology, agronomy and management practices. When we compare population and yield, they both run in a very tight parallel as can be seen in the linear trendline.
To further demonstrate our ability to produce wheat on a very large scale, the generative capacity per population is shown. This is the amount of wheat available per person, if shared equally on an annual basis. After a strong increase in yields during the 1960s, the world has continued to provide an average of 100kg’s of wheat per person.
Clearly, human society has been able to advance wheat yields to keep in line with population, at an almost step for step change. This has been because of farmers adopting farming practices which enable them to produce larger crops. However, by meeting demand, has this resulted in a constrain in prices?
What does it mean/next week?:
The world population is expected to follow a linear path until it reaches between 9bn by 2050, and as high as 12bn in 2100. The world will be required to produce a global average yield of 4.3mt/ha to maintain a 100kg’s per person productive capacity.
Is this possible? Well there are still vast tracks of land in the world that are still unproductive, which could bump up yields. There is a lot of buzz around agtech, will new precision ag technologies allow for improve production and efficiencies?
Prices do not always equal profitability, as an efficient farmer with low prices will be more profitable than an inefficient farmer with high prices.
The question is, is higher production the best solution for farmers?. Although production increases will help societies prosper through lower malnutrition, will it provide increases in price?
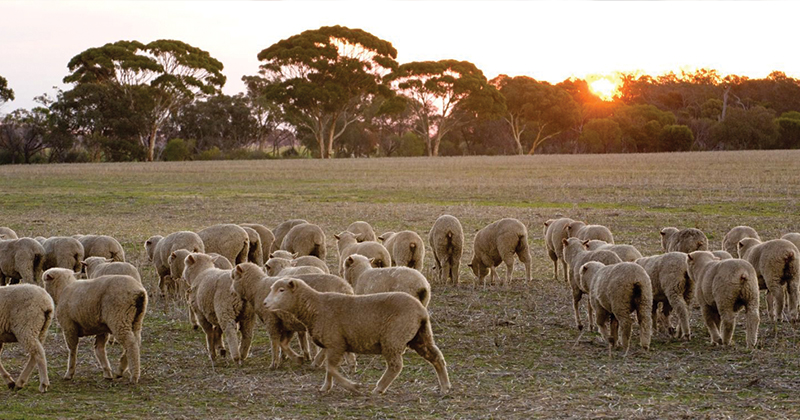
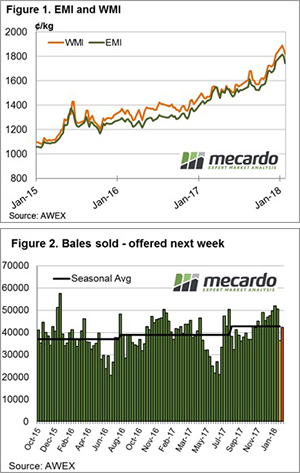 The wool market took a bit of a hit this week with most categories losing ground, with the exception of the very fine end. Cardings were hit particularly hard with the combined average fall for all three centres coming off nearly 200¢.
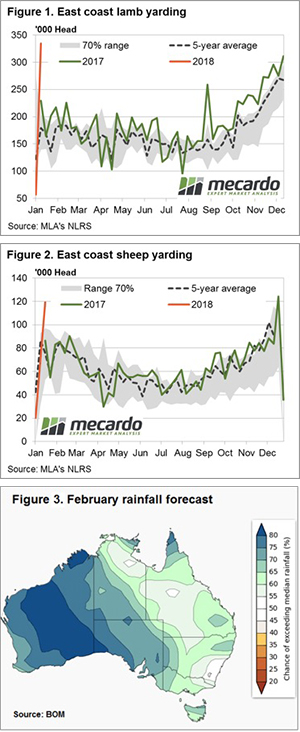
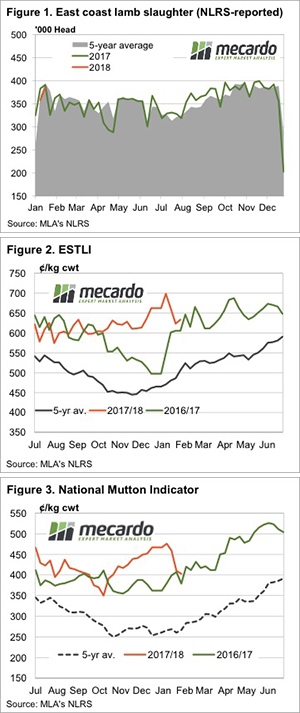 Despite the issues with slaughter capacity in South Australia it seems that we once again managed to achieve a slaughter spike in the middle week of January. In some years the weaker demand in early February has led to weaker prices, but last year it was met with weaker supply, and strong prices.
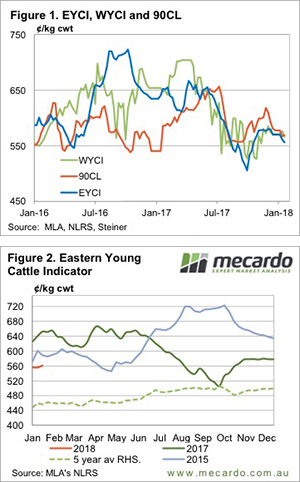
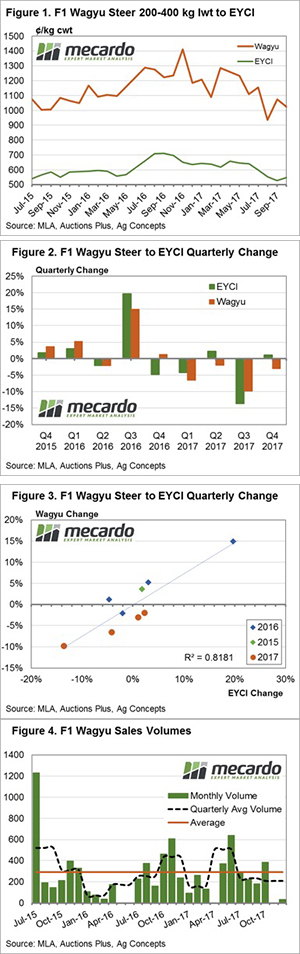 On international Star Wars day last year (May the 4th be with you) the Mecardo team took a look at Wagyu spreads to the Eastern Young Cattle Indicator (EYCI) and a recent subscriber request for a follow up article prompted us to have another look at how the 2017 season played out… and besides we couldn’t resist the chance for another pun in the heading!
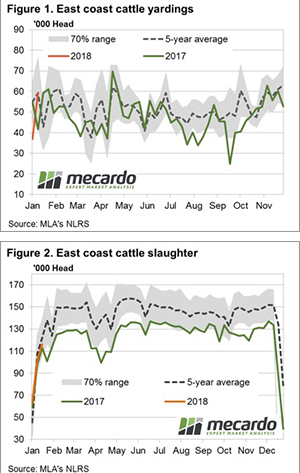 Weekly supply statistics showed a fairly normal pattern for the start of the season, with East coast figures hovering near to the longer term seasonal averages. Although Queensland and NSW throughput were slightly elevated for this time in the year as the Northern wet season continues to be delayed, weighing on prices.
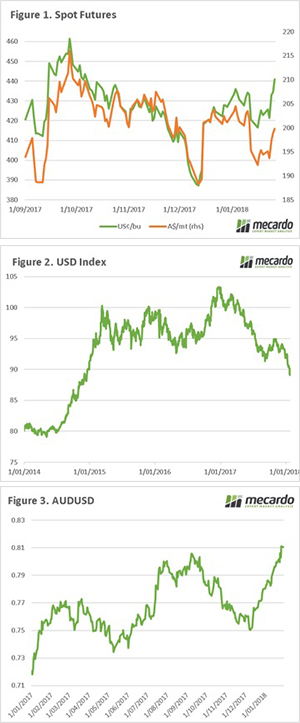
 For the first time in over a month we have the full suite of Meat and Livestock Australia (MLA) data to analyse. Even with all the data, the conclusions look the same. Markets are easing slightly thanks to a lack of moisture and a rising Aussie dollar.
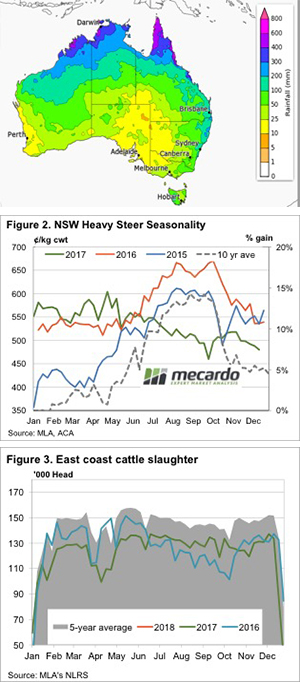 A truck driver asked me when we were going to sell some heavy steers that we have wandering around on some still green country. My flippant response was, ‘when it rains in Queensland and the price goes up’. I then thought I’d better do the numbers and make sure this was a better than 50/50 chance of happening.