 The futures markets are largely quiet, as the northern hemisphere is largely complete for 2017 and seeding progresses for next year. At a local level, it is important to start considering local premiums and how to take advantage of them.
This time of year is always bereft of data to move markets, in this crop calendar (link), it is clear that the year is largely finished for the global wheat crop. The only majors remaining alongside Australia to harvest are Brazil and Argentina.
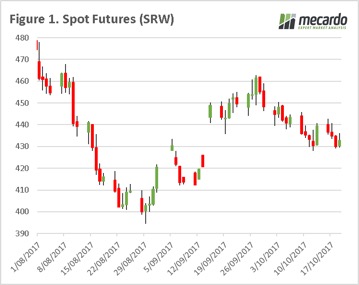
The lack of strong data, has left the market largely directionless. In figure 1, we can see that spot futures have trended downwards since December became the spot contract. Last night was the first this week to end the day in the green, albeit marginally. In good news, US export sales were up considerably week on week, which will help futures prices if maintained.
 At a local level, harvest has begun in the north and it won’t be long until the bulk of farms around the country will be ‘reaping what they have sown’. During October, rainfall has been strong through much of northern NSW and QLD, although not adding much in the way of benefits to the winter crop has added confidence in the summer crop. This has resulted in consumers reducing some of their buying appetite, as they reassess the situation for the coming 6 months.
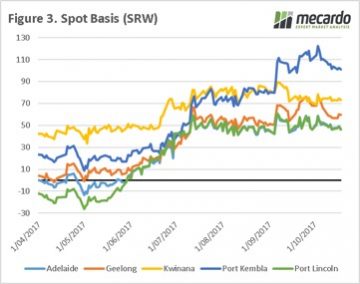
In recent weeks, prices around Australia have started to depreciate. In figure 2, the APW port price is shown for all zones. Over the past ten days prices have fallen 4% on the east coast and 2% in Kwinana. Basis levels have fallen in recent weeks, however remain at strong levels. The lack of grower selling, in combination with the fact that production & carryout will exceed requirements, increases the likelihood of falling prices/basis.
At these very high basis levels, and low futures prices it is worthwhile examining a long swap/reverse swap strategy which has been outlined in ‘Lock in premiums, keep exposure to the market’.
Next Week/What does this mean?
 At present there are considerable premiums available for growers. As growers start to sell the crop, the logic would be for basis to fall.
In order to avoid this, it is worthwhile examining your potential production with a view to commencing your sales program (if not already). This can be carried out through flat price sales or in conjunction with a reverse swap.

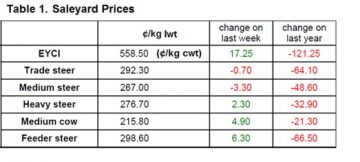 The Eastern Young Cattle Indicator (EYCI) lifted again this week, recovering a further 3% to see it close at 558.50¢/kg cwt with some good rainfall to much of Queensland providing a bit of a boost. Gains noted too across the East coast for Heavy and Feeder Steers, up 1-2% to round out a reasonably firm performance for cattle markets.
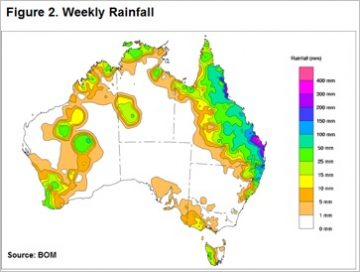 It points to how much optimism was sapped out of restocker buying activity during the Winter dry spell, but that may change if the northern rains continue and NSW starts to get a bit of decent rainfall too. Figure 2 shows the national rain tally over the last week with Queensland the clear beneficiary and next week’s forecast calls for a continuation across much of the north and spreading into NSW which should continue to support demand for young cattle by restockers.
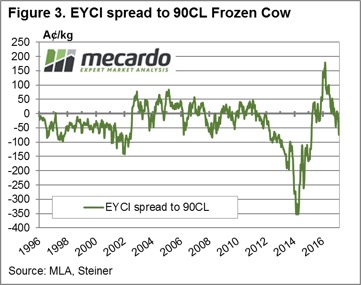 After a recent lift the 90CL is knocking on the door of 600¢/kg CIF again and with the Bureau forecast of a fairly normal November rainfall pattern and a good chance of a slightly wetter than average December all indications are for continued support for young cattle prices in the coming weeks.
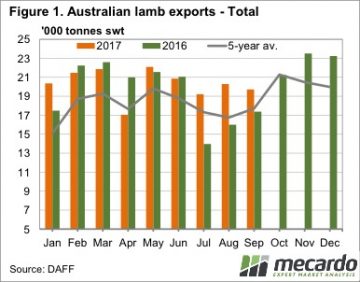 Last week we spent a couple of articles looking at the interesting price phenomenon that we are currently seeing in lamb markets. Strong prices continued last week, in the face of strong supplies, so today we take a look at the export data to see where the extra lamb is going.
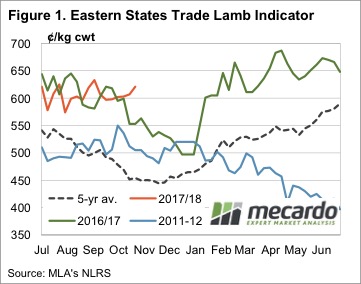
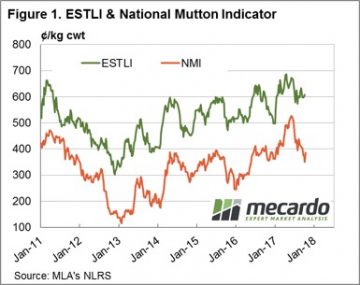
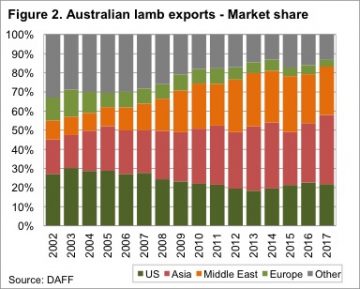 A simple indication of increased demand is the fact that in 2014 the Eastern States Trade Lamb Indicator (ESTLI) averaged 459¢/kg cwt from July to October. This year the ESTLI has averaged 604¢/kg, 31% higher.
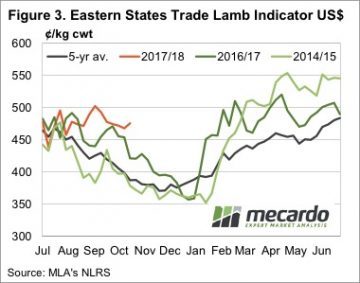 We have in the past seen significant jumps in lamb demand from exports markets, and we might now be seeing early indications of the next one. Significantly larger export volumes, coinciding with similar or stronger prices suggests that consumers in the US, Middle East and Asia have become comfortable with the higher lamb prices seen over the past nine months.
 Spring in general, and October, in particular, are known for falling lamb prices. We usually see supply increasing as winter and spring lambs hit the market, pushing all sheep and lamb markets lower. The price rally this week is particularly unusual.
 After a couple of weeks of intermittent supply data, sheep slaughter has hit 136,925 head (figure 3), the highest level since the end of 2015. Remarkably, mutton prices also rallied this week, the National Mutton Indicator gained 24¢ to sit back at 397¢/kg cwt.
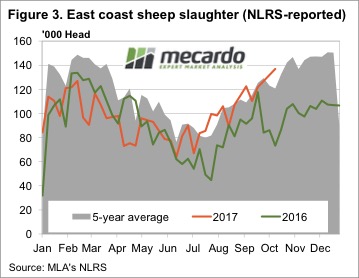 Whether higher prices are enough to draw more lambs to the market while it’s raining is yet to be seen, but we do know that growers who sell lambs in October have never had it so good.
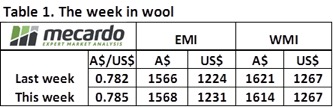 Wool was the hot topic of industry conversation again this week but it wasn’t enough to distract the market from deciding on what fibres it wants to support. Results were particularly mixed with fine fibres attracting premiums whilst the rest of the categories felt losses.
  On the other hand, medium to coarse wools of 19.5 to 23 MPG weren’t as readily sought after. Prices fell on average 20 to 30 ¢ by the weeks close. Crossbred wool followed the lead of the medium to coarse Merino fibres, losing ground across the board. The harshest fall was in 28 MPG at an average drop of 30¢ in both Fremantle and Sydney markets.
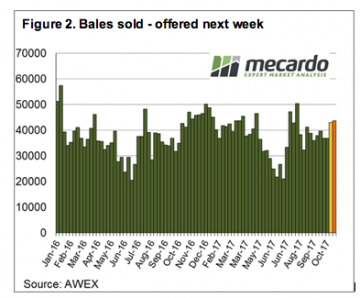 The number of bales on offer next week is expected to drop down to a listing of 43,764 for the three selling centres over Wednesday and Thursday (figure 2). The focus on micron this week might be an indication of where the market is starting to move to. Some strong forward prices in the 18.5 and 19 micron wools where buyers were willing to pay a premium out to next year suggest that preference for the finer wool is likely to grow.
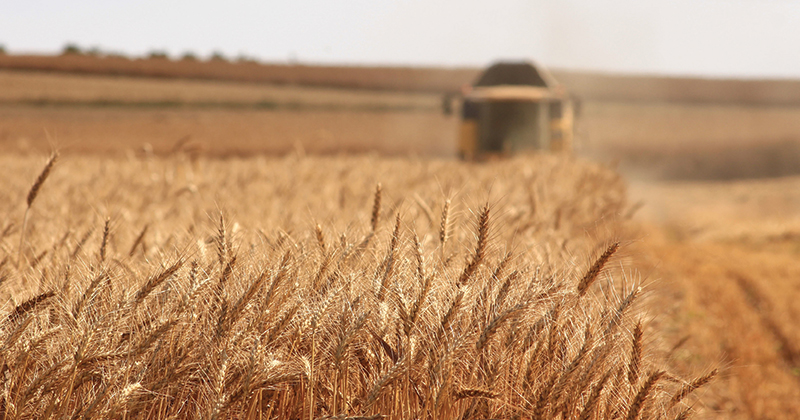
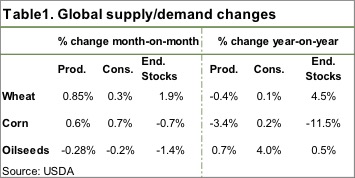 The Australian Bureau of Agricultural Resource Economics and Sciences (ABARES) made an interesting move this week, warning of crop downgrades. Meanwhile the United States Department of Agriculture (USDA) made their monthly predictions.
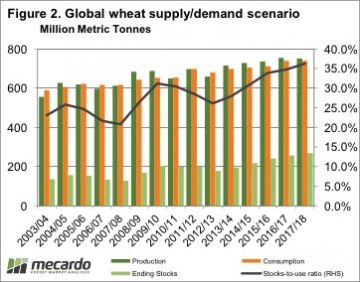 Global wheat production was lifted 5.3mmt thanks to improving production in the EU and India. The USDA did downgrade the Australian crop by 1mmt to 21.5mmt. Figure 2 shows we are still well and truly on track for a record carryout for 17/18.
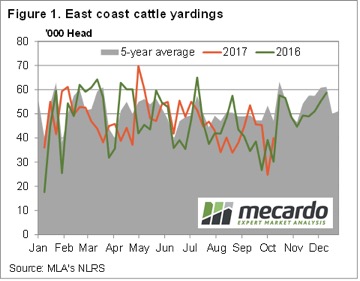 There was a significant jump in yardings this week, but this failed to dampen cattle prices, which continued to rally. In fact, it seems to be rain that is doing the opposite of dampening prices, with prices finding strength, almost across the board.
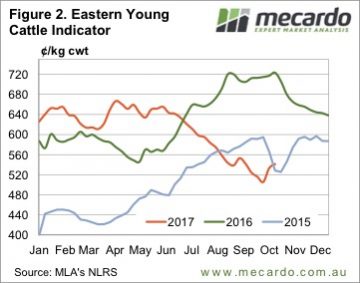 The Eastern Young Cattle Indicator (EYCI) continued to rally, but the pace slowed. The EYCI gained 8¢ this week, to lift it to the levels of five weeks ago, at 541.25¢/kg cwt (Figure 2).
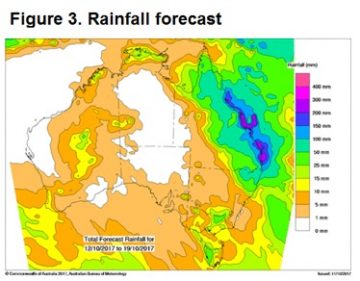 The forecast says there is more to come for at least half of Queensland (figure 3), and this suggests that there is only one way for cattle prices to go next week, especially young cattle prices.
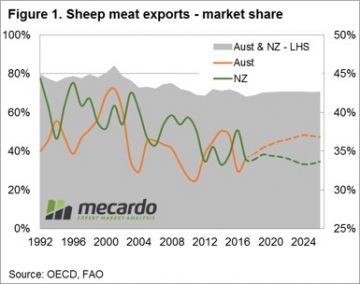 Read the earlier analysis
 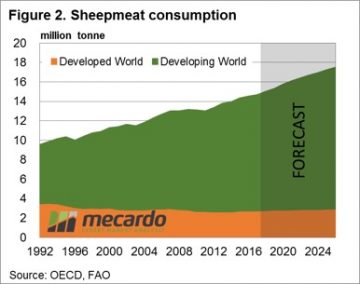 Turning to global consumption levels we can see that the majority of growth has been, and is expected to continue, coming predominantly from the developing world – figure 2. While sheepmeat consumption levels can be satisfied partially by domestic production the fact remains that for many countries their consumption will outweigh their production and the need to import sheepmeat will be required to satisfy the demand. This is important, particularly in relation to non-goat sheepmeat as the only two significant global exporters of sheep and lamb product are NZ and Australia.
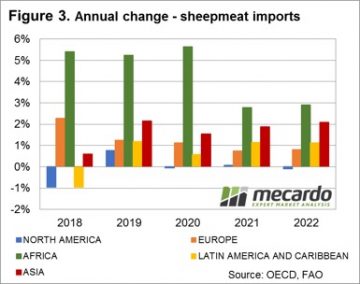 Further analysis of the breakdown of the forecast Asian sheepmeat import flows shows that much of the growth is anticipated to come from China, Malaysia, Saudi Arabia, Indonesia, and Vietnam. These are already key export destinations for our red meat products and strong trade ties already exist between Australia and these nations.
 Despite the beginnings of Spring flush being fairly evident at the saleyard this week, prices managed to gain across all categories of national lamb and sheep markets. Seemingly, a Friday the 13th close to the week a lucky one for ovines.
 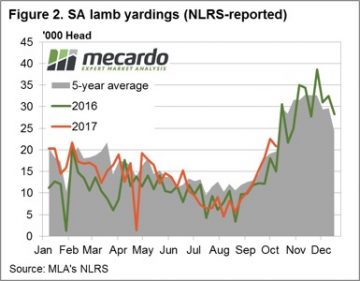 The firm prices were unable to be weighed down by increased volumes at the saleyard along the East Coast for both lamb and mutton with throughput levels up 2.1% and 28.5%, respectively. The lamb yarding pattern for SA and Victoria continuing to show evidence that the seasonal Spring flush is underway with both states continuing to trend above the 2016 trend, and higher than the long term average for this time of the year – figures 2 and 3.
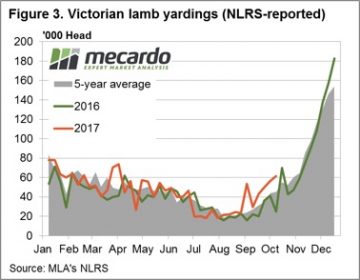
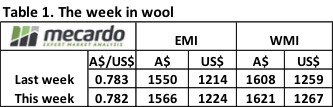 The continued good news regarding the wool market is providing a positive setting for wool producers; with some now locking in prices for future clips and making decisions to expand production. A quick look at relative prices shows the EMI is 248 cents higher year-on-year, while in US$ terms it is up 231 cents.
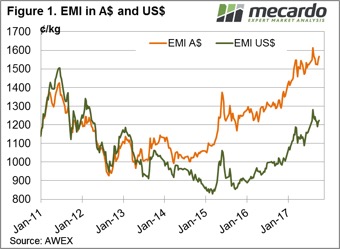 This week the market opened strongly on Wednesday then settled into a “firm” trend resulting in a good result for sellers; and they responded by only Passing-in 3.3% of the 38,103 bales offered- well below the season average of 7.3%.
 The scramble for “low mid break” lots resulted in these types at times posting extreme prices. AWEX report that up to 70 cent premiums are evident for wool with the “right” specifications. This is a response to the
 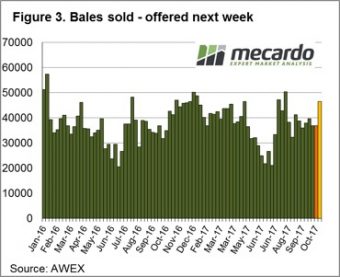 Despite an increasing offering that is normal as Spring shearing clips arrive, it is difficult to see anything but positive times (at least in the short term) for wool.